Estimated zip code population in 2022: 42,711 Zip code population in 2010: 40,295 Zip code population in 2000: 50,811
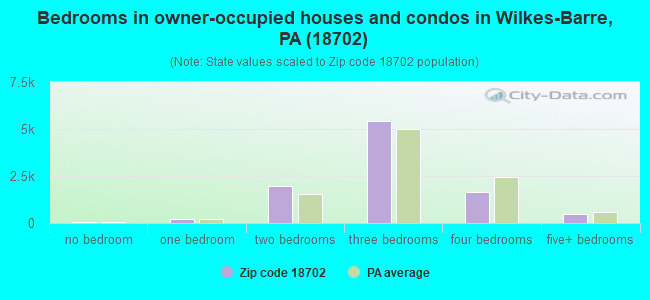
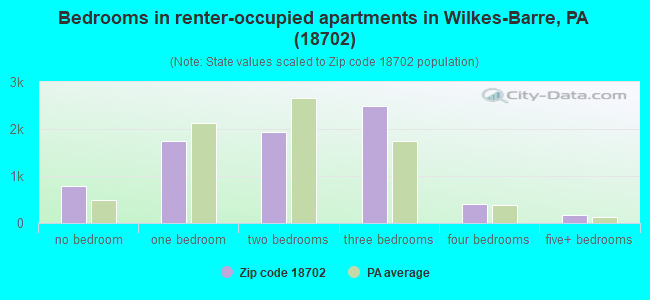
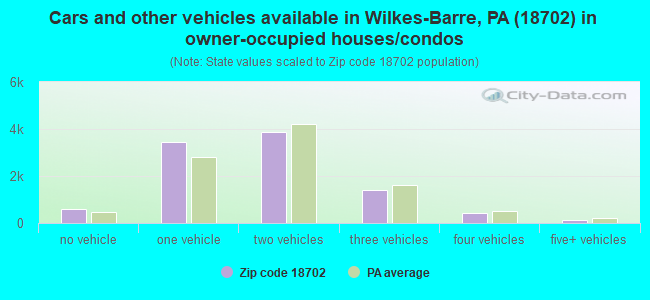
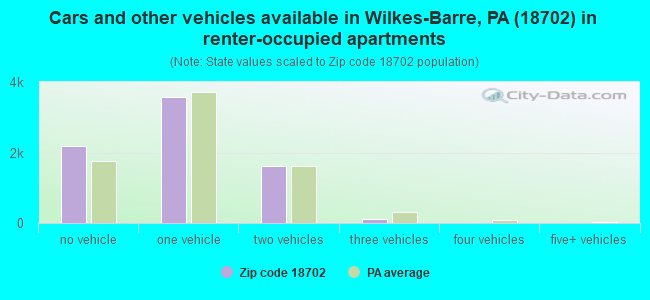
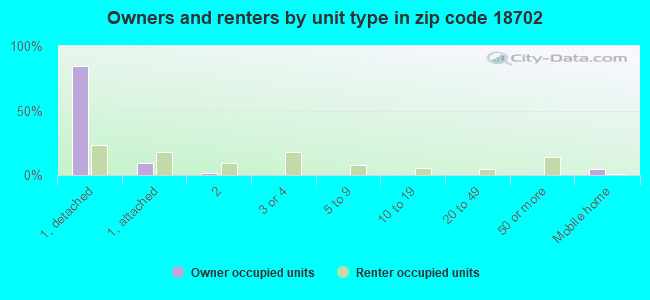
Houses and condos: 20,130 Renter-occupied apartments: 7,533
% of renters here:
43%
State:
31%
March 2022 cost of living index in zip code 18702: 93.2 (less than average, U.S. average is 100)
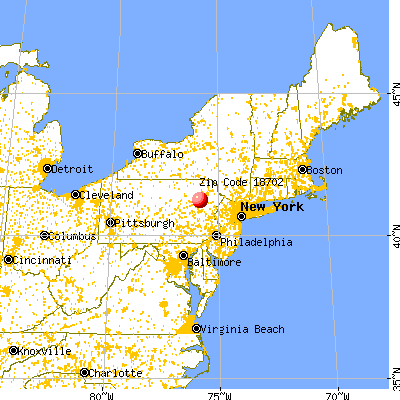
Land area: 69.3 sq. mi. Water area: 1.6 sq. mi.
Population density: 616 people per square mile
(low).
OSM Map
General Map
Google Map
MSN Map
OSM Map
General Map
Google Map
MSN Map
OSM Map
General Map
Google Map
MSN Map
OSM Map
General Map
Google Map
MSN Map
Please wait while loading the map...
Real estate property taxes paid for housing units in 2022:
This zip code:
1.8% ($2,079)
Pennsylvania:
1.3% ($3,094)
Median real estate property taxes paid for housing units with mortgages in 2022: $2,416 (1.7%) Median real estate property taxes paid for housing units with no mortgage in 2022: $1,739 (1.8%)
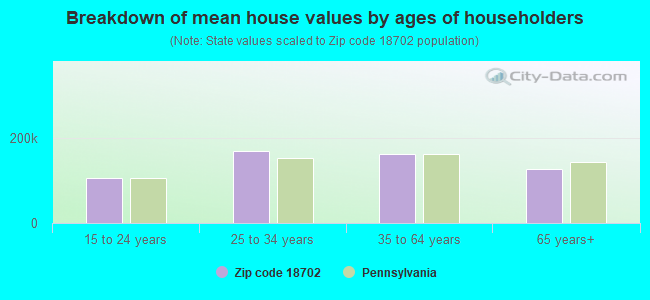
Estimated median house/condo value in 2022: $116,347
18702:
$116,347
Pennsylvania:
$245,500
According to our research of Pennsylvania and other state lists, there were 80 registered sex offenders living in 18702 zip code as of April 27, 2024. The ratio of all residents to sex offenders in zip code 18702 is 502 to 1. The ratio of registered sex offenders to all residents in this zip code is near the state average.
Median resident age:
This zip code:
38.3 years
Pennsylvania median age:
40.9 years
Average household size:
This zip code:
2.4 people
Pennsylvania:
2.4 people
Averages for the 2020 tax year for zip code 18702, filed in 2021:
Average Adjusted Gross Income (AGI) in 2020: $45,922 (Individual Income Tax Returns)
Here:
$45,922
State:
$75,707
Salary/wage: $38,353 (reported on 82.1% of returns)
Here:
$38,353
State:
$62,806
(% of AGI for various income ranges: 1015.0% for AGIs below $25k, 3210.9% for AGIs $25k-50k, 5943.7% for AGIs $50k-75k, 8886.3% for AGIs $75k-100k, 15743.5% for AGIs $100k-200k, 65125.5% for AGIs over 200k)
Taxable interest for individuals: $1,621 (reported on 18.6% of returns)
This zip code:
$1,621
Pennsylvania:
$1,633
(% of AGI for various income ranges: 6.8% for AGIs below $25k, 14.5% for AGIs $25k-50k, 44.8% for AGIs $50k-75k, 72.5% for AGIs $75k-100k, 180.0% for AGIs $100k-200k, 1625.5% for AGIs over 200k)
Ordinary dividends: $5,007 (reported on 13.1% of returns)
Here:
$5,007
State:
$7,382
(% of AGI for various income ranges: 13.4% for AGIs below $25k, 17.4% for AGIs $25k-50k, 66.6% for AGIs $50k-75k, 152.8% for AGIs $75k-100k, 347.0% for AGIs $100k-200k, 5130.9% for AGIs over 200k)
Net capital gain/loss in AGI: +$7,551 (reported on 9.7% of returns)
Here:
+$7,551
State:
+$23,522
(% of AGI for various income ranges: 4.4% for AGIs below $25k, 12.9% for AGIs $25k-50k, 75.4% for AGIs $50k-75k, 126.7% for AGIs $75k-100k, 502.1% for AGIs $100k-200k, 6144.5% for AGIs over 200k)
Profit/loss from business: +$12,876 (reported on 10.2% of returns)
Here:
+$12,876
State:
+$16,274
(% of AGI for various income ranges: 67.8% for AGIs below $25k, 65.5% for AGIs $25k-50k, 129.4% for AGIs $50k-75k, 231.4% for AGIs $75k-100k, 503.0% for AGIs $100k-200k, 8682.7% for AGIs over 200k)
Taxable individual retirement arrangement distribution: $14,176 (reported on 6.9% of returns)
18702:
$14,176
Pennsylvania:
$18,583
(% of AGI for various income ranges: 37.6% for AGIs below $25k, 48.5% for AGIs $25k-50k, 167.5% for AGIs $50k-75k, 394.9% for AGIs $75k-100k, 606.5% for AGIs $100k-200k, 2542.7% for AGIs over 200k)
Self-employed (Keogh) retirement plans: $21,425 (reported on 0.2% of returns)
18702:
$21,425
Pennsylvania:
$25,407
(% of AGI for various income ranges: 779.1% for AGIs over 200k)
Total itemized deductions: $34,766 (reported on 2.2% of returns)
Here:
$34,766
State:
$34,850
(% of AGI for various income ranges: 10.4% for AGIs below $25k, 36.8% for AGIs $25k-50k, 109.7% for AGIs $50k-75k, 232.6% for AGIs $75k-100k, 358.5% for AGIs $100k-200k, 5246.4% for AGIs over 200k)
Charity contributions: $8,042 (reported on 1.7% of returns)
Here:
$8,042
State:
$12,392
(% of AGI for various income ranges: 5.7% for AGIs $25k-50k, 13.8% for AGIs $50k-75k, 34.2% for AGIs $75k-100k, 69.0% for AGIs $100k-200k, 1126.4% for AGIs over 200k)
Taxes paid: $7,216 (reported on 2.2% of returns)
18702:
$7,216
State:
$8,200
(% of AGI for various income ranges: 1.7% for AGIs below $25k, 6.7% for AGIs $25k-50k, 24.5% for AGIs $50k-75k, 66.5% for AGIs $75k-100k, 109.2% for AGIs $100k-200k, 724.5% for AGIs over 200k)
Earned income credit: $2,409 (reported on 23.7% of returns)
Here:
$2,409
State:
$2,100
(% of AGI for various income ranges: 116.1% for AGIs below $25k, 75.2% for AGIs $25k-50k, 1.1% for AGIs $50k-75k)
Percentage of individuals using paid preparers for their 2020 taxes: 93.5%
Here:
93%
State:
92%
(% for various income ranges: 93.4% for AGIs below $25k, 94.6% for AGIs $25k-50k, 92.6% for AGIs $50k-75k, 92.5% for AGIs $75k-100k, 91.5% for AGIs $100k-200k, 91.2% for AGIs over 200k)
Averages for the 2012 tax year for zip code 18702, filed in 2013:
Average Adjusted Gross Income (AGI) in 2012: $40,003 (Individual Income Tax Returns)
Here:
$40,003
State:
$61,346
Salary/wage: $34,678 (reported on 84.2% of returns)
Here:
$34,678
State:
$51,902
(% of AGI for various income ranges: 75.5% for AGIs below $25k, 80.3% for AGIs $25k-50k, 76.1% for AGIs $50k-75k, 76.8% for AGIs $75k-100k, 75.2% for AGIs $100k-200k, 47.6% for AGIs over 200k)
Taxable interest for individuals: $1,329 (reported on 27.3% of returns)
This zip code:
$1,329
Pennsylvania:
$1,588
(% of AGI for various income ranges: 0.8% for AGIs below $25k, 0.8% for AGIs $25k-50k, 0.8% for AGIs $50k-75k, 0.4% for AGIs $75k-100k, 0.8% for AGIs $100k-200k, 2.1% for AGIs over 200k)
Ordinary dividends: $3,289 (reported on 17.9% of returns)
Here:
$3,289
State:
$5,827
(% of AGI for various income ranges: 1.2% for AGIs below $25k, 0.9% for AGIs $25k-50k, 0.9% for AGIs $50k-75k, 1.0% for AGIs $75k-100k, 1.3% for AGIs $100k-200k, 4.2% for AGIs over 200k)
Net capital gain/loss in AGI: +$4,205 (reported on 10.7% of returns)
Here:
+$4,205
State:
+$14,495
(% of AGI for various income ranges: 0.2% for AGIs $25k-50k, 0.3% for AGIs $50k-75k, 0.7% for AGIs $75k-100k, 0.9% for AGIs $100k-200k, 5.7% for AGIs over 200k)
Profit/loss from business: +$14,785 (reported on 8.7% of returns)
Here:
+$14,785
State:
+$16,268
(% of AGI for various income ranges: 4.7% for AGIs below $25k, 1.7% for AGIs $25k-50k, 1.6% for AGIs $50k-75k, 1.6% for AGIs $75k-100k, 3.0% for AGIs $100k-200k, 8.2% for AGIs over 200k)
Taxable individual retirement arrangement distribution: $11,735 (reported on 8.8% of returns)
18702:
$11,735
Pennsylvania:
$14,550
(% of AGI for various income ranges: 2.5% for AGIs below $25k, 1.9% for AGIs $25k-50k, 2.6% for AGIs $50k-75k, 2.5% for AGIs $75k-100k, 3.1% for AGIs $100k-200k, 3.1% for AGIs over 200k)
Self-employment retirement plans: $19,520 (reported on 0.3% of returns)
18702:
$19,520
Pennsylvania:
$20,922
Total itemized deductions: $19,464 (19% of AGI, reported on 16.8% of returns)
Here:
$19,464
State:
$23,538
Here:
19.4% of AGI
State:
18.4% of AGI
(% of AGI for various income ranges: 3.7% for AGIs below $25k, 5.5% for AGIs $25k-50k, 7.4% for AGIs $50k-75k, 8.5% for AGIs $75k-100k, 12.7% for AGIs $100k-200k, 12.2% for AGIs over 200k)
Charity contributions: $2,626 (reported on 13.2% of returns)
Here:
$2,626
State:
$4,025
(% of AGI for various income ranges: 0.3% for AGIs below $25k, 0.4% for AGIs $25k-50k, 0.7% for AGIs $50k-75k, 0.8% for AGIs $75k-100k, 1.4% for AGIs $100k-200k, 1.8% for AGIs over 200k)
Taxes paid: $7,887 (reported on 16.8% of returns)
18702:
$7,887
State:
$9,982
(% of AGI for various income ranges: 0.8% for AGIs below $25k, 1.7% for AGIs $25k-50k, 2.7% for AGIs $50k-75k, 3.7% for AGIs $75k-100k, 6.0% for AGIs $100k-200k, 5.5% for AGIs over 200k)
Earned income credit: $2,216 (reported on 23.7% of returns)
Here:
$2,216
State:
$2,106
(% of AGI for various income ranges: 7.0% for AGIs below $25k, 1.1% for AGIs $25k-50k)
Percentage of individuals using paid preparers for their 2012 taxes: 54.0%
Here:
54%
State:
53%
(% for various income ranges: 51.1% for AGIs below $25k, 52.5% for AGIs $25k-50k, 58.6% for AGIs $50k-75k, 60.2% for AGIs $75k-100k, 65.0% for AGIs $100k-200k, 78.3% for AGIs over 200k)
Averages for the 2004 tax year for zip code 18702, filed in 2005:
Average Adjusted Gross Income (AGI) in 2004: $34,240 (Individual Income Tax Returns)
Here:
$34,240
State:
$48,049
Salary/wage: $30,766 (reported on 84.9% of returns)
Here:
$30,766
State:
$42,646
(% of AGI for various income ranges: 84.5% for AGIs below $10k, 76.6% for AGIs $10k-25k, 82.5% for AGIs $25k-50k, 81.5% for AGIs $50k-75k, 83.0% for AGIs $75k-100k, 59.4% for AGIs over 100k)
Taxable interest for individuals: $1,251 (reported on 44.1% of returns)
This zip code:
$1,251
Pennsylvania:
$1,657
(% of AGI for various income ranges: 4.5% for AGIs below $10k, 1.9% for AGIs $10k-25k, 1.3% for AGIs $25k-50k, 1.6% for AGIs $50k-75k, 1.1% for AGIs $75k-100k, 1.7% for AGIs over 100k)
Taxable dividends: $2,282 (reported on 23.4% of returns)
Here:
$2,282
State:
$3,566
(% of AGI for various income ranges: 2.9% for AGIs below $10k, 1.2% for AGIs $10k-25k, 1.0% for AGIs $25k-50k, 1.0% for AGIs $50k-75k, 1.1% for AGIs $75k-100k, 3.0% for AGIs over 100k)
Net capital gain/loss: +$3,156 (reported on 15.4% of returns)
Here:
+$3,156
State:
+$9,716
(% of AGI for various income ranges: -1.3% for AGIs below $10k, 0.1% for AGIs $10k-25k, 0.3% for AGIs $25k-50k, 0.3% for AGIs $50k-75k, 0.5% for AGIs $75k-100k, 5.4% for AGIs over 100k)
Profit/loss from business: +$14,494 (reported on 8.4% of returns)
Here:
+$14,494
State:
+$14,267
(% of AGI for various income ranges: 2.5% for AGIs below $10k, 2.9% for AGIs $10k-25k, 2.2% for AGIs $25k-50k, 1.8% for AGIs $50k-75k, 3.1% for AGIs $75k-100k, 7.4% for AGIs over 100k)
IRA payment deduction: $2,900 (reported on 2.3% of returns)
18702:
$2,900
Pennsylvania:
$2,903
(% of AGI for various income ranges: 0.1% for AGIs below $10k, 0.2% for AGIs $10k-25k, 0.3% for AGIs $25k-50k, 0.2% for AGIs $50k-75k, 0.2% for AGIs $75k-100k, 0.1% for AGIs over 100k)
Self-employed pension: $13,831 (reported on 0.4% of returns)
Here:
$13,831
Pennsylvania:
$14,674
(% of AGI for various income ranges: 0.0% for AGIs $25k-50k, 0.1% for AGIs $50k-75k, 0.1% for AGIs $75k-100k, 0.6% for AGIs over 100k)
Total itemized deductions: $15,919 (20% of AGI, reported on 18.7% of returns)
Here:
$15,919
State:
$18,804
Here:
19.7% of AGI
State:
19.5% of AGI
(% of AGI for various income ranges: 3.8% for AGIs below $10k, 3.8% for AGIs $10k-25k, 6.5% for AGIs $25k-50k, 9.2% for AGIs $50k-75k, 11.9% for AGIs $75k-100k, 12.5% for AGIs over 100k)
Charity contributions deductions: $2,445 (3% of AGI, reported on 16.8% of returns)
Here:
$2,445
State:
$3,337
Here:
2.9% of AGI
State:
3.3% of AGI
(% of AGI for various income ranges: 0.2% for AGIs below $10k, 0.4% for AGIs $10k-25k, 0.7% for AGIs $25k-50k, 1.1% for AGIs $50k-75k, 1.3% for AGIs $75k-100k, 2.5% for AGIs over 100k)
Total tax: $5,091 (reported on 69.5% of returns)
18702:
$5,091
State:
$8,008
(% of AGI for various income ranges: 1.7% for AGIs below $10k, 4.1% for AGIs $10k-25k, 7.2% for AGIs $25k-50k, 9.1% for AGIs $50k-75k, 11.0% for AGIs $75k-100k, 19.6% for AGIs over 100k)
Earned income credit: $1,581 (reported on 17.6% of returns)
Here:
$1,581
State:
$1,643
Percentage of individuals using paid preparers for their 2004 taxes: 55.4%
Here:
55%
State:
56%
(% for various income ranges: 48.9% for AGIs below $10k, 55.7% for AGIs $10k-25k, 56.1% for AGIs $25k-50k, 58.9% for AGIs $50k-75k, 62.9% for AGIs $75k-100k, 69.0% for AGIs over 100k)
Likely homosexual households (counted as self-reported same-sex unmarried-partner households)
Lesbian couples: 0.0% of all households
Gay men: 0.1% of all households
Household received Food Stamps/SNAP in the past 12 months: 4,521 Household did not receive Food Stamps/SNAP in the past 12 months: 12,956
Women who had a birth in the past 12 months: 635 (315 now married, 291 unmarried) Women who did not have a birth in the past 12 months: 9,766 (3,183 now married, 6,607 unmarried)
Housing units in zip code 18702 with a mortgage: 4,861 (622 second mortgage, 15 home equity loan, 540 both second mortgage and home equity loan) Houses without a mortgage: 298
Median monthly owner costs for units with a mortgage: $1,183 Median monthly owner costs for units without a mortgage: $524
Residents with income below the poverty level in 2022:
This zip code:
19.3%
Whole state:
11.8%
Residents with income below 50% of the poverty level in 2022:
This zip code:
8.5%
Whole state:
6.1%
Median number of rooms in houses and condos:
Here:
6.3
State:
6.8
Median number of rooms in apartments:
Here:
4.6
State:
4.3
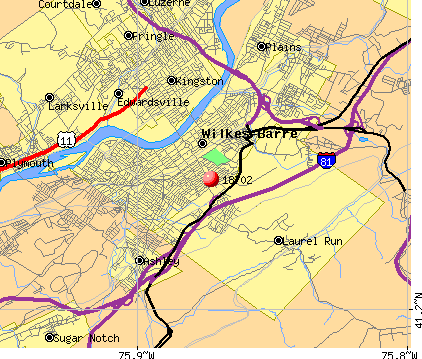
Notable locations in this zip code not listed on our city pages
Notable locations in zip code 18702: Laflin Station (A), Wilkes-Barre Golf Course (B), Pocono Downs (C), Laflin Volunteer Fire Department (D), Bear Creek Township Volunteer Hose Fire Company (E), Keystone Colliery (F), Yatesville Station (G), Laflin Station (H), Charles Waller North (I), Charles Wallter South (J), Colonel Isaac Barre Hall (K), Community Service House (L), Dorothy Dickson Darte Center for the Performing Arts (M), Frances Slocum Hall (N), John Doane Hall (O), Major General John Sullivan Hall (P), Paul A O'Hop Hall (Q), President's House - Wilkes University (R), John Heinz Institute of Rehabilitation (S), Wilkes - Barre Fire Department South Station (T). Display/hide their locations on the map
Lakes, reservoirs, and swamps: Buck Pond (A), Lake Aleeda (B), Mountain Lake (C), Meadow Lake (D), Lake Aleeda (E), Meadow Run Lake (F), Mud Pond (G), Deep Hollow Pond (H). Display/hide their locations on the map
Streams, rivers, and creeks: Mud Run (A), Geneceda Creek (B), Meadow Run (C), Snider Run (D), Little Bear Creek (E), Lampblack Creek (F), Deep Creek (G), Red Run (H). Display/hide their locations on the map
3,233 married couples with children.
4,429 single-parent households (847 men, 3,582 women).
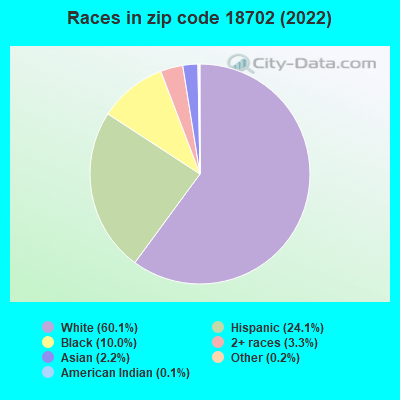
78.9% of residents of 18702 zip code speak English at home.
18.5% of residents speak Spanish at home (45% very well, 23% well, 23% not well, 10% not at all).
1.7% of residents speak other Indo-European language at home (74% very well, 25% well, 1% not well).
1.5% of residents speak Asian or Pacific Island language at home (69% very well, 22% well, 9% not well).
0.2% of residents speak other language at home (89% very well, 11% well).
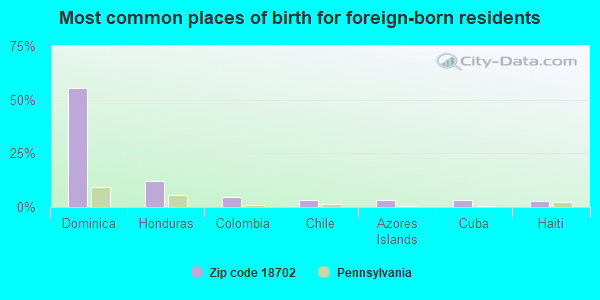
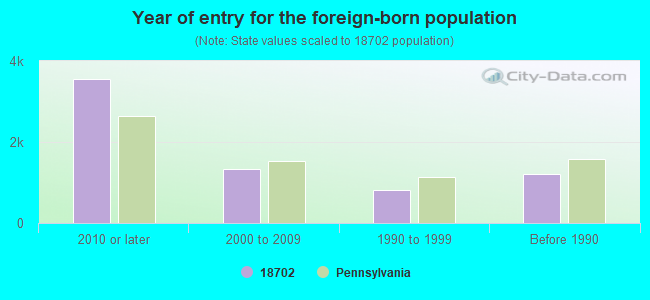
Foreign born population: 5,435 (12.7%) (42.8% of them are naturalized citizens)
Facilities with environmental interests located in this zip code:
AIR PROD & CHEM WILKES BARRE (827 SANS SOUCI HWY in WILKES BARRE TOWNSHIP, PA)
STATE MASTER (Pennsylvania database) - RCRIS-PAD003054202, HAZARDOUS WASTE PROGRAM, PCS-PAR202226, National Pollutant Discharge Elimination System Permit National Pollutant Discharge Elimination System NON-MAJOR (Tracking pollutant discharge elimination systems) - permit HAZARDOUS WASTE BIENNIAL REPORTER (Resource Conservation and Recovery Act (tracking hazardous waste)) Small Quantity Generators, between 100 kg and 1000 kg of hazardous waste/month (Resource Conservation and Recovery Act (tracking hazardous waste)) - notification Business SIC classification: FABRICATED PLATE WORK (BOILER SHOPS) Business NAICS classification: PLATE WORK MANUFACTURING.; ALL OTHER INDUSTRIAL MACHINERY MANUFACTURING. Organizations: OPERNAME (CONTACT/OPERATOR)
, AIR PRODUCTS & CHEMICAL (CONTACT/OWNER)
, AIR PRODUCTS AND CHEMICALS, INC. (CONTACT/OWNER)
Alternative names: AIR PRODUCTS & CHEMICALS, AIR PRODS & CHEM INC MFG
AUSTIN TRUCK RENTAL (100 SECOND ST in WILKES BARRE TOWNSHIP, PA)
STATE MASTER (Pennsylvania database) - RCRIS-PAD987329174, HAZARDOUS WASTE PROGRAM (Resource Conservation and Recovery Act (tracking hazardous waste)) Business SIC classification: HELP SUPPLY SERVICES; TRUCK RENTAL AND LEASING, WITHOUT DRIVERS Organizations: OPERNAME (CONTACT/OPERATOR)
AUTO WORKS (151 N DIAMOND ST in WILKES BARRE TOWNSHIP, PA)
STATE MASTER (Pennsylvania database) - RCRIS-PAD135144426, HAZARDOUS WASTE PROGRAM (Resource Conservation and Recovery Act (tracking hazardous waste)) Organizations: OPERNAME (CONTACT/OPERATOR)
Alternative names: AUTOWORKS INC
BEAR CREEK TWP EL SCH ( in WILKES BARRE, PA)
(National Center for Education Statistics) - STATE ID-2853 Organizations: WILKES-BARRE AREA SD (SCHOOL DISTRICT)
ABF FREIGHT SYSTEM INC (40 NEW FREDERICK ST in WILKES BARRE, PA)
National Pollutant Discharge Elimination System NON-MAJOR (Tracking pollutant discharge elimination systems) - permit Business SIC classification: TRUCKING, EXCEPT LOCAL
ADDY ASPHALT CO., INC. (LAFLIN ROAD in WILKES-BARRE, PA)
AIR MINOR (AIRS/AFS) Business SIC classification: ASPHALT PAVING MIXTURES AND BLOCKS
AMCRAFT INC/WILKES BARRE (447 NEW GROVE ST in WILKES BARRE, PA)
AIR MINOR (AIRS/AFS) Business SIC classification: WOOD HOUSEHOLD FURNITURE, EXCEPT UPHOLSTERED
AMSA 32 WILKES BARRE (100 STEPHENS RD in WILKES BARRE, PA) . Federal Facility. U.S. ARMY
Small Quantity Generators, between 100 kg and 1000 kg of hazardous waste/month (Resource Conservation and Recovery Act (tracking hazardous waste)) - notification Organizations: OPERNAME (CONTACT/OPERATOR)
, 99TH REGIONAL SUPPORT COMMAND (CONTACT/OWNER)
ARA SERVICES INC (777 SAN SOUCI PKWY in WILKES-BARRE, PA)
Small Quantity Generators, between 100 kg and 1000 kg of hazardous waste/month (Resource Conservation and Recovery Act (tracking hazardous waste)) - notification Organizations: OPERNAME (CONTACT/OPERATOR)
, ARA SVC INC (CONTACT/OWNER)
ATLANTIC SERVICE STATION (RTE 115 & 315 in WILKES-BARRE, PA)
Conditionally Exempt Small Quantity Generators, less than 100 kg/month of hazardous waste (Resource Conservation and Recovery Act (tracking hazardous waste)) - notification Organizations: OPERNAME (CONTACT/OPERATOR)
, ATLANTIC REFINING & MARKETING (CONTACT/OWNER)
BALESTER OPTICAL CO INC (388 N RIVER ST in WILKES-BARRE, PA)
Conditionally Exempt Small Quantity Generators, less than 100 kg/month of hazardous waste (Resource Conservation and Recovery Act (tracking hazardous waste)) - notification Organizations: OPERNAME (CONTACT/OPERATOR)
, BALESTER, FRED J (CONTACT/OWNER)
Housing units lacking complete plumbing facilities: 2.6% Housing units lacking complete kitchen facilities: 2.9%
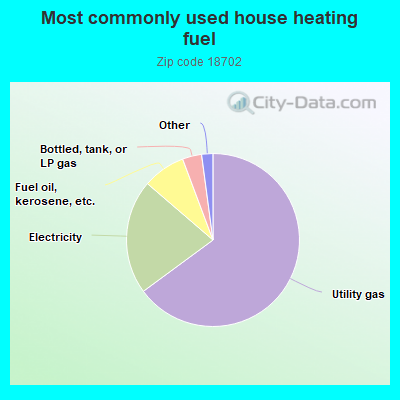
64.9%Utility gas
21.4%Electricity
8.0%Fuel oil, kerosene, etc.
3.6%Bottled, tank, or LP gas
0.8%Coal or coke
0.7%No fuel used
Population in 1990: 54,119.
Place of birth for U.S.-born residents:
This state: 25,427
Northeast: 8,147
Midwest: 488
South: 1,720
West: 402
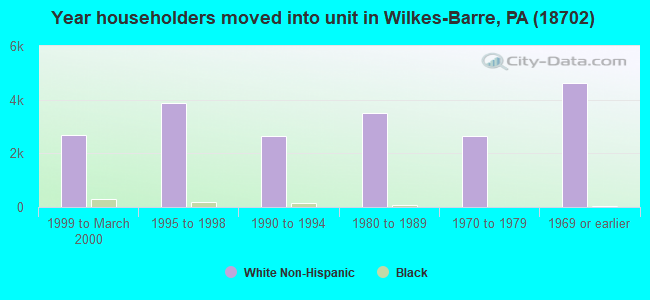
66% of the 18702 zip code residents lived in the same house 5 years ago. Out of people who lived in different houses, 76% lived in this county. Out of people who lived in different counties, 50% lived in Pennsylvania.
86% of the 18702 zip code residents lived in the same house 1 year ago. Out of people who lived in different houses, 48% moved from this county. Out of people who lived in different houses, 11% moved from different county within same state. Out of people who lived in different houses, 32% moved from different state. Out of people who lived in different houses, 9% moved from abroad.
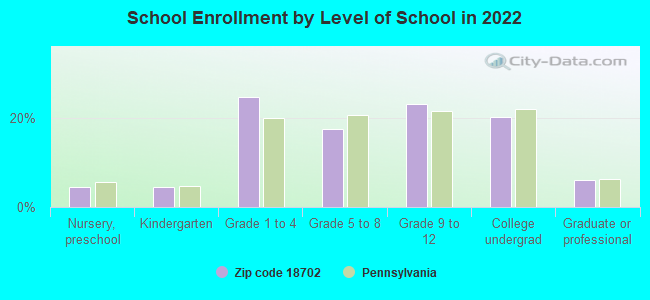
Private vs. public school enrollment:
Students in private schools in grades 1 to 8 (elementary and middle school): 404
Here:
10.9%
Pennsylvania:
15.7%
Students in private schools in grades 9 to 12 (high school): 258
Here:
12.7%
Pennsylvania:
13.4%
Students in private undergraduate colleges: 917
Here:
51.3%
Pennsylvania:
39.8%
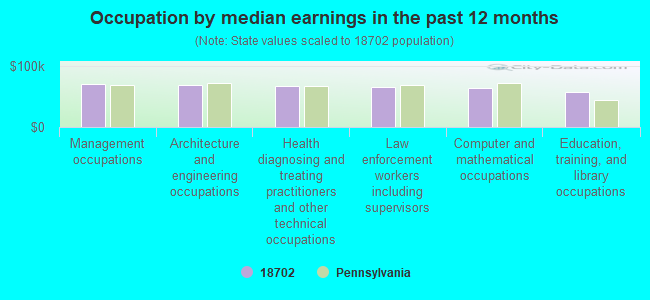
Occupation by median earnings in the past 12 months ($)
70,264Management occupations
69,478Architecture and engineering occupations
67,131Health diagnosing and treating practitioners and other technical occupations
66,073Law enforcement workers including supervisors
63,776Computer and mathematical occupations
57,716Education, training, and library occupations
Companies with biggest federal contracts located in this zip code (WILKES BARRE, PA):
CORNERSTONE TECHNOLOGIES, LLC (350 SECOND STREET; small business) : $3,847,304 in 3 contractsfrom 2001 to 2002
$2,068,000 with Navy for Construction -- Applied Research and Exploratory Development (R&D). Signed on 2001-04-12. Completion date: 2002-10-30.
$929,304 with Navy for Other Sciences Not Elsewhere Classified -- Advanced Development (R&D). Signed on 2002-07-03. Completion date: 2004-01-02.
$850,000 with Navy for Other Defense -- Applied Research and Exploratory Development (R&D). Signed on 2001-09-18. Completion date: 2003-01-14.
SMITHS AEROSPACE COMPONENTS IN (120 HAZLE ST) : $3,186,118 in 6 contractsfrom 2005 to 2006
Contracts for Gas Turbines and Jet Engines, Aircraft; Prime Moving, and Components, ADP Components by Air Force, Department of Veterans Affairs Signed by year:2000: $0; 2001: $0; 2002: $0; 2003: $0; 2004: $0; 2005: $1,581,891; 2006: $1,604,227.
Biggest contracts:
$1,604,227 with Air Force for Gas Turbines and Jet Engines, Aircraft; Prime Moving, and Components. Signed on 2006-04-07. Completion date: 2007-05-31.
$644,056, same as above.Signed on 2005-04-26. Completion date: 2006-12-29.
$556,510, same as above.Signed on 2005-09-30. Completion date: 2006-09-30.
$340,476, same as above.Signed on 2005-09-23. Completion date: 2006-09-29.
BORTON-LAWSON ENGINEERING (613 BALTIMORE DRIVE, STE 3; small business) : $853,674 in 12 contractsfrom 1999 to 2005
Contracts for Other Architect and Engineering Services, A&E Management Engineering Services, Engineering and Technical Services, Engineering -- Operational Systems Development (R&D) by Army, U.S. Army Corps of Engineers - civil program financing only, United States Mint Signed by year:2000: $279,621; 2001: $122,160; 2002: $0; 2003: $57,823; 2004: $0; 2005: $19,070; 2006: $0.
Biggest contracts:
$202,011 with Army for Other Architect and Engineering Services. Taking place in MD. Signed on 2000-10-17. Completion date: 2000-04-30.
$199,900 with U.S. Army Corps of Engineers - civil program financing only for Other Architect and Engineering Services. Signed on 1999-11-15. Completion date: 2000-03-02.
$175,100, same as above.Signed on 1999-11-16. Completion date: 2000-03-31.
$77,610, same as above.Signed on 2000-02-14. Completion date: 2000-05-01.
POSTUPAK PAINTING COMPANY (81 NEW FREDERICK ST) : $305,892 in 16 contractsfrom 1999 to 2005
Contracts for Maintenance, Repair or Alteration of Real Property -- Maintenance Buildings, Maintenance, Repair or Alteration of Real Property -- Unimproved Real Property (Land), Maintenance, Repair or Alteration of Real Property -- Hospitals and Infirmaries, Maintenance, Repair or Alteration of Real Property -- Troop Housing Facilities, and moreby Army, Department of Veterans Affairs, U.S. Army Corps of Engineers - civil program financing only Signed by year:2000: $35,171; 2001: $126,642; 2002: $17,350; 2003: $37,515; 2004: $42,209; 2005: $19,400; 2006: $0.
Biggest contracts:
$58,660 with Army for Maintenance, Repair or Alteration of Real Property -- Maintenance Buildings. Signed on 2001-10-29. Completion date: 2002-07-15.
$41,610, same as above.Signed on 2001-01-05. Completion date: 2001-07-03.
$34,350 with Army for Maintenance, Repair or Alteration of Real Property -- Unimproved Real Property (Land). Signed on 2004-07-28. Completion date: 2004-09-10.
$29,000 with Department of Veterans Affairs for Maintenance, Repair or Alteration of Real Property -- Hospitals and Infirmaries. Signed on 2000-08-15. Completion date: 2000-09-15.
INTEGRA BUSINESS CENTER, INC. (275MUNDY STREET)
$227,789 with Army for ADP Software. Signed on 2000-07-11. Completion date: 2000-08-01.
MARX SHEET METAL & MECHANICAL (373 HIGH ST; small business) : $168,056 in 3 contractsin 2006
$112,141 with Army for Air Conditioning Equipment. Signed on 2006-01-19. Completion date: 2006-01-27.
$45,935, same as above.Signed on 2006-05-30. Completion date: 2006-01-27.
$9,980, same as above.Signed on 2006-03-01. Completion date: 2006-01-27.
MOUNTAIN PRODUCTIONS, INC (80 NEW FREDERICK ST; small business) : $101,830 in 7 contractsfrom 2001 to 2006
Contracts for Facilities Operations Support Services, Scaffolding Equipment and Concrete Forms, Purchase of Structures and Facilities -- Production Buildings, Lease or Rental of Equipment -- Prefabricated Structures and Scaffolding, and moreby Army Signed by year:2000: $0; 2001: $32,242; 2002: $0; 2003: $0; 2004: $43,220; 2005: $20,148; 2006: $6,220.
Biggest contracts:
$39,000 with Army for Facilities Operations Support Services. Signed on 2004-05-25. Completion date: 2004-05-28.
$32,242 with Army for Scaffolding Equipment and Concrete Forms. Taking place in NY. Signed on 2001-05-03. Completion date: 2001-05-30.
$8,028 with Army for Purchase of Structures and Facilities -- Production Buildings. Signed on 2005-11-08. Completion date: 2005-11-14.
$6,220 with Army for Lease or Rental of Equipment -- Prefabricated Structures and Scaffolding. Signed on 2006-04-07. Completion date: 2006-05-26.
WILKES-BARRE MOTEL ASSOC LTD (1075 WILKES BARRE TWP BLV; small business) : $94,574 in 10 contractsfrom 2003 to 2005
Contracts for Lodging - Hotel/Motel by Army Signed by year:2000: $0; 2001: $0; 2002: $0; 2003: $80,993; 2004: $0; 2005: $13,581; 2006: $0.
Biggest contracts:
$29,229 with Army for Lodging - Hotel/Motel. Signed on 2003-11-13. Completion date: 2003-12-13.
$24,029, same as above.Signed on 2003-12-19. Completion date: 2003-12-13.
$10,395, same as above.Signed on 2003-02-08. Completion date: 2003-02-13.
$9,068, same as above.Signed on 2003-02-18. Completion date: 2003-02-13.
TRUGREEN-CHEMLAWN (161 SECOND STREET; small business) : $79,999 in 7 contractsfrom 2003 to 2005
Contracts for Maintenance, Repair and Rebuilding of Equipment -- Miscellaneous by Army Signed by year:2000: $0; 2001: $0; 2002: $0; 2003: $22,000; 2004: $29,000; 2005: $28,999; 2006: $0.
Biggest contracts:
$20,000 with Army for Maintenance, Repair and Rebuilding of Equipment -- Miscellaneous. Signed on 2005-05-16. Completion date: 2004-06-25.
$20,000, same as above.Signed on 2004-04-09. Completion date: 2004-06-25.
$20,000, same as above.Signed on 2003-05-01. Completion date: 2004-06-25.
$9,000, same as above.Signed on 2004-11-12. Completion date: 2004-06-25.
THYSSENKRUPP ELEVATOR CORPORA (49 DANA ST; small business) : $64,821 in 13 contractsfrom 2003 to 2006
Contracts for Other Housekeeping Services, Maintenance, Repair and Rebuilding of Equipment -- Miscellaneous by Army Signed by year:2000: $0; 2001: $0; 2002: $0; 2003: $10,524; 2004: $27,997; 2005: $21,300; 2006: $5,000.
Biggest contracts:
$11,300 with Army for Other Housekeeping Services. Signed on 2005-09-06. Completion date: 2005-09-30.
$11,300, same as above.Signed on 2004-10-01. Completion date: 2005-09-30.
$10,000, same as above.Signed on 2005-04-26. Completion date: 2005-09-30.
$6,085 with Army for Maintenance, Repair and Rebuilding of Equipment -- Miscellaneous. Signed on 2004-03-04. Completion date: 2003-09-30.
Top industries in this zip code by the number of employees in 2005:
Health Care and Social Assistance: Nursing Care Facilities (250-499: 1, 100-249: 2, 50-99: 1, 10-19: 3, 5-9: 1, 1-4: 4)
Administrative and Support and Waste Management and Remediation Services: Temporary Help Services (250-499: 1, 100-249: 2, 50-99: 1, 20-49: 1, 5-9: 1, 1-4: 1)
Information: Cable and Other Program Distribution (500-999: 1, 20-49: 1, 10-19: 2)
Health Care and Social Assistance: Specialty (except Psychiatric and Substance Abuse) Hospitals (500-999: 1)
2005 - 2018 National Fire Incident Reporting System (NFIRS) incidents
Based on the data from the years 2005 - 2018 the average number of fire incidents per year is 48. The highest number of reported fire incidents - 166 took place in 2012, and the least - 0 in 2006. The data has a rising trend.
When looking into fire subcategories, the most incidents belonged to: Structure Fires (48.7%), and Outside Fires (34.0%).
Fire incident types reported to NFIRS in Zip Code 18702


 Nearest zip codes: 18602, 18640, 18705, 18641, 18642, 18701.


 Based on the data from the years 2005 - 2018 the average number of fire incidents per year is 48. The highest number of reported fire incidents - 166 took place in 2012, and the least - 0 in 2006. The data has a rising trend.
 When looking into fire subcategories, the most incidents belonged to: Structure Fires (48.7%), and Outside Fires (34.0%).