Estimated zip code population in 2022: 27,598 Zip code population in 2010: 24,479 Zip code population in 2000: 21,214
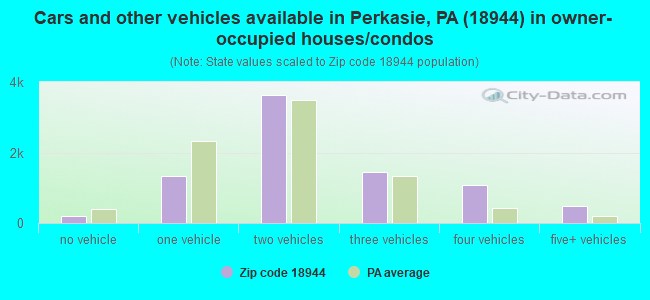
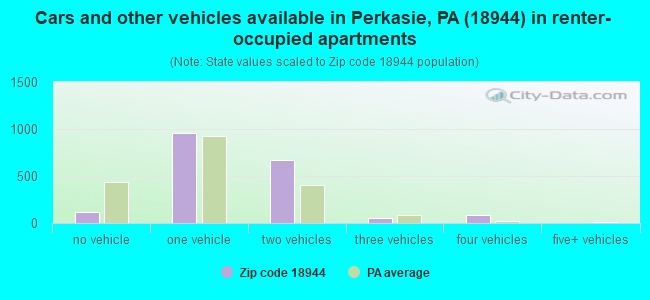
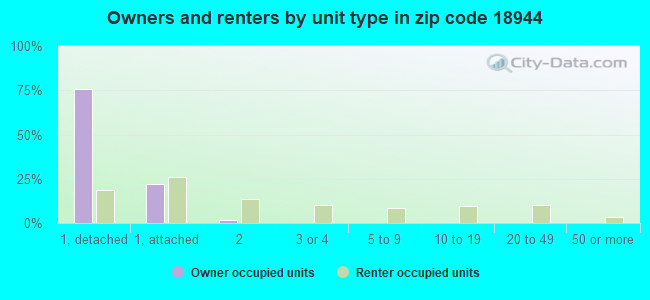
Houses and condos: 10,421 Renter-occupied apartments: 1,878
% of renters here:
19%
State:
31%
March 2022 cost of living index in zip code 18944: 103.6 (near average, U.S. average is 100)
Land area: 46.2 sq. mi. Water area: 0.9 sq. mi.
Population density: 597 people per square mile
(low).
OSM Map
General Map
Google Map
MSN Map
OSM Map
General Map
Google Map
MSN Map
OSM Map
General Map
Google Map
MSN Map
OSM Map
General Map
Google Map
MSN Map
Please wait while loading the map...
Real estate property taxes paid for housing units in 2022:
This zip code:
1.2% ($5,056)
Pennsylvania:
1.3% ($3,094)
Median real estate property taxes paid for housing units with mortgages in 2022: $5,187 (1.2%) Median real estate property taxes paid for housing units with no mortgage in 2022: $4,630 (1.1%)
Business Search- 14 Million verified businesses
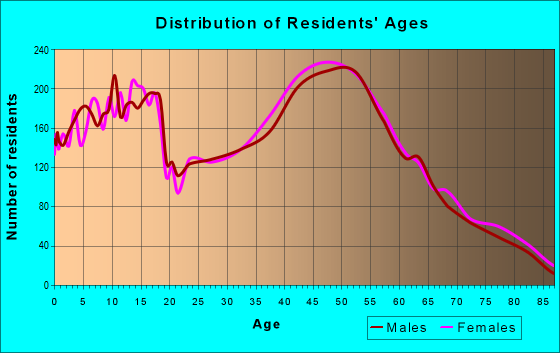
Males: 14,444
(52.3%)
Females: 13,153
(47.7%)
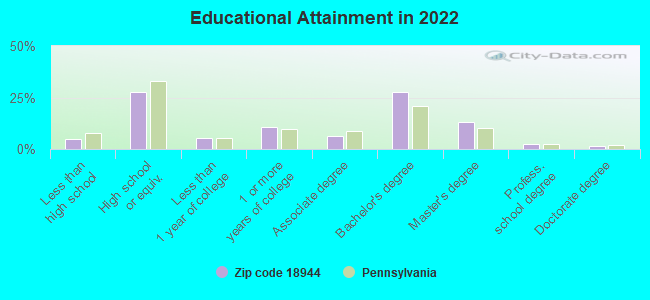
For population 25 years and over in 18944:
High school or higher: 95.6%
Bachelor's degree or higher: 45.0%
Graduate or professional degree: 17.0%
Unemployed: 3.3%
Mean travel time to work (commute): 29.9 minutes
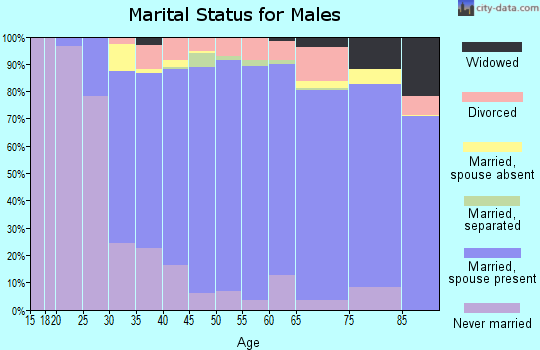
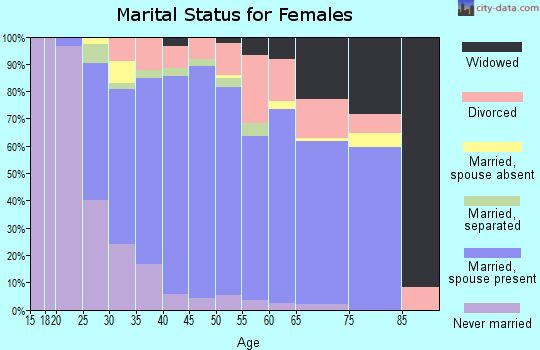
For population 15 years and over in 18944:
Never married: 29.9%
Now married: 59.9%
Separated: 0.8%
Widowed: 3.4%
Divorced: 5.9%
Zip code 18944 compared to state average:
Median household income above state average.
Median house value above state average.
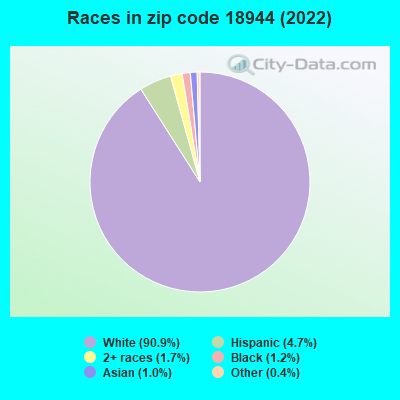
Black race population percentage significantly below state average.
Hispanic race population percentage below state average.
Foreign-born population percentage significantly below state average.
Renting percentage below state average.
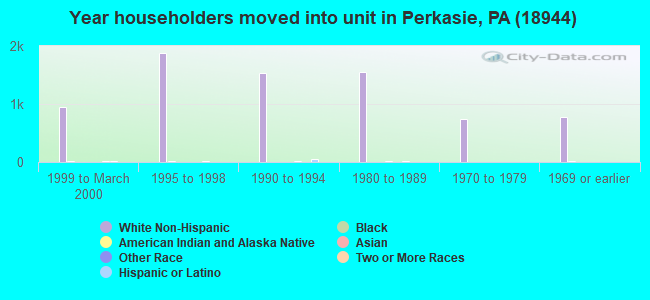
Length of stay since moving in above state average.
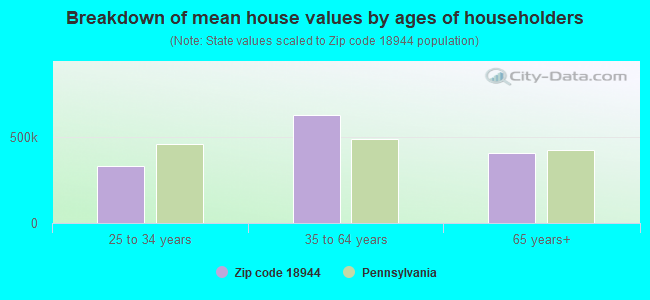
Estimated median house/condo value in 2022: $411,989
18944:
$411,989
Pennsylvania:
$245,500
According to our research of Pennsylvania and other state lists, there were 16 registered sex offenders living in 18944 zip code as of April 27, 2024. The ratio of all residents to sex offenders in zip code 18944 is 1,597 to 1. The ratio of registered sex offenders to all residents in this zip code is much lower than the state average.
Median resident age:
This zip code:
41.6 years
Pennsylvania median age:
40.9 years
Average household size:
This zip code:
2.7 people
Pennsylvania:
2.4 people
Averages for the 2020 tax year for zip code 18944, filed in 2021:
Average Adjusted Gross Income (AGI) in 2020: $95,331 (Individual Income Tax Returns)
Here:
$95,331
State:
$75,707
Salary/wage: $82,775 (reported on 83.2% of returns)
Here:
$82,775
State:
$62,806
(% of AGI for various income ranges: 1153.1% for AGIs below $25k, 3659.3% for AGIs $25k-50k, 6883.5% for AGIs $50k-75k, 9971.6% for AGIs $75k-100k, 18542.7% for AGIs $100k-200k, 79195.5% for AGIs over 200k)
Taxable interest for individuals: $1,181 (reported on 46.3% of returns)
This zip code:
$1,181
Pennsylvania:
$1,633
(% of AGI for various income ranges: 34.8% for AGIs below $25k, 30.0% for AGIs $25k-50k, 57.0% for AGIs $50k-75k, 75.6% for AGIs $75k-100k, 127.6% for AGIs $100k-200k, 594.8% for AGIs over 200k)
Ordinary dividends: $7,477 (reported on 29.2% of returns)
Here:
$7,477
State:
$7,382
(% of AGI for various income ranges: 52.5% for AGIs below $25k, 70.8% for AGIs $25k-50k, 154.7% for AGIs $50k-75k, 163.9% for AGIs $75k-100k, 276.3% for AGIs $100k-200k, 4571.2% for AGIs over 200k)
Net capital gain/loss in AGI: +$13,898 (reported on 24.9% of returns)
Here:
+$13,898
State:
+$23,522
(% of AGI for various income ranges: 17.0% for AGIs below $25k, 64.7% for AGIs $25k-50k, 151.5% for AGIs $50k-75k, 155.2% for AGIs $75k-100k, 414.7% for AGIs $100k-200k, 8422.8% for AGIs over 200k)
Profit/loss from business: +$19,509 (reported on 15.7% of returns)
Here:
+$19,509
State:
+$16,274
(% of AGI for various income ranges: 98.1% for AGIs below $25k, 210.7% for AGIs $25k-50k, 385.0% for AGIs $50k-75k, 394.1% for AGIs $75k-100k, 740.3% for AGIs $100k-200k, 3361.8% for AGIs over 200k)
Taxable individual retirement arrangement distribution: $21,187 (reported on 12.8% of returns)
18944:
$21,187
Pennsylvania:
$18,583
(% of AGI for various income ranges: 100.8% for AGIs below $25k, 168.7% for AGIs $25k-50k, 298.5% for AGIs $50k-75k, 506.0% for AGIs $75k-100k, 790.7% for AGIs $100k-200k, 2111.2% for AGIs over 200k)
Self-employed (Keogh) retirement plans: $18,275 (reported on 0.9% of returns)
18944:
$18,275
Pennsylvania:
$25,407
(% of AGI for various income ranges: 20.0% for AGIs $50k-75k, 44.2% for AGIs $100k-200k, 289.2% for AGIs over 200k)
Total itemized deductions: $30,894 (reported on 14.1% of returns)
Here:
$30,894
State:
$34,850
(% of AGI for various income ranges: 95.3% for AGIs below $25k, 180.8% for AGIs $25k-50k, 442.3% for AGIs $50k-75k, 650.6% for AGIs $75k-100k, 998.7% for AGIs $100k-200k, 5795.2% for AGIs over 200k)
Charity contributions: $8,777 (reported on 11.0% of returns)
Here:
$8,777
State:
$12,392
(% of AGI for various income ranges: 5.6% for AGIs below $25k, 18.7% for AGIs $25k-50k, 52.8% for AGIs $50k-75k, 89.7% for AGIs $75k-100k, 174.1% for AGIs $100k-200k, 1945.5% for AGIs over 200k)
Taxes paid: $8,604 (reported on 14.1% of returns)
18944:
$8,604
State:
$8,200
(% of AGI for various income ranges: 17.0% for AGIs below $25k, 48.3% for AGIs $25k-50k, 147.3% for AGIs $50k-75k, 224.4% for AGIs $75k-100k, 337.6% for AGIs $100k-200k, 1227.5% for AGIs over 200k)
Earned income credit: $1,893 (reported on 5.5% of returns)
Here:
$1,893
State:
$2,100
(% of AGI for various income ranges: 38.9% for AGIs below $25k, 37.1% for AGIs $25k-50k)
Percentage of individuals using paid preparers for their 2020 taxes: 92.2%
Here:
92%
State:
92%
(% for various income ranges: 89.9% for AGIs below $25k, 92.8% for AGIs $25k-50k, 92.2% for AGIs $50k-75k, 91.6% for AGIs $75k-100k, 94.2% for AGIs $100k-200k, 92.9% for AGIs over 200k)
Averages for the 2012 tax year for zip code 18944, filed in 2013:
Average Adjusted Gross Income (AGI) in 2012: $73,168 (Individual Income Tax Returns)
Here:
$73,168
State:
$61,346
Salary/wage: $65,217 (reported on 86.1% of returns)
Here:
$65,217
State:
$51,902
(% of AGI for various income ranges: 72.5% for AGIs below $25k, 77.5% for AGIs $25k-50k, 78.6% for AGIs $50k-75k, 80.4% for AGIs $75k-100k, 83.3% for AGIs $100k-200k, 64.5% for AGIs over 200k)
Taxable interest for individuals: $1,195 (reported on 46.3% of returns)
This zip code:
$1,195
Pennsylvania:
$1,588
(% of AGI for various income ranges: 2.0% for AGIs below $25k, 0.9% for AGIs $25k-50k, 0.7% for AGIs $50k-75k, 0.6% for AGIs $75k-100k, 0.5% for AGIs $100k-200k, 0.9% for AGIs over 200k)
Ordinary dividends: $5,036 (reported on 27.8% of returns)
Here:
$5,036
State:
$5,827
(% of AGI for various income ranges: 2.4% for AGIs below $25k, 1.3% for AGIs $25k-50k, 1.2% for AGIs $50k-75k, 1.1% for AGIs $75k-100k, 1.2% for AGIs $100k-200k, 4.1% for AGIs over 200k)
Net capital gain/loss in AGI: +$8,406 (reported on 20.3% of returns)
Here:
+$8,406
State:
+$14,495
(% of AGI for various income ranges: 0.1% for AGIs $25k-50k, 0.6% for AGIs $50k-75k, 0.3% for AGIs $75k-100k, 1.0% for AGIs $100k-200k, 7.6% for AGIs over 200k)
Profit/loss from business: +$17,045 (reported on 14.8% of returns)
Here:
+$17,045
State:
+$16,268
(% of AGI for various income ranges: 7.5% for AGIs below $25k, 6.0% for AGIs $25k-50k, 4.3% for AGIs $50k-75k, 3.3% for AGIs $75k-100k, 2.7% for AGIs $100k-200k, 2.6% for AGIs over 200k)
Taxable individual retirement arrangement distribution: $15,095 (reported on 12.5% of returns)
18944:
$15,095
Pennsylvania:
$14,550
(% of AGI for various income ranges: 6.0% for AGIs below $25k, 3.0% for AGIs $25k-50k, 2.9% for AGIs $50k-75k, 2.7% for AGIs $75k-100k, 2.4% for AGIs $100k-200k, 1.9% for AGIs over 200k)
Self-employment retirement plans: $14,067 (reported on 0.8% of returns)
18944:
$14,067
Pennsylvania:
$20,922
(% of AGI for various income ranges: 0.3% for AGIs $50k-75k, 0.1% for AGIs $100k-200k, 0.3% for AGIs over 200k)
Total itemized deductions: $24,725 (21% of AGI, reported on 48.6% of returns)
Here:
$24,725
State:
$23,538
Here:
21.0% of AGI
State:
18.4% of AGI
(% of AGI for various income ranges: 15.6% for AGIs below $25k, 15.3% for AGIs $25k-50k, 17.6% for AGIs $50k-75k, 18.4% for AGIs $75k-100k, 18.0% for AGIs $100k-200k, 12.9% for AGIs over 200k)
Charity contributions: $3,417 (reported on 41.2% of returns)
Here:
$3,417
State:
$4,025
(% of AGI for various income ranges: 1.0% for AGIs below $25k, 1.2% for AGIs $25k-50k, 1.5% for AGIs $50k-75k, 1.9% for AGIs $75k-100k, 1.9% for AGIs $100k-200k, 2.6% for AGIs over 200k)
Taxes paid: $10,783 (reported on 48.6% of returns)
18944:
$10,783
State:
$9,982
(% of AGI for various income ranges: 4.3% for AGIs below $25k, 5.2% for AGIs $25k-50k, 6.6% for AGIs $50k-75k, 7.8% for AGIs $75k-100k, 8.4% for AGIs $100k-200k, 6.5% for AGIs over 200k)
Earned income credit: $1,720 (reported on 7.7% of returns)
Here:
$1,720
State:
$2,106
(% of AGI for various income ranges: 2.9% for AGIs below $25k, 0.6% for AGIs $25k-50k)
Percentage of individuals using paid preparers for their 2012 taxes: 52.0%
Here:
52%
State:
53%
(% for various income ranges: 44.2% for AGIs below $25k, 51.2% for AGIs $25k-50k, 56.2% for AGIs $50k-75k, 55.6% for AGIs $75k-100k, 56.6% for AGIs $100k-200k, 67.9% for AGIs over 200k)
Averages for the 2004 tax year for zip code 18944, filed in 2005:
Average Adjusted Gross Income (AGI) in 2004: $59,799 (Individual Income Tax Returns)
Here:
$59,799
State:
$48,049
Salary/wage: $54,039 (reported on 87.5% of returns)
Here:
$54,039
State:
$42,646
(% of AGI for various income ranges: 161.1% for AGIs below $10k, 74.0% for AGIs $10k-25k, 82.3% for AGIs $25k-50k, 84.3% for AGIs $50k-75k, 87.2% for AGIs $75k-100k, 71.8% for AGIs over 100k)
Taxable interest for individuals: $1,313 (reported on 60.3% of returns)
This zip code:
$1,313
Pennsylvania:
$1,657
(% of AGI for various income ranges: 13.0% for AGIs below $10k, 4.0% for AGIs $10k-25k, 1.4% for AGIs $25k-50k, 1.1% for AGIs $50k-75k, 0.7% for AGIs $75k-100k, 1.2% for AGIs over 100k)
Taxable dividends: $2,597 (reported on 33.8% of returns)
Here:
$2,597
State:
$3,566
(% of AGI for various income ranges: 6.7% for AGIs below $10k, 2.3% for AGIs $10k-25k, 1.3% for AGIs $25k-50k, 0.9% for AGIs $50k-75k, 0.8% for AGIs $75k-100k, 1.8% for AGIs over 100k)
Net capital gain/loss: +$10,614 (reported on 23.9% of returns)
Here:
+$10,614
State:
+$9,716
(% of AGI for various income ranges: -1.6% for AGIs below $10k, 0.2% for AGIs $10k-25k, 0.3% for AGIs $25k-50k, 0.7% for AGIs $50k-75k, 1.0% for AGIs $75k-100k, 8.7% for AGIs over 100k)
Profit/loss from business: +$17,959 (reported on 15.3% of returns)
Here:
+$17,959
State:
+$14,267
(% of AGI for various income ranges: 4.5% for AGIs below $10k, 7.3% for AGIs $10k-25k, 6.1% for AGIs $25k-50k, 4.0% for AGIs $50k-75k, 3.1% for AGIs $75k-100k, 4.8% for AGIs over 100k)
IRA payment deduction: $3,166 (reported on 4.4% of returns)
18944:
$3,166
Pennsylvania:
$2,903
(% of AGI for various income ranges: 0.5% for AGIs below $10k, 0.4% for AGIs $10k-25k, 0.4% for AGIs $25k-50k, 0.3% for AGIs $50k-75k, 0.2% for AGIs $75k-100k, 0.1% for AGIs over 100k)
Self-employed pension: $11,275 (reported on 1.3% of returns)
Here:
$11,275
Pennsylvania:
$14,674
(% of AGI for various income ranges: 0.1% for AGIs $25k-50k, 0.2% for AGIs $50k-75k, 0.1% for AGIs $75k-100k, 0.4% for AGIs over 100k)
Total itemized deductions: $20,472 (22% of AGI, reported on 50.6% of returns)
Here:
$20,472
State:
$18,804
Here:
21.9% of AGI
State:
19.5% of AGI
(% of AGI for various income ranges: 19.8% for AGIs below $10k, 15.9% for AGIs $10k-25k, 16.1% for AGIs $25k-50k, 19.8% for AGIs $50k-75k, 19.9% for AGIs $75k-100k, 15.7% for AGIs over 100k)
Charity contributions deductions: $3,301 (3% of AGI, reported on 46.0% of returns)
Here:
$3,301
State:
$3,337
Here:
3.4% of AGI
State:
3.3% of AGI
(% of AGI for various income ranges: 1.7% for AGIs below $10k, 1.5% for AGIs $10k-25k, 1.5% for AGIs $25k-50k, 2.1% for AGIs $50k-75k, 2.5% for AGIs $75k-100k, 3.2% for AGIs over 100k)
Total tax: $9,003 (reported on 81.9% of returns)
18944:
$9,003
State:
$8,008
(% of AGI for various income ranges: 5.4% for AGIs below $10k, 5.3% for AGIs $10k-25k, 7.9% for AGIs $25k-50k, 8.3% for AGIs $50k-75k, 9.5% for AGIs $75k-100k, 17.2% for AGIs over 100k)
Earned income credit: $1,399 (reported on 5.5% of returns)
Here:
$1,399
State:
$1,643
Percentage of individuals using paid preparers for their 2004 taxes: 54.7%
Here:
55%
State:
56%
(% for various income ranges: 44.5% for AGIs below $10k, 51.6% for AGIs $10k-25k, 55.6% for AGIs $25k-50k, 59.6% for AGIs $50k-75k, 57.3% for AGIs $75k-100k, 60.8% for AGIs over 100k)
Likely homosexual households (counted as self-reported same-sex unmarried-partner households)
Lesbian couples: 0.0% of all households
Gay men: 0.0% of all households
Household received Food Stamps/SNAP in the past 12 months: 500 Household did not receive Food Stamps/SNAP in the past 12 months: 9,542
Women who had a birth in the past 12 months: 282 (277 now married, 20 unmarried) Women who did not have a birth in the past 12 months: 5,557 (2,629 now married, 2,913 unmarried)
Housing units in zip code 18944 with a mortgage: 5,752 (1,308 second mortgage, 143 home equity loan, 1,122 both second mortgage and home equity loan) Houses without a mortgage: 307
Median monthly owner costs for units with a mortgage: $2,172 Median monthly owner costs for units without a mortgage: $781
Residents with income below the poverty level in 2022:
This zip code:
3.3%
Whole state:
11.8%
Residents with income below 50% of the poverty level in 2022:
This zip code:
1.9%
Whole state:
6.1%
Median number of rooms in houses and condos:
Here:
7.3
State:
6.8
Median number of rooms in apartments:
Here:
4.4
State:
4.3
Notable locations in this zip code not listed on our city pages
Notable locations in zip code 18944: Cedar View Estates (A), Pennridge Industrial Park (B), Stonebridge (C), Nesbes Estates (D), Blueberry (E), Meadow Lane Homes (F), Clearview Estates (G), Long Acres (H), Show Place Estates (I), Hilltown Manor (J), Hilltown Farms (K), Hi View Acres (L), Orchard Station (M), Hilltown Township Volunteer Fire Company Station 61 (N), Perkasie Fire Company 1 Station 76 (O), Samuel Pierce Library (P), Perkasie Fire Company 1 Station 26 (Q). Display/hide their locations on the map
Churches in zip code 18944 include: Saint Luke Lutheran Church (A), Irish Meeting House (B), Deep Run Presbyterian Church (C), Peace Lutheran Church (D), Deep Run East Mennonite Church (E), Solomons United Church of Christ (F), Saint Andrews Church (G), Saint Matthews Evangelical Lutheran Church (H), Good Shepherd Episcopal Church (I). Display/hide their locations on the map
4,317 married couples with children.
696 single-parent households (221 men, 475 women).
95.6% of residents of 18944 zip code speak English at home.
1.7% of residents speak Spanish at home (58% very well, 15% well, 11% not well, 16% not at all).
1.8% of residents speak other Indo-European language at home (92% very well, 8% well).
0.1% of residents speak Asian or Pacific Island language at home (100% very well).
0.1% of residents speak other language at home (100% well).
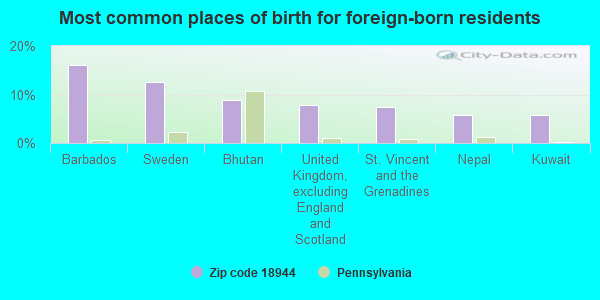
Foreign born population: 863 (3.1%) (75.7% of them are naturalized citizens)
This zip code:
3.1%
Whole state:
7.5%
16%Barbados
12%Sweden
9%Bhutan
8%United Kingdom, excluding England and Scotland
7%St. Vincent and the Grenadines
6%Nepal
6%Kuwait
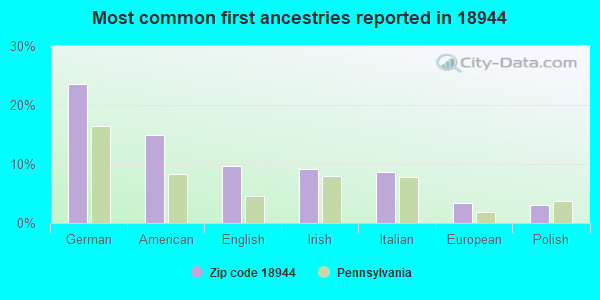
23%German
15%American
10%English
9%Irish
9%Italian
3%European
3%Polish
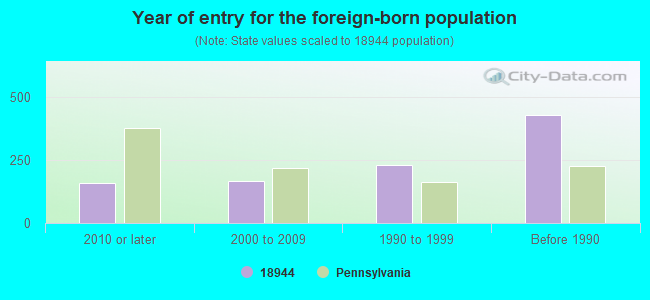
Year of entry for the foreign-born population
1592010 or later
1652000 to 2009
2311990 to 1999
427Before 1990
Facilities with environmental interests located in this zip code:
BIELLO AUTO PARTS PERKASIE FAC (1528 RIDGE ROAD in PERKASIE, PA)
STATE MASTER (Pennsylvania database) - PCS-PAR600001, National Pollutant Discharge Elimination System Permit National Pollutant Discharge Elimination System NON-MAJOR (Tracking pollutant discharge elimination systems) - permit Business SIC classification: MOTOR VEHICLE PARTS, USED Organizations: BIELLO AUTO PARTS, INC. (CONTACT/OWNER)
BO RIT CORP/PERKASIE (NO STREET ADDRESS in PERKASIE, PA)
AIR MINOR (AIRS/AFS) Business SIC classification: COMMERCIAL PHYSICAL AND BIOLOGICAL RESEARCH
Housing units lacking complete plumbing facilities: 1.2% Housing units lacking complete kitchen facilities: 1.4%
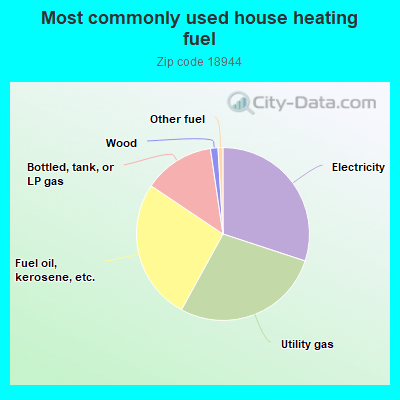
29.7%Electricity
27.6%Utility gas
26.1%Fuel oil, kerosene, etc.
13.1%Bottled, tank, or LP gas
1.4%Wood
0.9%Other fuel
Population in 1990: 18,235. Population change in the 1990s: +2,979 (+16.3%).
Place of birth for U.S.-born residents:
This state: 20,323
Northeast: 3,853
Midwest: 759
South: 1,013
West: 577
66% of the 18944 zip code residents lived in the same house 5 years ago. Out of people who lived in different houses, 62% lived in this county. Out of people who lived in different counties, 50% lived in Pennsylvania.
95% of the 18944 zip code residents lived in the same house 1 year ago. Out of people who lived in different houses, 63% moved from this county. Out of people who lived in different houses, 35% moved from different county within same state. Out of people who lived in different houses, 3% moved from different state. Out of people who lived in different houses, 2% moved from abroad.
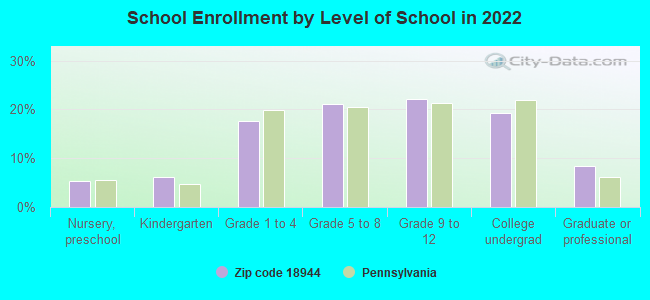
Private vs. public school enrollment:
Students in private schools in grades 1 to 8 (elementary and middle school): 238
Here:
9.4%
Pennsylvania:
15.7%
Students in private schools in grades 9 to 12 (high school): 103
Here:
7.1%
Pennsylvania:
13.4%
Students in private undergraduate colleges: 333
Here:
26.6%
Pennsylvania:
39.8%
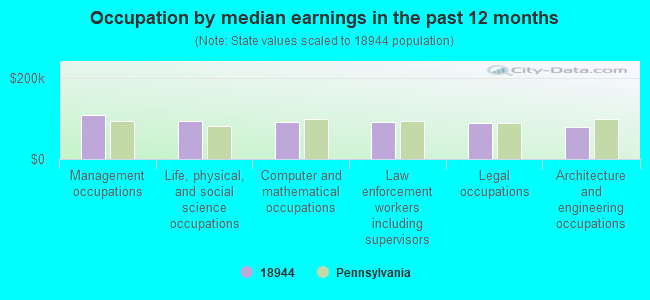
Occupation by median earnings in the past 12 months ($)
107,804Management occupations
94,172Life, physical, and social science occupations
92,795Computer and mathematical occupations
92,167Law enforcement workers including supervisors
89,580Legal occupations
80,044Architecture and engineering occupations
Companies with federal contracts located in this zip code (PERKASIE, PA):
AQUA ENTERPRISES (311 WYCKFORD DR; small business) : $3,109,658 in 113 contractsfrom 2000 to 2006
Contracts for Vehicular Brake, Steering, Axle, Wheel, and Track Components, Lubrication and Fuel Dispensing Equipment, Vehicular Power Transmission Components, Miscellaneous Vehicular Components, and moreby Army, Defense Logistics Agency Signed by year:2000: $27,941; 2001: $96,458; 2002: $41,193; 2003: $1,712,485; 2004: $599,666; 2005: $629,918; 2006: $1,997.
Biggest contracts:
$419,660 with Army for Vehicular Brake, Steering, Axle, Wheel, and Track Components. Signed on 2003-08-19. Completion date: 2003-11-30.
$223,049, same as above.Signed on 2005-04-04. Completion date: 2005-08-29.
$214,000 with Army for Lubrication and Fuel Dispensing Equipment. Signed on 2003-07-22. Completion date: 2003-08-29.
$157,839 with Army for Vehicular Power Transmission Components. Signed on 2003-07-29. Completion date: 2004-03-30.
PSG CONTROLS, INC. (1225 TUNNEL ROAD; small business) : $2,408,429 in 55 contractsfrom 2000 to 2006
Contracts for Pressure, Temperature, and Humidity Measuring and Controlling Instruments, Drugs and Biologicals, Hazard-Detecting Instruments and Apparatus, Switches, and moreby Defense Logistics Agency Signed by year:2000: $519,837; 2001: $263,644; 2002: $296,939; 2003: $36,709; 2004: $642,815; 2005: $527,817; 2006: $120,668.
Biggest contracts:
$200,734 with Defense Logistics Agency for Pressure, Temperature, and Humidity Measuring and Controlling Instruments. Signed on 2001-07-20. Completion date: 2001-09-08.
$123,280 with Defense Logistics Agency for Drugs and Biologicals. Taking place in CA. Signed on 2000-06-15. Completion date: 2000-08-13.
$123,280 with Defense Logistics Agency for Hazard-Detecting Instruments and Apparatus. Signed on 2000-06-14. Completion date: 2005-06-14.
$103,458 with Defense Logistics Agency for Drugs and Biologicals. Taking place in NC. Signed on 2000-08-10. Completion date: 2000-10-09.
LARAD INC (124 OLD BETHLEHEM ROAD; small business) : $2,087,332 in 527 contractsfrom 2000 to 2006
Contracts for Facilities Operations Support Services, Warehousing and Storage Services, Other Housekeeping Services, Maintenance, Repair and Rebuilding of Equipment -- Electrical and Electronic Equipment Components, and moreby Navy Signed by year:2000: $229,722; 2001: $235,106; 2002: $418,936; 2003: $771,379; 2004: $281,884; 2005: $130,305; 2006: $20,000.
Biggest contracts:
$256,680 with Navy for Facilities Operations Support Services. Signed on 2003-02-05. Completion date: 2008-02-29.
$255,863 with Navy for Warehousing and Storage Services. Signed on 2003-09-10. Completion date: 2008-09-09.
$222,354 with Navy for Facilities Operations Support Services. Signed on 2001-06-29. Completion date: 2001-06-30.
$221,048, same as above.Signed on 2000-06-29. Completion date: 2001-06-30.
FOX AVIATION SALES (275 BARNHILL RD; small business) : $1,165,830 in 49 contractsfrom 2001 to 2006
Contracts for Lubrication and Fuel Dispensing Equipment, Valves, Nonpowered, Hose, Pipe, Tube, Lubrication, and Railing Fittings, Miscellaneous Items, and moreby Defense Logistics Agency, Navy, Army Signed by year:2000: $0; 2001: $83,887; 2002: $197,999; 2003: $139,678; 2004: $207,901; 2005: $464,440; 2006: $71,925.
Biggest contracts:
$89,856 with Defense Logistics Agency for Lubrication and Fuel Dispensing Equipment. Signed on 2005-04-05. Completion date: 2005-08-03.
$88,154, same as above.Signed on 2004-09-15. Completion date: 2005-01-13.
$83,887 with Defense Logistics Agency for Valves, Nonpowered. Signed on 2001-08-06. Completion date: 2001-11-14.
$82,839 with Defense Logistics Agency for Lubrication and Fuel Dispensing Equipment. Signed on 2005-03-04. Completion date: 2005-07-22.
POLACHEK, JOHN (530 S PERKASIE RD; small business) : $254,887 in 19 contractsfrom 2002 to 2006
Contracts for Maintenance, Repair and Rebuilding of Equipment -- Electrical and Electronic Equipment Components, , Maintenance, Repair and Rebuilding of Equipment -- Instruments and Laboratory Equipment, Maintenance, Repair and Rebuilding of Equipment -- Miscellaneous, and moreby Army, National Institutes of Health Signed by year:2000: $0; 2001: $0; 2002: $20,000; 2003: $20,000; 2004: $75,800; 2005: $122,200; 2006: $16,887.
Biggest contracts:
$46,000 with Army for Maintenance, Repair and Rebuilding of Equipment -- Electrical and Electronic Equipment Components. Taking place in MD. Signed on 2004-09-28. Completion date: 2004-12-31.
$23,500 with National Institutes of Health for . Taking place in MD. Signed on 2005-04-15. Completion date: 2005-06-30.
$20,000 with Army for Maintenance, Repair and Rebuilding of Equipment -- Instruments and Laboratory Equipment. Taking place in MD. Signed on 2005-02-18. Completion date: 2005-12-31.
$20,000 with Army for Maintenance, Repair and Rebuilding of Equipment -- Electrical and Electronic Equipment Components. Taking place in MD. Signed on 2004-01-23. Completion date: 2004-12-31.
KEFCO INCORPORATED (206 N SIXTH STREET; small business) : $20,400 in 3 contractsfrom 2003 to 2005
$10,000 with Navy for Plastics Fabricated Materials. Taking place in CA. Signed on 2003-04-10. Completion date: 2003-05-30.
$5,400 with Army for Specialized Shipping and Storage Containers. Taking place in IA. Signed on 2005-02-04. Completion date: 2005-03-06.
$5,000, same as above.Signed on 2004-04-19. Completion date: 2004-05-19.
THERMO-SONICS INC (410 E WALNUT ST; small business)
$17,000 with U.S. Army Corps of Engineers - civil program financing only for Refrigeration Equipment. Signed on 2001-05-07. Completion date: 2001-09-27.
SORICE INC (306 N 5TH ST; small business)
$8,515 with Air Force for Cabinets, Lockers, Bins, and Shelving. Signed on 2004-08-18. Completion date: 2004-09-17.
SIGMA CONTROLS INC (217 S 5TH ST; small business)
$790 with Navy for Air Conditioning Equipment. Taking place in CA. Signed on 2004-04-14. Completion date: 2004-04-15.
Top industries in this zip code by the number of employees in 2005:
2003 - 2018 National Fire Incident Reporting System (NFIRS) incidents
Based on the data from the years 2003 - 2018 the average number of fire incidents per year is 49. The highest number of reported fire incidents - 95 took place in 2017, and the least - 20 in 2014. The data has a growing trend.
When looking into fire subcategories, the most incidents belonged to: Structure Fires (63.2%), and Outside Fires (24.0%).
Fire incident types reported to NFIRS in Zip Code 18944


 Nearest zip codes: 18917, 18962, 18923, 18960, 18932, 18914.


 Based on the data from the years 2003 - 2018 the average number of fire incidents per year is 49. The highest number of reported fire incidents - 95 took place in 2017, and the least - 20 in 2014. The data has a growing trend.
 When looking into fire subcategories, the most incidents belonged to: Structure Fires (63.2%), and Outside Fires (24.0%).