Estimated zip code population in 2022: 368 Zip code population in 2010: 515 Zip code population in 2000: 489
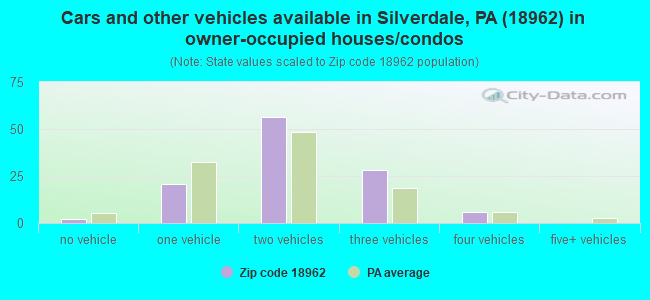
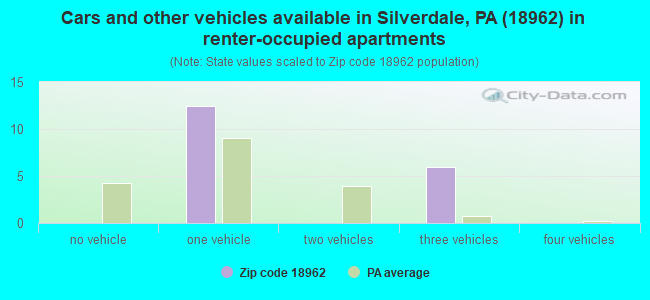
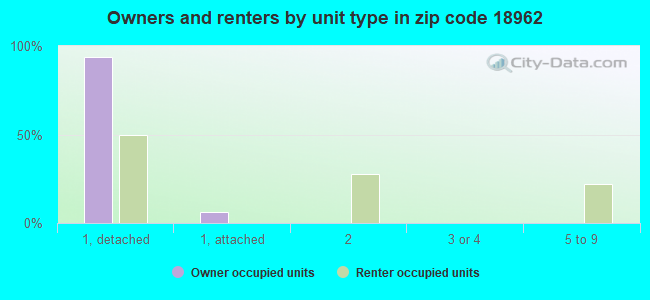
Houses and condos: 131 Renter-occupied apartments: 18
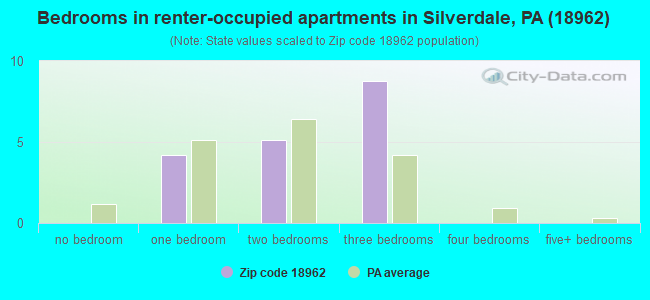
% of renters here:
14%
State:
31%
March 2022 cost of living index in zip code 18962: 103.6 (near average, U.S. average is 100)
Land area: 0.2 sq. mi. Water area: 0.0 sq. mi.
Population density: 1,545 people per square mile
(low).
OSM Map
General Map
Google Map
MSN Map
OSM Map
General Map
Google Map
MSN Map
OSM Map
General Map
Google Map
MSN Map
OSM Map
General Map
Google Map
MSN Map
Please wait while loading the map...
Real estate property taxes paid for housing units in 2022:
This zip code:
1.5% ($5,565)
Pennsylvania:
1.3% ($3,094)
Median real estate property taxes paid for housing units with mortgages in 2022: $5,624 (1.6%) Median real estate property taxes paid for housing units with no mortgage in 2022: $5,285 (1.3%)
Business Search- 14 Million verified businesses
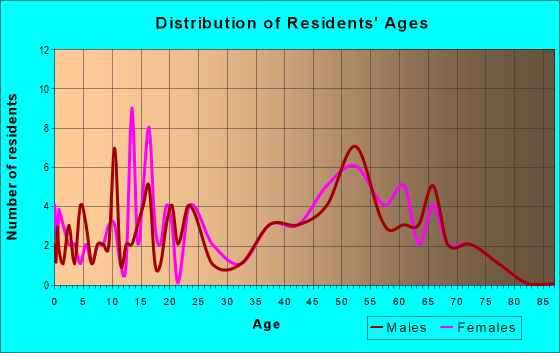
Males: 201
(54.7%)
Females: 166
(45.3%)
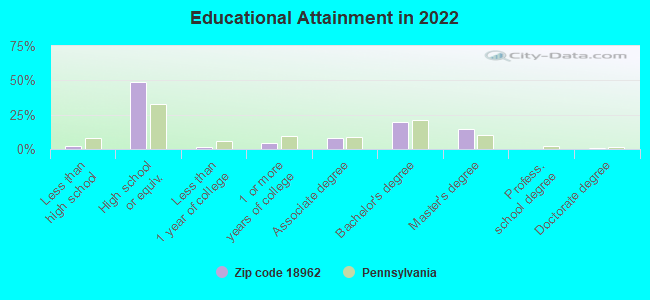
For population 25 years and over in 18962:
High school or higher: 97.8%
Bachelor's degree or higher: 34.7%
Graduate or professional degree: 14.7%
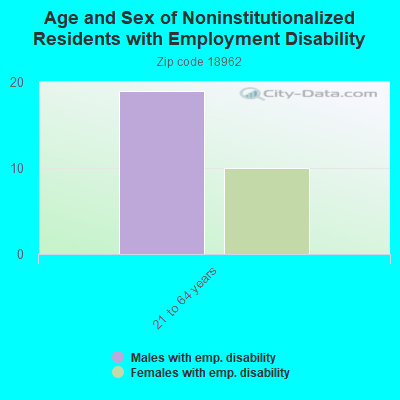
Unemployed: 3.4%
Mean travel time to work (commute): 22.8 minutes
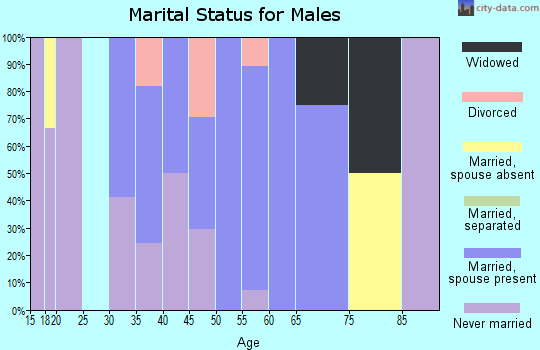
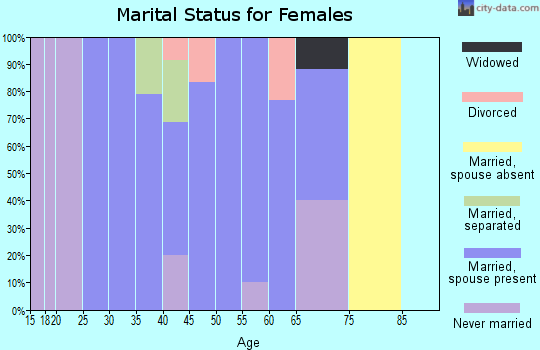
For population 15 years and over in 18962:
Never married: 19.1%
Now married: 55.8%
Separated: 0.0%
Widowed: 2.9%
Divorced: 22.1%
Zip code 18962 compared to state average:
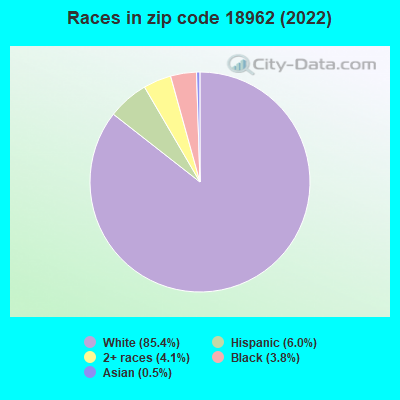
Black race population percentage below state average.
Foreign-born population percentage significantly below state average.
Renting percentage below state average.
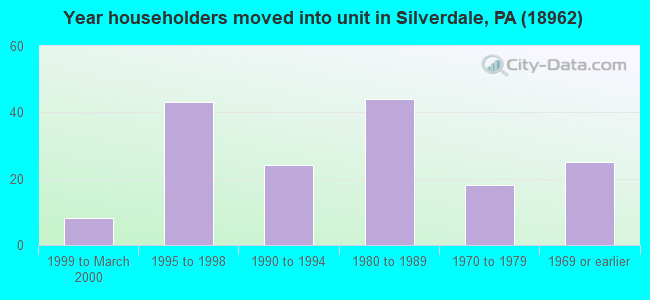
Length of stay since moving in significantly below state average.
Number of rooms per house above state average.
Number of college students significantly below state average.
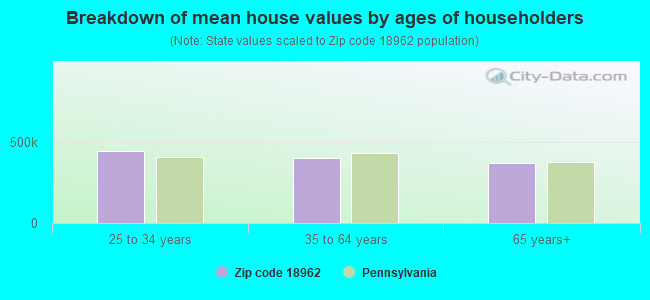
Estimated median house/condo value in 2022: $362,606
18962:
$362,606
Pennsylvania:
$245,500
According to our research of Pennsylvania and other state lists, there was 1 registered sex offender living in 18962 zip code as of April 26, 2024. The ratio of all residents to sex offenders in zip code 18962 is 559 to 1. The ratio of registered sex offenders to all residents in this zip code is near the state average.
Median resident age:
This zip code:
40.6 years
Pennsylvania median age:
40.9 years
Average household size:
This zip code:
2.8 people
Pennsylvania:
2.4 people
Averages for the 2004 tax year for zip code 18962, filed in 2005:
Average Adjusted Gross Income (AGI) in 2004: $48,749 (Individual Income Tax Returns)
Here:
$48,749
State:
$48,049
Salary/wage: $47,425 (reported on 88.9% of returns)
Here:
$47,425
State:
$42,646
(% of AGI for various income ranges: 77.8% for AGIs below $10k, 74.8% for AGIs $10k-25k, 85.4% for AGIs $25k-50k, 88.9% for AGIs $50k-75k, 90.0% for AGIs $75k-100k, 85.7% for AGIs over 100k)
Taxable interest for individuals: $809 (reported on 59.6% of returns)
This zip code:
$809
Pennsylvania:
$1,657
(% of AGI for various income ranges: 8.4% for AGIs below $10k, 5.1% for AGIs $10k-25k, 0.3% for AGIs $25k-50k, 0.4% for AGIs $50k-75k, 0.5% for AGIs $75k-100k, 1.0% for AGIs over 100k)
Taxable dividends: $986 (reported on 23.1% of returns)
Here:
$986
State:
$3,566
(% of AGI for various income ranges: 3.1% for AGIs below $10k, 0.2% for AGIs $25k-50k, 0.4% for AGIs $50k-75k, 1.0% for AGIs over 100k)
Net capital gain/loss: +$271 (reported on 15.6% of returns)
Here:
+$271
State:
+$9,716
(% of AGI for various income ranges: -0.1% for AGIs $10k-25k, -0.1% for AGIs $50k-75k, 0.3% for AGIs over 100k)
Profit/loss from business: +$5,200 (reported on 9.8% of returns)
Here:
+$5,200
State:
+$14,267
Total itemized deductions: $16,961 (21% of AGI, reported on 41.7% of returns)
Here:
$16,961
State:
$18,804
Here:
21.5% of AGI
State:
19.5% of AGI
(% of AGI for various income ranges: 14.9% for AGIs $10k-25k, 11.5% for AGIs $25k-50k, 14.1% for AGIs $50k-75k, 16.6% for AGIs $75k-100k, 15.9% for AGIs over 100k)
Charity contributions deductions: $2,350 (3% of AGI, reported on 40.1% of returns)
Here:
$2,350
State:
$3,337
Here:
3.0% of AGI
State:
3.3% of AGI
(% of AGI for various income ranges: 2.7% for AGIs $10k-25k, 0.9% for AGIs $25k-50k, 1.2% for AGIs $50k-75k, 3.0% for AGIs $75k-100k, 2.4% for AGIs over 100k)
Total tax: $6,044 (reported on 81.4% of returns)
18962:
$6,044
State:
$8,008
(% of AGI for various income ranges: 1.8% for AGIs below $10k, 6.0% for AGIs $10k-25k, 7.3% for AGIs $25k-50k, 8.1% for AGIs $50k-75k, 10.9% for AGIs $75k-100k, 14.0% for AGIs over 100k)
Earned income credit: $1,000 (reported on 4.9% of returns)
Here:
$1,000
State:
$1,643
Percentage of individuals using paid preparers for their 2004 taxes: 53.1%
Here:
53%
State:
56%
(% for various income ranges: 43.6% for AGIs below $10k, 42.6% for AGIs $10k-25k, 58.6% for AGIs $25k-50k, 56.7% for AGIs $50k-75k, 60.6% for AGIs $75k-100k, 60.0% for AGIs over 100k)
Household received Food Stamps/SNAP in the past 12 months: 36 Household did not receive Food Stamps/SNAP in the past 12 months: 96
Women who did not have a birth in the past 12 months: 64 (20 now married, 44 unmarried)
Housing units in zip code 18962 with a mortgage: 88 (11 second mortgage, 7 home equity loan, 4 both second mortgage and home equity loan) Median monthly owner costs for units with a mortgage: $1,889 Median monthly owner costs for units without a mortgage: $906
Residents with income below the poverty level in 2022:
This zip code:
1.4%
Whole state:
11.8%
Residents with income below 50% of the poverty level in 2022:
This zip code:
0.3%
Whole state:
6.1%
Median number of rooms in houses and condos:
Here:
7.6
State:
6.8
Median number of rooms in apartments:
Here:
5.0
State:
4.3
Notable locations in this zip code not listed on our city pages
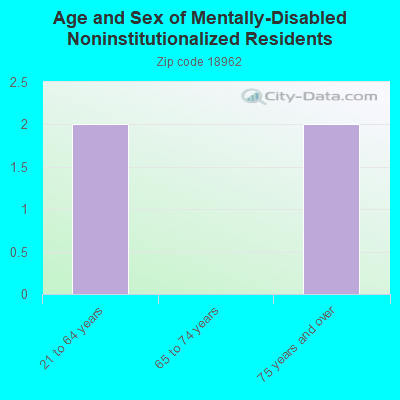
In group quarters: 3 (-1 institutionalized population)
Size of family households: 30 2-persons, 17 3-persons, 15 4-persons, 34 5-persons, 2 7-or-more-persons
Size of nonfamily households: 25 1-person, 5 2-persons
40 married couples with children.
14 single-parent households (1 men, 13 women).
97.1% of residents of 18962 zip code speak English at home.
2.0% of residents speak Spanish at home (100% very well).
Foreign born population: 0 (0.0%)
:
0.0%
Whole state:
7.5%
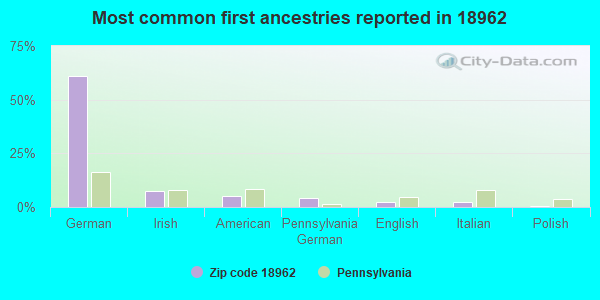
61%German
7%Irish
5%American
4%Pennsylvania German
2%English
2%Italian
0%Polish
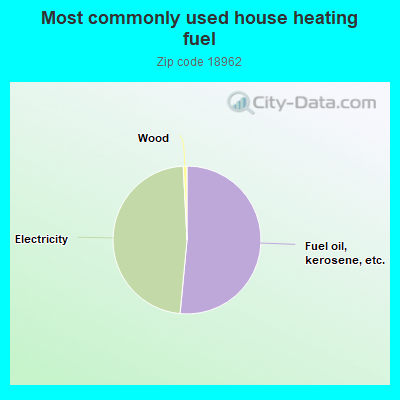
51.7%Fuel oil, kerosene, etc.
47.9%Electricity
0.8%Wood
Place of birth for U.S.-born residents:
This state: 263
Northeast: 33
Midwest: 41
South: 27
West: 2
78% of the 18962 zip code residents lived in the same house 5 years ago. Out of people who lived in different houses, 53% lived in this county. Out of people who lived in different counties, 50% lived in Pennsylvania.
97% of the 18962 zip code residents lived in the same house 1 year ago. Out of people who lived in different houses, 100% moved from this county.
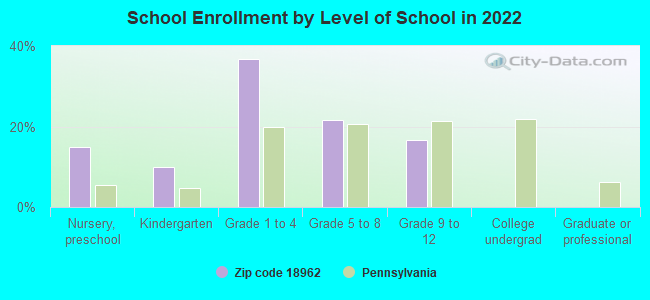
Private vs. public school enrollment:
Students in private schools in grades 1 to 8 (elementary and middle school):
Here:
0.0%
Pennsylvania:
15.7%
Students in private schools in grades 9 to 12 (high school):
Here:
0.0%
Pennsylvania:
13.4%
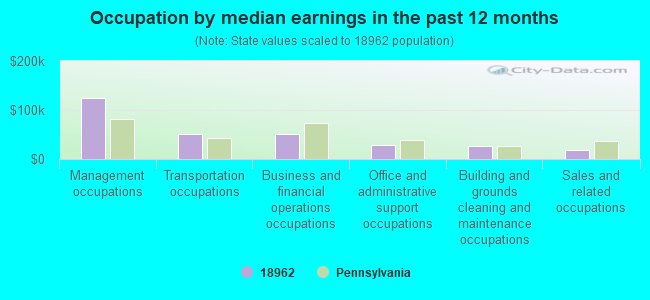
Occupation by median earnings in the past 12 months ($)
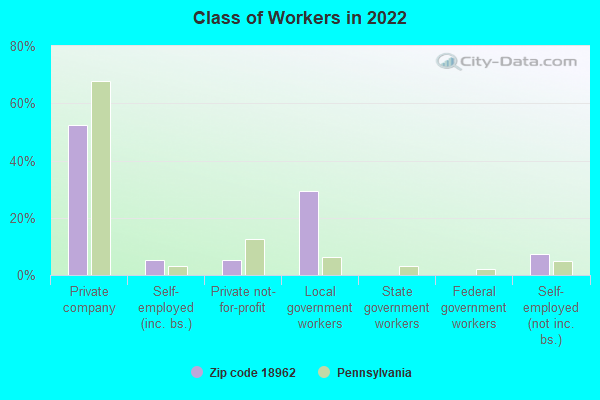
124,761Management occupations
50,757Transportation occupations
50,101Business and financial operations occupations
28,815Office and administrative support occupations
25,612Building and grounds cleaning and maintenance occupations
19,260Sales and related occupations
Top industries in this zip code by the number of employees in 2005:
Health Care and Social Assistance: Offices of Dentists (10-19 employees: 1 establishment)
Health Care and Social Assistance: Residential Mental Retardation Facilities (5-9: 1, 1-4: 1)
Other Services (except Public Administration): Beauty Salons (5-9: 1, 1-4: 1)
Construction: Painting and Wall Covering Contractors (5-9: 1, 1-4: 1)
Construction: Poured Concrete Foundation and Structure Contractors (5-9: 1)
Wholesale Trade: Industrial Machinery and Equipment Merchant Wholesalers (5-9: 1)
People in group quarters in 2010:
7 people in group homes intended for adults
People in group quarters in 2000:
7 people in homes for the mentally retarded
Home Mortgage Disclosure Act Aggregated Statistics For Year 2009 (Based on 2 partial tracts)
A) FHA, FSA/RHS & VA Home Purchase Loans
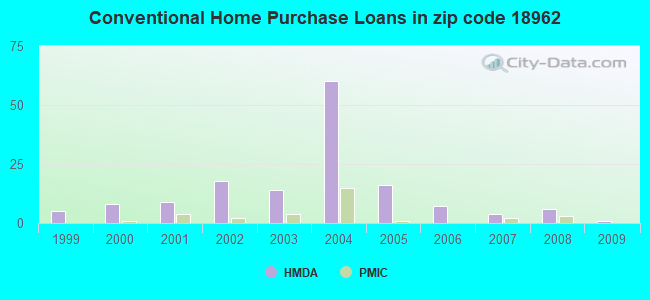
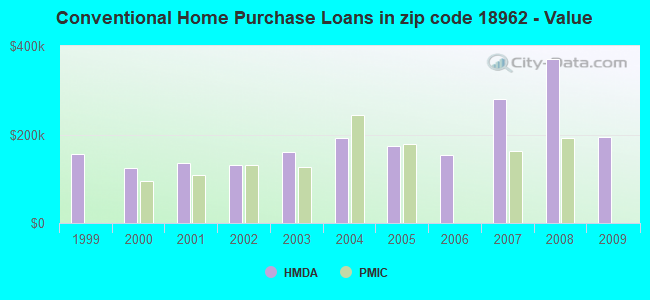
B) Conventional Home Purchase Loans
C) Refinancings
D) Home Improvement Loans
F) Non-occupant Loans on < 5 Family Dwellings (A B C & D)
Number
Average Value
Number
Average Value
Number
Average Value
Number
Average Value
Number
Average Value
LOANS ORIGINATED
2
$209,345
1
$194,780
25
$194,674
5
$37,864
2
$69,175
APPLICATIONS APPROVED, NOT ACCEPTED
1
$215,720
0
$0
2
$167,475
0
$0
1
$116,510
APPLICATIONS DENIED
0
$0
1
$303,100
5
$266,142
2
$70,540
0
$0
APPLICATIONS WITHDRAWN
1
$89,200
0
$0
6
$192,355
0
$0
1
$137,440
FILES CLOSED FOR INCOMPLETENESS
0
$0
0
$0
0
$0
0
$0
0
$0
Aggregated Statistics For Year 2008 (Based on 2 partial tracts)
A) FHA, FSA/RHS & VA Home Purchase Loans
B) Conventional Home Purchase Loans
C) Refinancings
D) Home Improvement Loans
F) Non-occupant Loans on < 5 Family Dwellings (A B C & D)
Number
Average Value
Number
Average Value
Number
Average Value
Number
Average Value
Number
Average Value
LOANS ORIGINATED
3
$235,440
6
$369,997
16
$179,935
6
$76,153
2
$537,930
APPLICATIONS APPROVED, NOT ACCEPTED
0
$0
0
$0
2
$157,010
1
$4,550
0
$0
APPLICATIONS DENIED
0
$0
0
$0
5
$260,136
0
$0
0
$0
APPLICATIONS WITHDRAWN
0
$0
0
$0
1
$268,510
0
$0
0
$0
FILES CLOSED FOR INCOMPLETENESS
0
$0
0
$0
1
$281,250
0
$0
0
$0
Aggregated Statistics For Year 2007 (Based on 2 partial tracts)
A) FHA, FSA/RHS & VA Home Purchase Loans
B) Conventional Home Purchase Loans
C) Refinancings
D) Home Improvement Loans
F) Non-occupant Loans on < 5 Family Dwellings (A B C & D)
G) Loans On Manufactured Home Dwelling (A B C & D)
Number
Average Value
Number
Average Value
Number
Average Value
Number
Average Value
Number
Average Value
Number
Average Value
LOANS ORIGINATED
2
$280,795
4
$279,888
18
$157,566
5
$35,862
0
$0
0
$0
APPLICATIONS APPROVED, NOT ACCEPTED
0
$0
0
$0
1
$32,770
5
$54,066
1
$32,770
0
$0
APPLICATIONS DENIED
0
$0
1
$45,510
5
$281,980
2
$11,375
0
$0
1
$45,510
APPLICATIONS WITHDRAWN
0
$0
0
$0
3
$166,567
0
$0
0
$0
0
$0
FILES CLOSED FOR INCOMPLETENESS
0
$0
0
$0
1
$153,820
0
$0
0
$0
0
$0
Aggregated Statistics For Year 2006 (Based on 2 partial tracts)
B) Conventional Home Purchase Loans
C) Refinancings
D) Home Improvement Loans
F) Non-occupant Loans on < 5 Family Dwellings (A B C & D)
Number
Average Value
Number
Average Value
Number
Average Value
Number
Average Value
LOANS ORIGINATED
7
$154,214
12
$141,536
5
$30,218
2
$183,860
APPLICATIONS APPROVED, NOT ACCEPTED
2
$212,530
1
$253,040
2
$25,030
0
$0
APPLICATIONS DENIED
2
$91,930
6
$168,235
4
$25,940
0
$0
APPLICATIONS WITHDRAWN
0
$0
9
$186,793
0
$0
0
$0
FILES CLOSED FOR INCOMPLETENESS
0
$0
2
$210,255
1
$50,060
0
$0
Aggregated Statistics For Year 2005 (Based on 2 partial tracts)
A) FHA, FSA/RHS & VA Home Purchase Loans
B) Conventional Home Purchase Loans
C) Refinancings
D) Home Improvement Loans
F) Non-occupant Loans on < 5 Family Dwellings (A B C & D)
Number
Average Value
Number
Average Value
Number
Average Value
Number
Average Value
Number
Average Value
LOANS ORIGINATED
2
$164,745
16
$172,995
30
$182,374
15
$46,966
4
$299,000
APPLICATIONS APPROVED, NOT ACCEPTED
0
$0
0
$0
2
$126,065
4
$64,397
0
$0
APPLICATIONS DENIED
0
$0
1
$131,980
12
$180,067
2
$110,590
1
$240,290
APPLICATIONS WITHDRAWN
0
$0
2
$138,350
10
$159,558
2
$16,385
0
$0
FILES CLOSED FOR INCOMPLETENESS
0
$0
0
$0
1
$313,110
0
$0
0
$0
Aggregated Statistics For Year 2004 (Based on 2 partial tracts)
A) FHA, FSA/RHS & VA Home Purchase Loans
B) Conventional Home Purchase Loans
C) Refinancings
D) Home Improvement Loans
F) Non-occupant Loans on < 5 Family Dwellings (A B C & D)
Number
Average Value
Number
Average Value
Number
Average Value
Number
Average Value
Number
Average Value
LOANS ORIGINATED
2
$157,010
60
$191,172
35
$151,899
9
$52,083
9
$167,982
APPLICATIONS APPROVED, NOT ACCEPTED
0
$0
6
$232,708
8
$141,422
0
$0
3
$182,950
APPLICATIONS DENIED
1
$126,520
4
$113,320
17
$159,821
4
$37,545
1
$22,750
APPLICATIONS WITHDRAWN
0
$0
7
$198,033
17
$199,976
1
$9,100
1
$218,450
FILES CLOSED FOR INCOMPLETENESS
0
$0
1
$172,940
3
$178,097
1
$27,310
1
$245,750
Aggregated Statistics For Year 2003 (Based on 2 partial tracts)
A) FHA, FSA/RHS & VA Home Purchase Loans
B) Conventional Home Purchase Loans
C) Refinancings
D) Home Improvement Loans
F) Non-occupant Loans on < 5 Family Dwellings (A B C & D)
Number
Average Value
Number
Average Value
Number
Average Value
Number
Average Value
Number
Average Value
LOANS ORIGINATED
3
$95,570
14
$160,260
59
$138,813
15
$50,789
2
$146,995
APPLICATIONS APPROVED, NOT ACCEPTED
0
$0
0
$0
8
$145,860
4
$40,050
0
$0
APPLICATIONS DENIED
0
$0
1
$18,200
12
$112,713
4
$15,245
1
$18,200
APPLICATIONS WITHDRAWN
0
$0
0
$0
12
$129,476
2
$18,205
0
$0
FILES CLOSED FOR INCOMPLETENESS
0
$0
0
$0
1
$120,150
0
$0
0
$0
Aggregated Statistics For Year 2002 (Based on 2 partial tracts)
A) FHA, FSA/RHS & VA Home Purchase Loans
B) Conventional Home Purchase Loans
C) Refinancings
D) Home Improvement Loans
F) Non-occupant Loans on < 5 Family Dwellings (A B C & D)
Number
Average Value
Number
Average Value
Number
Average Value
Number
Average Value
Number
Average Value
LOANS ORIGINATED
2
$95,115
18
$131,574
28
$125,315
10
$27,579
3
$112,560
APPLICATIONS APPROVED, NOT ACCEPTED
0
$0
1
$268,510
3
$122,877
2
$12,290
0
$0
APPLICATIONS DENIED
0
$0
0
$0
11
$152,086
2
$47,785
0
$0
APPLICATIONS WITHDRAWN
0
$0
0
$0
15
$145,511
0
$0
2
$88,745
FILES CLOSED FOR INCOMPLETENESS
0
$0
0
$0
1
$147,450
0
$0
0
$0
Aggregated Statistics For Year 2001 (Based on 2 partial tracts)
A) FHA, FSA/RHS & VA Home Purchase Loans
B) Conventional Home Purchase Loans
C) Refinancings
D) Home Improvement Loans
Number
Average Value
Number
Average Value
Number
Average Value
Number
Average Value
LOANS ORIGINATED
2
$130,160
9
$136,227
22
$97,805
10
$19,296
APPLICATIONS APPROVED, NOT ACCEPTED
0
$0
2
$76,455
4
$78,505
0
$0
APPLICATIONS DENIED
0
$0
2
$57,800
5
$70,814
4
$44,372
APPLICATIONS WITHDRAWN
1
$136,530
2
$102,855
5
$125,972
2
$25,485
FILES CLOSED FOR INCOMPLETENESS
0
$0
0
$0
2
$98,755
1
$127,430
Aggregated Statistics For Year 2000 (Based on 2 partial tracts)
A) FHA, FSA/RHS & VA Home Purchase Loans
B) Conventional Home Purchase Loans
C) Refinancings
D) Home Improvement Loans
F) Non-occupant Loans on < 5 Family Dwellings (A B C & D)
Number
Average Value
Number
Average Value
Number
Average Value
Number
Average Value
Number
Average Value
LOANS ORIGINATED
2
$124,695
8
$125,152
3
$87,683
6
$26,395
0
$0
APPLICATIONS APPROVED, NOT ACCEPTED
0
$0
0
$0
0
$0
2
$15,020
0
$0
APPLICATIONS DENIED
0
$0
0
$0
4
$47,330
2
$22,755
0
$0
APPLICATIONS WITHDRAWN
0
$0
1
$106,490
6
$102,245
0
$0
1
$106,490
FILES CLOSED FOR INCOMPLETENESS
0
$0
1
$104,670
2
$79,645
0
$0
0
$0
Aggregated Statistics For Year 1999 (Based on 1 partial tract)
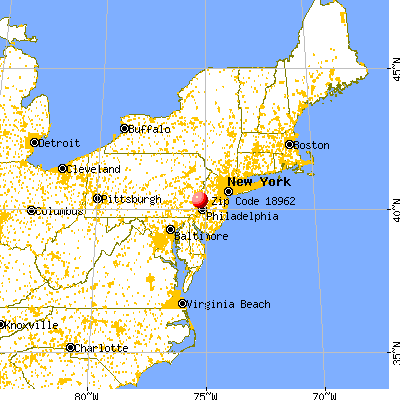


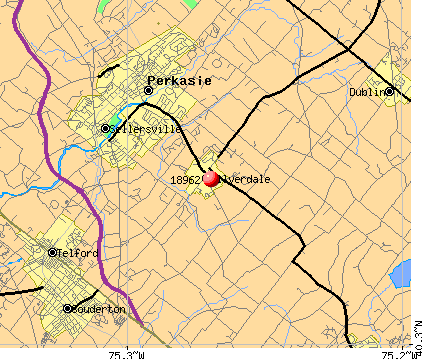 Nearest zip codes: 18932, 18944, 18960, 19440, 18917, 18915.