Estimated zip code population in 2022: 20,920 Zip code population in 2010: 18,099 Zip code population in 2000: 13,740
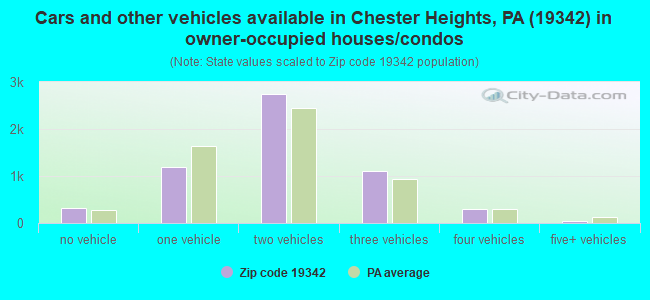
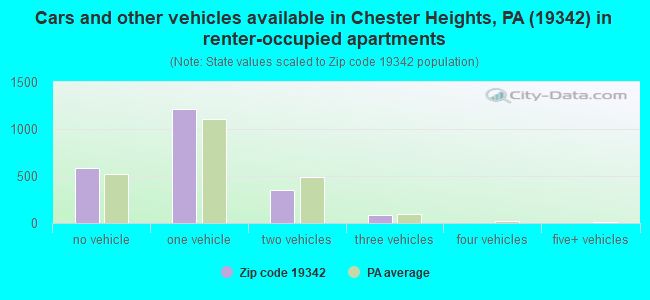
Houses and condos: 8,378 Renter-occupied apartments: 2,244
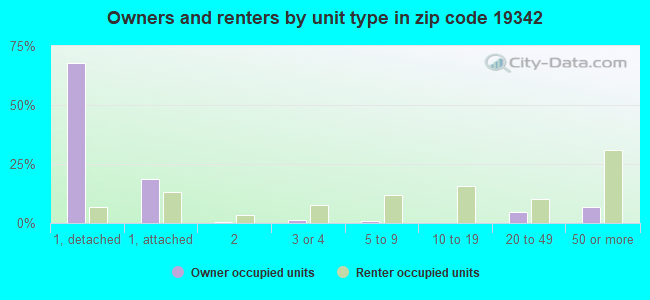
% of renters here:
28%
State:
31%
March 2022 cost of living index in zip code 19342: 108.5 (more than average, U.S. average is 100)
Land area: 19.5 sq. mi. Water area: 0.0 sq. mi.
Population density: 1,073 people per square mile
(low).
OSM Map
General Map
Google Map
MSN Map
OSM Map
General Map
Google Map
MSN Map
OSM Map
General Map
Google Map
MSN Map
OSM Map
General Map
Google Map
MSN Map
Please wait while loading the map...
Real estate property taxes paid for housing units in 2022:
This zip code:
1.3% ($7,812)
Pennsylvania:
1.3% ($3,094)
Median real estate property taxes paid for housing units with mortgages in 2022: $8,126 (1.2%) Median real estate property taxes paid for housing units with no mortgage in 2022: $7,053 (1.5%)
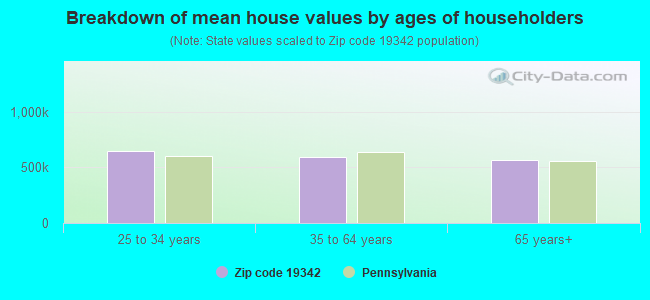
Estimated median house/condo value in 2022: $603,765
19342:
$603,765
Pennsylvania:
$245,500
According to our research of Pennsylvania and other state lists, there were 8 registered sex offenders living in 19342 zip code as of April 27, 2024. The ratio of all residents to sex offenders in zip code 19342 is 2,398 to 1. The ratio of registered sex offenders to all residents in this zip code is much lower than the state average.
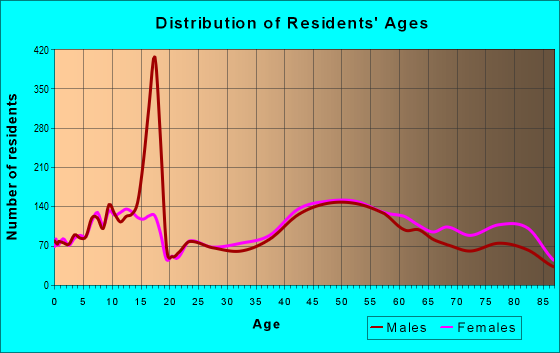
Median resident age:
This zip code:
46.3 years
Pennsylvania median age:
40.9 years
Average household size:
This zip code:
2.4 people
Pennsylvania:
2.4 people
Averages for the 2020 tax year for zip code 19342, filed in 2021:
Average Adjusted Gross Income (AGI) in 2020: $135,384 (Individual Income Tax Returns)
Here:
$135,384
State:
$75,707
Salary/wage: $119,326 (reported on 69.2% of returns)
Here:
$119,326
State:
$62,806
(% of AGI for various income ranges: 977.6% for AGIs below $25k, 2876.9% for AGIs $25k-50k, 5385.9% for AGIs $50k-75k, 7767.8% for AGIs $75k-100k, 17604.7% for AGIs $100k-200k, 88176.4% for AGIs over 200k)
Taxable interest for individuals: $2,243 (reported on 56.4% of returns)
This zip code:
$2,243
Pennsylvania:
$1,633
(% of AGI for various income ranges: 53.6% for AGIs below $25k, 89.0% for AGIs $25k-50k, 155.8% for AGIs $50k-75k, 207.9% for AGIs $75k-100k, 281.0% for AGIs $100k-200k, 990.2% for AGIs over 200k)
Ordinary dividends: $8,349 (reported on 48.8% of returns)
Here:
$8,349
State:
$7,382
(% of AGI for various income ranges: 120.1% for AGIs below $25k, 250.3% for AGIs $25k-50k, 393.5% for AGIs $50k-75k, 546.0% for AGIs $75k-100k, 897.0% for AGIs $100k-200k, 3634.7% for AGIs over 200k)
Net capital gain/loss in AGI: +$29,585 (reported on 42.4% of returns)
Here:
+$29,585
State:
+$23,522
(% of AGI for various income ranges: 31.7% for AGIs below $25k, 116.6% for AGIs $25k-50k, 230.0% for AGIs $50k-75k, 436.4% for AGIs $75k-100k, 1039.3% for AGIs $100k-200k, 18958.6% for AGIs over 200k)
Profit/loss from business: +$34,274 (reported on 14.6% of returns)
Here:
+$34,274
State:
+$16,274
(% of AGI for various income ranges: 133.6% for AGIs below $25k, 152.9% for AGIs $25k-50k, 368.0% for AGIs $50k-75k, 471.2% for AGIs $75k-100k, 962.6% for AGIs $100k-200k, 5389.0% for AGIs over 200k)
Taxable individual retirement arrangement distribution: $26,671 (reported on 21.4% of returns)
19342:
$26,671
Pennsylvania:
$18,583
(% of AGI for various income ranges: 143.1% for AGIs below $25k, 425.9% for AGIs $25k-50k, 681.3% for AGIs $50k-75k, 1163.1% for AGIs $75k-100k, 1819.3% for AGIs $100k-200k, 3327.9% for AGIs over 200k)
Self-employed (Keogh) retirement plans: $27,415 (reported on 2.0% of returns)
19342:
$27,415
Pennsylvania:
$25,407
(% of AGI for various income ranges: 92.8% for AGIs $100k-200k, 759.8% for AGIs over 200k)
Total itemized deductions: $35,540 (reported on 19.4% of returns)
Here:
$35,540
State:
$34,850
(% of AGI for various income ranges: 138.4% for AGIs below $25k, 394.1% for AGIs $25k-50k, 673.8% for AGIs $50k-75k, 914.5% for AGIs $75k-100k, 1500.3% for AGIs $100k-200k, 6392.6% for AGIs over 200k)
Charity contributions: $7,814 (reported on 17.0% of returns)
Here:
$7,814
State:
$12,392
(% of AGI for various income ranges: 7.4% for AGIs below $25k, 28.5% for AGIs $25k-50k, 68.1% for AGIs $50k-75k, 118.1% for AGIs $75k-100k, 215.9% for AGIs $100k-200k, 1627.9% for AGIs over 200k)
Taxes paid: $8,683 (reported on 19.3% of returns)
19342:
$8,683
State:
$8,200
(% of AGI for various income ranges: 30.7% for AGIs below $25k, 81.2% for AGIs $25k-50k, 150.1% for AGIs $50k-75k, 232.6% for AGIs $75k-100k, 446.0% for AGIs $100k-200k, 1428.8% for AGIs over 200k)
Earned income credit: $1,529 (reported on 3.3% of returns)
Here:
$1,529
State:
$2,100
(% of AGI for various income ranges: 26.4% for AGIs below $25k, 22.0% for AGIs $25k-50k)
Percentage of individuals using paid preparers for their 2020 taxes: 90.5%
Here:
90%
State:
92%
(% for various income ranges: 86.9% for AGIs below $25k, 90.7% for AGIs $25k-50k, 90.8% for AGIs $50k-75k, 91.3% for AGIs $75k-100k, 91.0% for AGIs $100k-200k, 93.2% for AGIs over 200k)
Averages for the 2012 tax year for zip code 19342, filed in 2013:
Average Adjusted Gross Income (AGI) in 2012: $107,879 (Individual Income Tax Returns)
Here:
$107,879
State:
$61,346
Salary/wage: $98,024 (reported on 71.9% of returns)
Here:
$98,024
State:
$51,902
(% of AGI for various income ranges: 55.8% for AGIs below $25k, 54.9% for AGIs $25k-50k, 51.5% for AGIs $50k-75k, 53.3% for AGIs $75k-100k, 68.6% for AGIs $100k-200k, 69.4% for AGIs over 200k)
Taxable interest for individuals: $1,870 (reported on 60.6% of returns)
This zip code:
$1,870
Pennsylvania:
$1,588
(% of AGI for various income ranges: 3.9% for AGIs below $25k, 2.1% for AGIs $25k-50k, 1.9% for AGIs $50k-75k, 1.5% for AGIs $75k-100k, 1.0% for AGIs $100k-200k, 0.6% for AGIs over 200k)
Ordinary dividends: $6,486 (reported on 48.7% of returns)
Here:
$6,486
State:
$5,827
(% of AGI for various income ranges: 7.2% for AGIs below $25k, 4.0% for AGIs $25k-50k, 4.2% for AGIs $50k-75k, 4.2% for AGIs $75k-100k, 2.7% for AGIs $100k-200k, 2.3% for AGIs over 200k)
Net capital gain/loss in AGI: +$9,188 (reported on 39.1% of returns)
Here:
+$9,188
State:
+$14,495
(% of AGI for various income ranges: 0.4% for AGIs $25k-50k, 0.8% for AGIs $50k-75k, 1.3% for AGIs $75k-100k, 1.5% for AGIs $100k-200k, 5.7% for AGIs over 200k)
Profit/loss from business: +$27,729 (reported on 15.0% of returns)
Here:
+$27,729
State:
+$16,268
(% of AGI for various income ranges: 5.9% for AGIs below $25k, 4.7% for AGIs $25k-50k, 3.5% for AGIs $50k-75k, 4.1% for AGIs $75k-100k, 3.8% for AGIs $100k-200k, 3.7% for AGIs over 200k)
Taxable individual retirement arrangement distribution: $19,384 (reported on 23.8% of returns)
19342:
$19,384
Pennsylvania:
$14,550
(% of AGI for various income ranges: 8.6% for AGIs below $25k, 7.4% for AGIs $25k-50k, 8.3% for AGIs $50k-75k, 7.8% for AGIs $75k-100k, 5.4% for AGIs $100k-200k, 1.8% for AGIs over 200k)
Self-employment retirement plans: $22,425 (reported on 1.8% of returns)
19342:
$22,425
Pennsylvania:
$20,922
(% of AGI for various income ranges: 0.3% for AGIs $50k-75k, 0.3% for AGIs $100k-200k, 0.5% for AGIs over 200k)
Total itemized deductions: $30,108 (18% of AGI, reported on 53.1% of returns)
Here:
$30,108
State:
$23,538
Here:
17.7% of AGI
State:
18.4% of AGI
(% of AGI for various income ranges: 21.8% for AGIs below $25k, 16.2% for AGIs $25k-50k, 16.3% for AGIs $50k-75k, 17.2% for AGIs $75k-100k, 17.0% for AGIs $100k-200k, 12.3% for AGIs over 200k)
Charity contributions: $3,994 (reported on 48.0% of returns)
Here:
$3,994
State:
$4,025
(% of AGI for various income ranges: 1.3% for AGIs below $25k, 1.3% for AGIs $25k-50k, 2.0% for AGIs $50k-75k, 2.1% for AGIs $75k-100k, 1.9% for AGIs $100k-200k, 1.7% for AGIs over 200k)
Taxes paid: $13,994 (reported on 53.0% of returns)
19342:
$13,994
State:
$9,982
(% of AGI for various income ranges: 6.6% for AGIs below $25k, 5.7% for AGIs $25k-50k, 5.9% for AGIs $50k-75k, 6.6% for AGIs $75k-100k, 7.7% for AGIs $100k-200k, 6.7% for AGIs over 200k)
Earned income credit: $1,603 (reported on 3.4% of returns)
Here:
$1,603
State:
$2,106
(% of AGI for various income ranges: 1.5% for AGIs below $25k, 0.3% for AGIs $25k-50k)
Percentage of individuals using paid preparers for their 2012 taxes: 58.0%
Here:
58%
State:
53%
(% for various income ranges: 49.8% for AGIs below $25k, 54.9% for AGIs $25k-50k, 59.6% for AGIs $50k-75k, 63.9% for AGIs $75k-100k, 61.0% for AGIs $100k-200k, 67.6% for AGIs over 200k)
Averages for the 2004 tax year for zip code 19342, filed in 2005:
Average Adjusted Gross Income (AGI) in 2004: $83,315 (Individual Income Tax Returns)
Here:
$83,315
State:
$48,049
Salary/wage: $76,117 (reported on 80.0% of returns)
Here:
$76,117
State:
$42,646
(% of AGI for various income ranges: 172.6% for AGIs below $10k, 59.6% for AGIs $10k-25k, 64.3% for AGIs $25k-50k, 68.0% for AGIs $50k-75k, 72.3% for AGIs $75k-100k, 74.8% for AGIs over 100k)
Taxable interest for individuals: $1,985 (reported on 69.7% of returns)
This zip code:
$1,985
Pennsylvania:
$1,657
(% of AGI for various income ranges: 12.0% for AGIs below $10k, 5.4% for AGIs $10k-25k, 2.7% for AGIs $25k-50k, 2.6% for AGIs $50k-75k, 1.9% for AGIs $75k-100k, 1.2% for AGIs over 100k)
Taxable dividends: $3,230 (reported on 52.3% of returns)
Here:
$3,230
State:
$3,566
(% of AGI for various income ranges: 16.6% for AGIs below $10k, 5.7% for AGIs $10k-25k, 3.3% for AGIs $25k-50k, 2.6% for AGIs $50k-75k, 2.0% for AGIs $75k-100k, 1.6% for AGIs over 100k)
Net capital gain/loss: +$7,819 (reported on 41.1% of returns)
Here:
+$7,819
State:
+$9,716
(% of AGI for various income ranges: -6.6% for AGIs below $10k, -1.1% for AGIs $10k-25k, 0.4% for AGIs $25k-50k, 1.2% for AGIs $50k-75k, 1.5% for AGIs $75k-100k, 5.3% for AGIs over 100k)
Profit/loss from business: +$26,223 (reported on 16.7% of returns)
Here:
+$26,223
State:
+$14,267
(% of AGI for various income ranges: -7.4% for AGIs below $10k, 5.3% for AGIs $10k-25k, 6.5% for AGIs $25k-50k, 4.9% for AGIs $50k-75k, 5.9% for AGIs $75k-100k, 5.1% for AGIs over 100k)
IRA payment deduction: $3,571 (reported on 4.5% of returns)
19342:
$3,571
Pennsylvania:
$2,903
(% of AGI for various income ranges: 1.0% for AGIs below $10k, 0.5% for AGIs $10k-25k, 0.5% for AGIs $25k-50k, 0.4% for AGIs $50k-75k, 0.2% for AGIs $75k-100k, 0.1% for AGIs over 100k)
Self-employed pension: $14,516 (reported on 2.7% of returns)
Here:
$14,516
Pennsylvania:
$14,674
(% of AGI for various income ranges: 0.4% for AGIs $50k-75k, 0.4% for AGIs $75k-100k, 0.6% for AGIs over 100k)
Total itemized deductions: $24,675 (20% of AGI, reported on 57.8% of returns)
Here:
$24,675
State:
$18,804
Here:
19.8% of AGI
State:
19.5% of AGI
(% of AGI for various income ranges: 42.6% for AGIs below $10k, 22.0% for AGIs $10k-25k, 21.7% for AGIs $25k-50k, 20.0% for AGIs $50k-75k, 19.8% for AGIs $75k-100k, 15.4% for AGIs over 100k)
Charity contributions deductions: $3,406 (3% of AGI, reported on 54.6% of returns)
Here:
$3,406
State:
$3,337
Here:
2.7% of AGI
State:
3.3% of AGI
(% of AGI for various income ranges: 1.2% for AGIs below $10k, 1.9% for AGIs $10k-25k, 2.4% for AGIs $25k-50k, 2.3% for AGIs $50k-75k, 2.4% for AGIs $75k-100k, 2.2% for AGIs over 100k)
Total tax: $16,002 (reported on 83.2% of returns)
19342:
$16,002
State:
$8,008
(% of AGI for various income ranges: 5.8% for AGIs below $10k, 4.7% for AGIs $10k-25k, 8.0% for AGIs $25k-50k, 10.1% for AGIs $50k-75k, 11.3% for AGIs $75k-100k, 19.1% for AGIs over 100k)
Earned income credit: $1,131 (reported on 2.8% of returns)
Here:
$1,131
State:
$1,643
Percentage of individuals using paid preparers for their 2004 taxes: 57.0%
Here:
57%
State:
56%
(% for various income ranges: 46.4% for AGIs below $10k, 53.2% for AGIs $10k-25k, 58.0% for AGIs $25k-50k, 62.8% for AGIs $50k-75k, 60.0% for AGIs $75k-100k, 60.9% for AGIs over 100k)
Likely homosexual households (counted as self-reported same-sex unmarried-partner households)
Lesbian couples: 0.2% of all households
Gay men: 0.0% of all households
Household received Food Stamps/SNAP in the past 12 months: 147 Household did not receive Food Stamps/SNAP in the past 12 months: 7,765
Women who had a birth in the past 12 months: 228 (226 now married, 13 unmarried) Women who did not have a birth in the past 12 months: 3,708 (1,760 now married, 1,938 unmarried)
Housing units in zip code 19342 with a mortgage: 3,640 (439 second mortgage, 18 home equity loan, 388 both second mortgage and home equity loan) Houses without a mortgage: 187
Median monthly owner costs for units with a mortgage: $2,836 Median monthly owner costs for units without a mortgage: $1,019
Residents with income below the poverty level in 2022:
This zip code:
1.6%
Whole state:
11.8%
Residents with income below 50% of the poverty level in 2022:
This zip code:
0.7%
Whole state:
6.1%
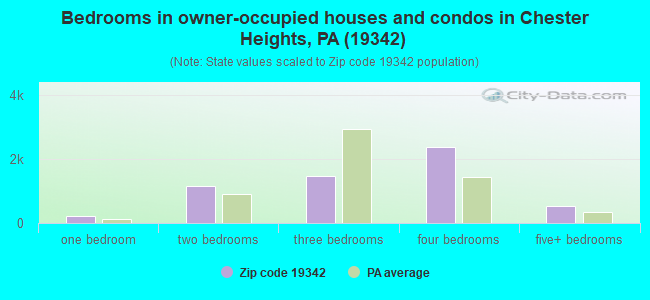
Median number of rooms in houses and condos:
Here:
7.6
State:
6.8
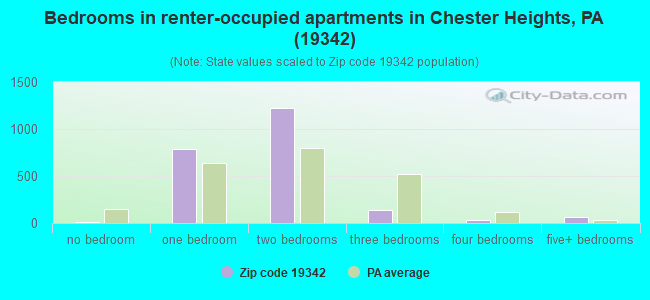
Median number of rooms in apartments:
Here:
3.9
State:
4.3
Notable locations in this zip code not listed on our city pages
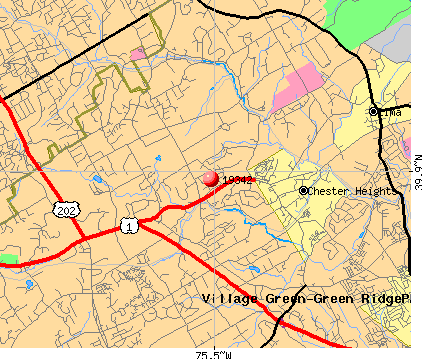
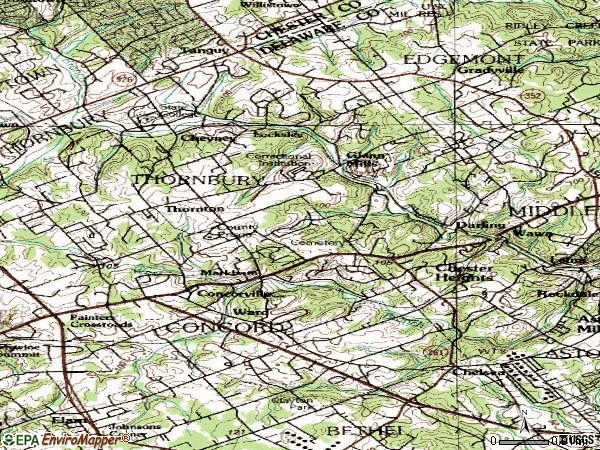
Notable locations in zip code 19342: Felton Mills (A), Cambridge Downs (B), Clayton Park Golf Course (C), Concord Interplex Business Center (D), Concord Township Building (E), Glen Mills Station (F), Golf Course at Glen Mills (G), Spring Valley Business Park (H), Ivy Mills Station (I), Woodland Station (J), Concord Station (K), Darlington Station (L), Chester Heights Station (M), Concordville Fire and Protective Association Station 59 (N), Edgmont Township Fire Company Station 64 (O), Penn State University Delaware County Campus Library (P), Rachel Kohl Community Library (Q), Brandywine Academy (R), Delaware County Prison (S), Concord Township Library (T). Display/hide their locations on the map
Churches in zip code 19342 include: Elam United Methodist Church (A), Fellowship Baptist Church (B), Saint Johns Church (C), Thornbury Church (D). Display/hide their locations on the map
Parks in zip code 19342 include: Ridley Creek State Park (1), Brandywine Racket Club (2), Newlin Grist Mill Park (3). Display/hide their locations on the map
In group quarters: 2,120 (-1 institutionalized population)
Size of family households: 2,388 2-persons, 1,057 3-persons, 1,174 4-persons, 315 5-persons, 48 6-persons, 55 7-or-more-persons
Size of nonfamily households: 2,497 1-person, 397 2-persons, 26 3-persons
3,983 married couples with children.
176 single-parent households (24 men, 152 women).
87.4% of residents of 19342 zip code speak English at home.
3.7% of residents speak Spanish at home (89% very well, 8% well, 3% not well).
4.9% of residents speak other Indo-European language at home (83% very well, 17% well).
4.1% of residents speak Asian or Pacific Island language at home (91% very well, 9% well).
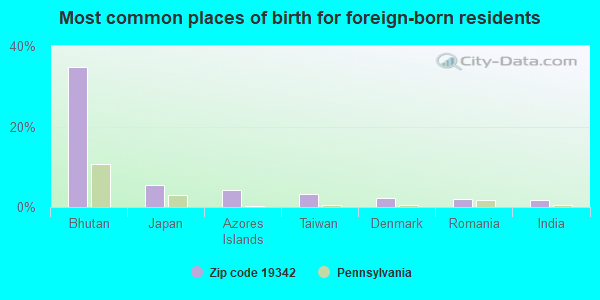
Foreign born population: 1,707 (8.2%) (60.2% of them are naturalized citizens)
This zip code:
8.2%
Whole state:
7.5%
35%Bhutan
5%Japan
4%Azores Islands
3%Taiwan
2%Denmark
2%Romania
2%India
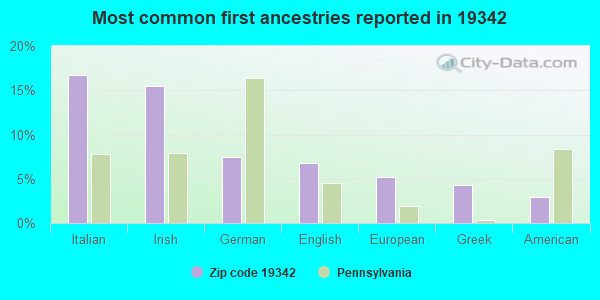
17%Italian
16%Irish
7%German
7%English
5%European
4%Greek
3%American
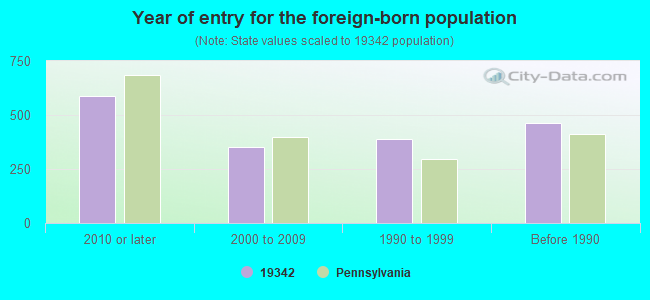
Year of entry for the foreign-born population
5882010 or later
3542000 to 2009
3871990 to 1999
464Before 1990
Facilities with environmental interests located in this zip code:
AIR MINOR (AIRS/AFS) Business SIC classification: DRYCLEANING PLANTS, EXCEPT RUG CLEANING
AMERICAN WATER SERVICES INC (CONCORD INDUSTRIAL PARK STP in GLEN MILLS, PA)
National Pollutant Discharge Elimination System NON-MAJOR (Tracking pollutant discharge elimination systems) - permit Business SIC classification: OPERATORS OF NONRESIDENTIAL BUILDINGS Alternative names: AMERICAN COMM MGMT SERVICES CO, CONCORD INDUSTRIAL PARK
Housing units lacking complete plumbing facilities: 0.6% Housing units lacking complete kitchen facilities: 1.4%
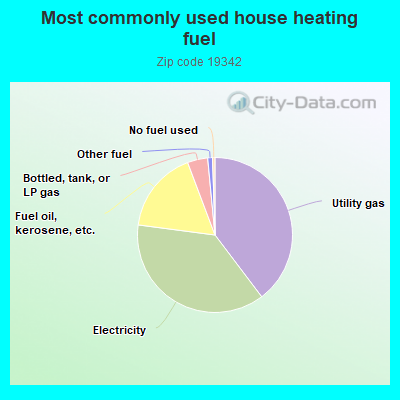
39.5%Utility gas
37.2%Electricity
17.1%Fuel oil, kerosene, etc.
4.2%Bottled, tank, or LP gas
1.0%Other fuel
0.5%No fuel used
Population in 1990: 11,632. Population change in the 1990s: +2,108 (+18.1%).
Place of birth for U.S.-born residents:
This state: 13,555
Northeast: 2,110
Midwest: 880
South: 2,247
West: 351
58% of the 19342 zip code residents lived in the same house 5 years ago. Out of people who lived in different houses, 57% lived in this county. Out of people who lived in different counties, 50% lived in Pennsylvania.
84% of the 19342 zip code residents lived in the same house 1 year ago. Out of people who lived in different houses, 27% moved from this county. Out of people who lived in different houses, 44% moved from different county within same state. Out of people who lived in different houses, 27% moved from different state. Out of people who lived in different houses, 1% moved from abroad.
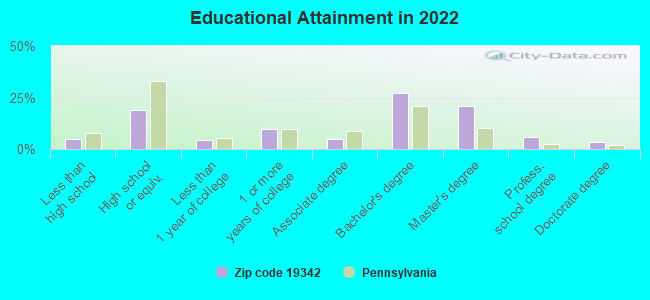
Private vs. public school enrollment:
Students in private schools in grades 1 to 8 (elementary and middle school): 270
Here:
12.3%
Pennsylvania:
15.7%
Students in private schools in grades 9 to 12 (high school): 251
Here:
19.9%
Pennsylvania:
13.4%
Students in private undergraduate colleges: 94
Here:
18.1%
Pennsylvania:
39.8%
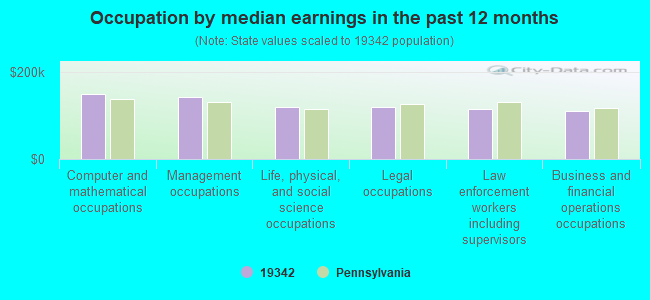
Occupation by median earnings in the past 12 months ($)
150,833Computer and mathematical occupations
143,253Management occupations
120,892Life, physical, and social science occupations
119,959Legal occupations
114,902Law enforcement workers including supervisors
111,807Business and financial operations occupations
Companies with federal contracts located in this zip code (GLEN MILLS, PA):
GLEN MILLS SCHOOLS (GLEN MILLS RD) 535 employees, $39819668 revenue: $676,498 in 14 contractsfrom 1999 to 2005
Contracts for Social Rehabilitation Services by Bureau of Prisoners/Federal Prison System Signed by year:2000: $159,000; 2001: $80,000; 2002: $0; 2003: $31,248; 2004: $47,500; 2005: $23,750; 2006: $0.
Biggest contracts:
$335,000 with Bureau of Prisoners/Federal Prison System for Social Rehabilitation Services. Signed on 1999-10-15. Completion date: 2000-09-15.
$100,000, same as above.Signed on 2000-10-15. Completion date: 2001-09-15.
$47,500, same as above.Signed on 2004-10-06. Completion date: 2004-10-06.
$33,000, same as above.Signed on 2001-06-15. Completion date: 2003-09-15.
WIECZOREK, MARK DMD, PC (1788 WILMINGTON PIKE STE; small business)
$13,000 with Army for Dentistry Services. Signed on 2005-03-19. Completion date: 2005-04-04.
BUZZ BURGER, INC (13 TWIN PINE WAY; small business) : $8,382 in 2 contractsin 2001
$7,900 with Navy for Construction of Structures and Facilities -- Miscellaneous Buildings. Signed on 2001-03-01. Completion date: 2001-05-01.
$482, same as above.Signed on 2001-04-26. Completion date: 2001-05-01.
ENERGY INITIATIVES, INC (491 WILMINGTON-WEST CHESTE; small business)
$6,586 with Navy for Construction of Structures and Facilities -- Office Buildings. Signed on 2004-05-25. Completion date: 2004-07-09.
KELLAM LAWN MOWER SERVICE, INC (336 WILMINGTON PIKE; small business)
$4,498 with Navy for Ice Breakers. Signed on 2005-04-14. Completion date: 2005-05-05.
Top industries in this zip code by the number of employees in 2005:
2006 - 2018 National Fire Incident Reporting System (NFIRS) incidents
According to the data from the years 2006 - 2018 the average number of fire incidents per year is 30. The highest number of fires - 68 took place in 2016, and the least - 0 in 2010. The data has a growing trend.
When looking into fire subcategories, the most reports belonged to: Structure Fires (48.1%), and Outside Fires (36.0%).
Fire incident types reported to NFIRS in Zip Code 19342
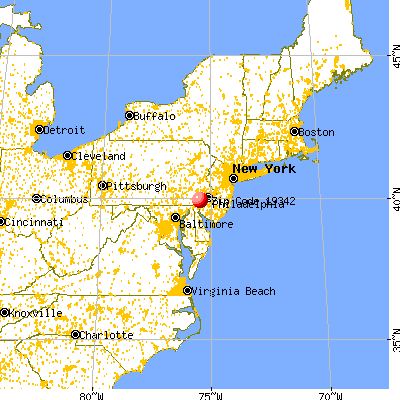


 Nearest zip codes: 19319, 19373, 19017, 19060, 19014, 19063.
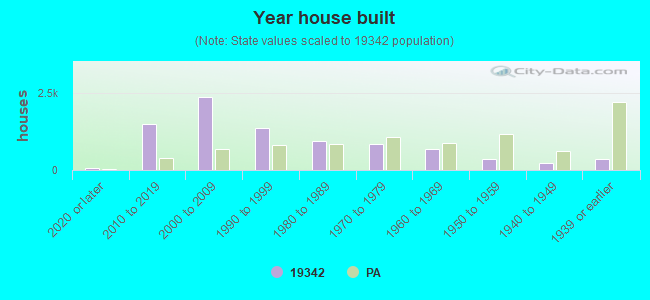


 According to the data from the years 2006 - 2018 the average number of fire incidents per year is 30. The highest number of fires - 68 took place in 2016, and the least - 0 in 2010. The data has a growing trend.
 When looking into fire subcategories, the most reports belonged to: Structure Fires (48.1%), and Outside Fires (36.0%).