Estimated zip code population in 2022: 28,045 Zip code population in 2010: 25,536 Zip code population in 2000: 21,427
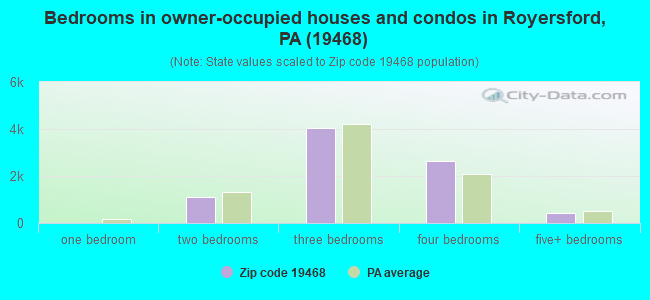
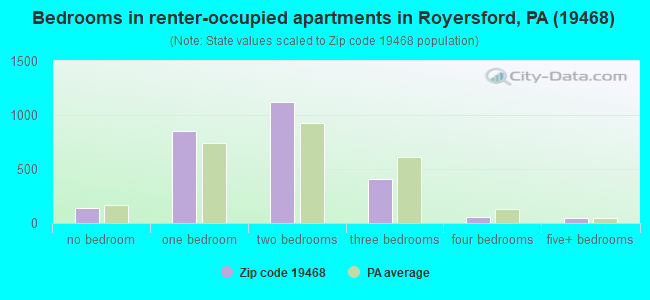
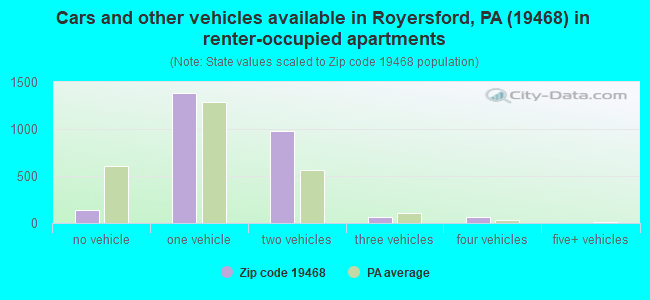
Houses and condos: 11,196 Renter-occupied apartments: 2,601
% of renters here:
24%
State:
31%
March 2022 cost of living index in zip code 19468: 105.3 (more than average, U.S. average is 100)
Land area: 16.4 sq. mi. Water area: 0.3 sq. mi.
Population density: 1,711 people per square mile
(low).
OSM Map
General Map
Google Map
MSN Map
OSM Map
General Map
Google Map
MSN Map
OSM Map
General Map
Google Map
MSN Map
OSM Map
General Map
Google Map
MSN Map
Please wait while loading the map...
Real estate property taxes paid for housing units in 2022:
This zip code:
1.2% ($4,597)
Pennsylvania:
1.3% ($3,094)
Median real estate property taxes paid for housing units with mortgages in 2022: $4,909 (1.2%) Median real estate property taxes paid for housing units with no mortgage in 2022: $4,067 (1.2%)
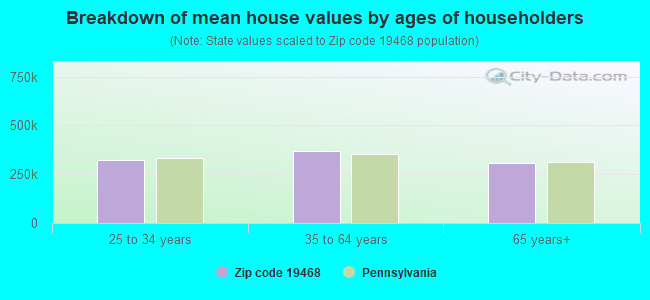
Estimated median house/condo value in 2022: $375,739
19468:
$375,739
Pennsylvania:
$245,500
According to our research of Pennsylvania and other state lists, there were 10 registered sex offenders living in 19468 zip code as of April 27, 2024. The ratio of all residents to sex offenders in zip code 19468 is 2,643 to 1. The ratio of registered sex offenders to all residents in this zip code is much lower than the state average.
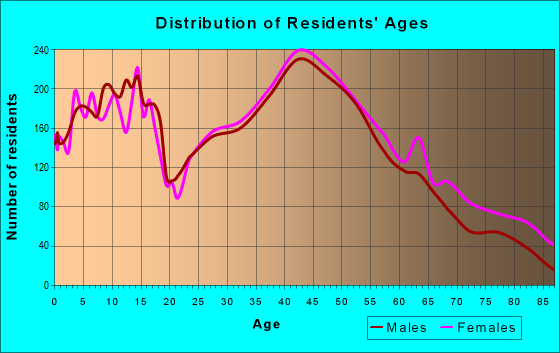
Median resident age:
This zip code:
39.4 years
Pennsylvania median age:
40.9 years
Average household size:
This zip code:
2.5 people
Pennsylvania:
2.4 people
Averages for the 2020 tax year for zip code 19468, filed in 2021:
Average Adjusted Gross Income (AGI) in 2020: $88,694 (Individual Income Tax Returns)
Here:
$88,694
State:
$75,707
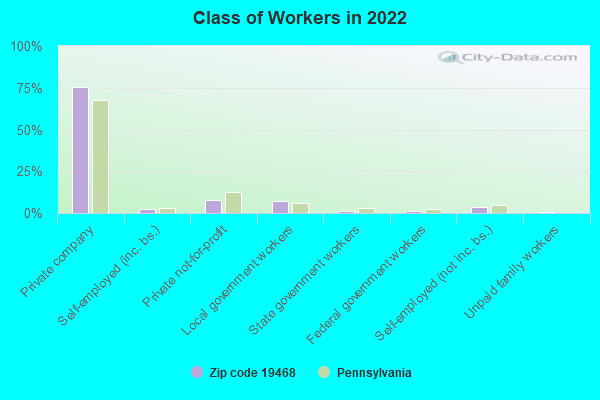
Salary/wage: $82,591 (reported on 84.1% of returns)
Here:
$82,591
State:
$62,806
(% of AGI for various income ranges: 996.1% for AGIs below $25k, 3530.4% for AGIs $25k-50k, 6265.0% for AGIs $50k-75k, 9254.0% for AGIs $75k-100k, 19230.8% for AGIs $100k-200k, 73669.1% for AGIs over 200k)
Taxable interest for individuals: $904 (reported on 37.2% of returns)
This zip code:
$904
Pennsylvania:
$1,633
(% of AGI for various income ranges: 19.4% for AGIs below $25k, 26.3% for AGIs $25k-50k, 34.5% for AGIs $50k-75k, 42.5% for AGIs $75k-100k, 78.2% for AGIs $100k-200k, 295.7% for AGIs over 200k)
Ordinary dividends: $3,328 (reported on 29.3% of returns)
Here:
$3,328
State:
$7,382
(% of AGI for various income ranges: 38.6% for AGIs below $25k, 53.7% for AGIs $25k-50k, 87.5% for AGIs $50k-75k, 132.5% for AGIs $75k-100k, 203.3% for AGIs $100k-200k, 1161.3% for AGIs over 200k)
Net capital gain/loss in AGI: +$7,920 (reported on 24.7% of returns)
Here:
+$7,920
State:
+$23,522
(% of AGI for various income ranges: 17.7% for AGIs below $25k, 35.7% for AGIs $25k-50k, 80.4% for AGIs $50k-75k, 132.1% for AGIs $75k-100k, 371.9% for AGIs $100k-200k, 3746.2% for AGIs over 200k)
Profit/loss from business: +$15,930 (reported on 13.0% of returns)
Here:
+$15,930
State:
+$16,274
(% of AGI for various income ranges: 93.9% for AGIs below $25k, 140.1% for AGIs $25k-50k, 182.6% for AGIs $50k-75k, 163.1% for AGIs $75k-100k, 509.6% for AGIs $100k-200k, 2267.2% for AGIs over 200k)
Taxable individual retirement arrangement distribution: $17,842 (reported on 11.9% of returns)
19468:
$17,842
Pennsylvania:
$18,583
(% of AGI for various income ranges: 104.7% for AGIs below $25k, 173.3% for AGIs $25k-50k, 241.8% for AGIs $50k-75k, 380.0% for AGIs $75k-100k, 559.1% for AGIs $100k-200k, 1295.1% for AGIs over 200k)
Self-employed (Keogh) retirement plans: $14,900 (reported on 0.6% of returns)
19468:
$14,900
Pennsylvania:
$25,407
(% of AGI for various income ranges: 19.1% for AGIs $100k-200k, 207.4% for AGIs over 200k)
Total itemized deductions: $28,344 (reported on 11.8% of returns)
Here:
$28,344
State:
$34,850
(% of AGI for various income ranges: 81.8% for AGIs below $25k, 143.8% for AGIs $25k-50k, 283.6% for AGIs $50k-75k, 451.8% for AGIs $75k-100k, 852.2% for AGIs $100k-200k, 3867.7% for AGIs over 200k)
Charity contributions: $6,901 (reported on 9.6% of returns)
Here:
$6,901
State:
$12,392
(% of AGI for various income ranges: 4.4% for AGIs below $25k, 17.3% for AGIs $25k-50k, 34.1% for AGIs $50k-75k, 58.0% for AGIs $75k-100k, 162.4% for AGIs $100k-200k, 1045.7% for AGIs over 200k)
Taxes paid: $8,380 (reported on 11.8% of returns)
19468:
$8,380
State:
$8,200
(% of AGI for various income ranges: 11.7% for AGIs below $25k, 33.5% for AGIs $25k-50k, 93.8% for AGIs $50k-75k, 158.9% for AGIs $75k-100k, 295.3% for AGIs $100k-200k, 971.1% for AGIs over 200k)
Earned income credit: $1,754 (reported on 6.2% of returns)
Here:
$1,754
State:
$2,100
(% of AGI for various income ranges: 42.2% for AGIs below $25k, 30.9% for AGIs $25k-50k)
Percentage of individuals using paid preparers for their 2020 taxes: 92.3%
Here:
92%
State:
92%
(% for various income ranges: 89.6% for AGIs below $25k, 92.6% for AGIs $25k-50k, 92.7% for AGIs $50k-75k, 93.1% for AGIs $75k-100k, 93.5% for AGIs $100k-200k, 93.9% for AGIs over 200k)
Averages for the 2012 tax year for zip code 19468, filed in 2013:
Average Adjusted Gross Income (AGI) in 2012: $69,944 (Individual Income Tax Returns)
Here:
$69,944
State:
$61,346
Salary/wage: $66,833 (reported on 86.8% of returns)
Here:
$66,833
State:
$51,902
(% of AGI for various income ranges: 69.5% for AGIs below $25k, 78.2% for AGIs $25k-50k, 80.0% for AGIs $50k-75k, 83.9% for AGIs $75k-100k, 87.7% for AGIs $100k-200k, 80.8% for AGIs over 200k)
Taxable interest for individuals: $705 (reported on 42.5% of returns)
This zip code:
$705
Pennsylvania:
$1,588
(% of AGI for various income ranges: 1.4% for AGIs below $25k, 0.6% for AGIs $25k-50k, 0.5% for AGIs $50k-75k, 0.5% for AGIs $75k-100k, 0.3% for AGIs $100k-200k, 0.3% for AGIs over 200k)
Ordinary dividends: $2,181 (reported on 27.9% of returns)
Here:
$2,181
State:
$5,827
(% of AGI for various income ranges: 2.3% for AGIs below $25k, 1.0% for AGIs $25k-50k, 0.9% for AGIs $50k-75k, 0.8% for AGIs $75k-100k, 0.6% for AGIs $100k-200k, 0.9% for AGIs over 200k)
Net capital gain/loss in AGI: +$4,060 (reported on 19.6% of returns)
Here:
+$4,060
State:
+$14,495
(% of AGI for various income ranges: 0.1% for AGIs $25k-50k, 0.4% for AGIs $50k-75k, 0.4% for AGIs $75k-100k, 0.6% for AGIs $100k-200k, 3.9% for AGIs over 200k)
Profit/loss from business: +$16,625 (reported on 11.6% of returns)
Here:
+$16,625
State:
+$16,268
(% of AGI for various income ranges: 5.4% for AGIs below $25k, 2.7% for AGIs $25k-50k, 3.0% for AGIs $50k-75k, 2.5% for AGIs $75k-100k, 1.9% for AGIs $100k-200k, 3.7% for AGIs over 200k)
Taxable individual retirement arrangement distribution: $12,388 (reported on 12.2% of returns)
19468:
$12,388
Pennsylvania:
$14,550
(% of AGI for various income ranges: 5.7% for AGIs below $25k, 3.1% for AGIs $25k-50k, 2.7% for AGIs $50k-75k, 2.1% for AGIs $75k-100k, 1.8% for AGIs $100k-200k, 1.3% for AGIs over 200k)
Self-employment retirement plans: $13,538 (reported on 0.6% of returns)
19468:
$13,538
Pennsylvania:
$20,922
(% of AGI for various income ranges: 0.1% for AGIs $25k-50k, 0.4% for AGIs over 200k)
Total itemized deductions: $22,116 (20% of AGI, reported on 45.9% of returns)
Here:
$22,116
State:
$23,538
Here:
19.6% of AGI
State:
18.4% of AGI
(% of AGI for various income ranges: 12.7% for AGIs below $25k, 11.2% for AGIs $25k-50k, 14.6% for AGIs $50k-75k, 15.2% for AGIs $75k-100k, 15.8% for AGIs $100k-200k, 13.8% for AGIs over 200k)
Charity contributions: $2,695 (reported on 38.2% of returns)
Here:
$2,695
State:
$4,025
(% of AGI for various income ranges: 1.0% for AGIs below $25k, 1.0% for AGIs $25k-50k, 1.4% for AGIs $50k-75k, 1.5% for AGIs $75k-100k, 1.6% for AGIs $100k-200k, 1.6% for AGIs over 200k)
Taxes paid: $9,128 (reported on 45.8% of returns)
19468:
$9,128
State:
$9,982
(% of AGI for various income ranges: 2.9% for AGIs below $25k, 3.5% for AGIs $25k-50k, 5.2% for AGIs $50k-75k, 6.0% for AGIs $75k-100k, 7.1% for AGIs $100k-200k, 6.4% for AGIs over 200k)
Earned income credit: $1,741 (reported on 7.5% of returns)
Here:
$1,741
State:
$2,106
(% of AGI for various income ranges: 2.8% for AGIs below $25k, 0.6% for AGIs $25k-50k)
Percentage of individuals using paid preparers for their 2012 taxes: 47.3%
Here:
47%
State:
53%
(% for various income ranges: 43.9% for AGIs below $25k, 45.5% for AGIs $25k-50k, 48.3% for AGIs $50k-75k, 49.7% for AGIs $75k-100k, 48.4% for AGIs $100k-200k, 62.3% for AGIs over 200k)
Averages for the 2004 tax year for zip code 19468, filed in 2005:
Average Adjusted Gross Income (AGI) in 2004: $57,949 (Individual Income Tax Returns)
Here:
$57,949
State:
$48,049
Salary/wage: $55,988 (reported on 88.5% of returns)
Here:
$55,988
State:
$42,646
(% of AGI for various income ranges: 115.2% for AGIs below $10k, 69.8% for AGIs $10k-25k, 85.0% for AGIs $25k-50k, 88.0% for AGIs $50k-75k, 90.6% for AGIs $75k-100k, 83.3% for AGIs over 100k)
Taxable interest for individuals: $872 (reported on 55.8% of returns)
This zip code:
$872
Pennsylvania:
$1,657
(% of AGI for various income ranges: 7.5% for AGIs below $10k, 3.2% for AGIs $10k-25k, 1.1% for AGIs $25k-50k, 0.6% for AGIs $50k-75k, 0.5% for AGIs $75k-100k, 0.6% for AGIs over 100k)
Taxable dividends: $1,433 (reported on 32.5% of returns)
Here:
$1,433
State:
$3,566
(% of AGI for various income ranges: 5.6% for AGIs below $10k, 2.5% for AGIs $10k-25k, 0.8% for AGIs $25k-50k, 0.6% for AGIs $50k-75k, 0.5% for AGIs $75k-100k, 0.7% for AGIs over 100k)
Net capital gain/loss: +$3,882 (reported on 22.3% of returns)
Here:
+$3,882
State:
+$9,716
(% of AGI for various income ranges: -3.4% for AGIs below $10k, 0.8% for AGIs $10k-25k, 0.1% for AGIs $25k-50k, 0.6% for AGIs $50k-75k, 0.4% for AGIs $75k-100k, 3.1% for AGIs over 100k)
Profit/loss from business: +$13,793 (reported on 11.7% of returns)
Here:
+$13,793
State:
+$14,267
(% of AGI for various income ranges: 7.8% for AGIs below $10k, 5.1% for AGIs $10k-25k, 2.8% for AGIs $25k-50k, 2.6% for AGIs $50k-75k, 2.1% for AGIs $75k-100k, 2.8% for AGIs over 100k)
IRA payment deduction: $2,912 (reported on 2.8% of returns)
19468:
$2,912
Pennsylvania:
$2,903
(% of AGI for various income ranges: 0.4% for AGIs below $10k, 0.3% for AGIs $10k-25k, 0.3% for AGIs $25k-50k, 0.2% for AGIs $50k-75k, 0.1% for AGIs $75k-100k, 0.1% for AGIs over 100k)
Self-employed pension: $11,722 (reported on 0.8% of returns)
Here:
$11,722
Pennsylvania:
$14,674
(% of AGI for various income ranges: 0.2% for AGIs $10k-25k, 0.1% for AGIs $50k-75k, 0.1% for AGIs $75k-100k, 0.3% for AGIs over 100k)
Total itemized deductions: $19,472 (22% of AGI, reported on 48.8% of returns)
Here:
$19,472
State:
$18,804
Here:
21.8% of AGI
State:
19.5% of AGI
(% of AGI for various income ranges: 14.3% for AGIs below $10k, 11.9% for AGIs $10k-25k, 12.7% for AGIs $25k-50k, 16.3% for AGIs $50k-75k, 17.9% for AGIs $75k-100k, 17.6% for AGIs over 100k)
Charity contributions deductions: $2,296 (3% of AGI, reported on 44.0% of returns)
Here:
$2,296
State:
$3,337
Here:
2.5% of AGI
State:
3.3% of AGI
(% of AGI for various income ranges: 0.8% for AGIs below $10k, 1.2% for AGIs $10k-25k, 1.2% for AGIs $25k-50k, 1.7% for AGIs $50k-75k, 1.9% for AGIs $75k-100k, 2.0% for AGIs over 100k)
Total tax: $8,249 (reported on 83.6% of returns)
19468:
$8,249
State:
$8,008
(% of AGI for various income ranges: 3.3% for AGIs below $10k, 4.8% for AGIs $10k-25k, 8.3% for AGIs $25k-50k, 9.6% for AGIs $50k-75k, 10.4% for AGIs $75k-100k, 15.9% for AGIs over 100k)
Earned income credit: $1,399 (reported on 5.6% of returns)
Here:
$1,399
State:
$1,643
Percentage of individuals using paid preparers for their 2004 taxes: 50.1%
Here:
50%
State:
56%
(% for various income ranges: 43.3% for AGIs below $10k, 51.9% for AGIs $10k-25k, 50.7% for AGIs $25k-50k, 50.6% for AGIs $50k-75k, 52.3% for AGIs $75k-100k, 51.7% for AGIs over 100k)
Likely homosexual households (counted as self-reported same-sex unmarried-partner households)
Lesbian couples: 0.1% of all households
Gay men: 0.0% of all households
Household received Food Stamps/SNAP in the past 12 months: 540 Household did not receive Food Stamps/SNAP in the past 12 months: 10,248
Women who had a birth in the past 12 months: 484 (255 now married, 210 unmarried) Women who did not have a birth in the past 12 months: 6,478 (2,925 now married, 3,540 unmarried)
Housing units in zip code 19468 with a mortgage: 5,954 (564 second mortgage, 35 home equity loan, 499 both second mortgage and home equity loan) Houses without a mortgage: 218
Median monthly owner costs for units with a mortgage: $2,113 Median monthly owner costs for units without a mortgage: $724
Residents with income below the poverty level in 2022:
This zip code:
5.5%
Whole state:
11.8%
Residents with income below 50% of the poverty level in 2022:
This zip code:
3.5%
Whole state:
6.1%
Median number of rooms in houses and condos:
Here:
7.1
State:
6.8
Median number of rooms in apartments:
Here:
3.9
State:
4.3
Notable locations in this zip code not listed on our city pages
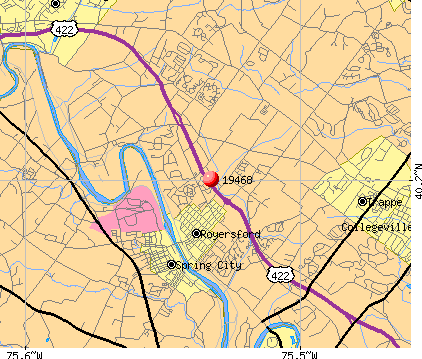
Notable locations in zip code 19468: Limerick Country Club (A), Linfield Industrial Park (B), Spring Ford Country Club (C), Limerick Airport Industrial Park (D), Limerick Golf Course (E), Linfield Corporate Center (F), Linfield Station (G), Turtle Creek Golf Course (H), Waltz Golf Farm (I), Sycamore Ridge Golf Course (J), Royersford Station (K), Humane Fire Company (L), Friendship Hook Ladder Hose and Ambulance (M), Limerick Fire Company (N), Limerick Township Building (O), Limerick Township Police Station (P), Linfield Fire Company (Q), Roversford Library (R), Royersford City Hall (S), Royersford Police Station (T). Display/hide their locations on the map
Churches in zip code 19468 include: Grace Church (A), Royersford Church (B), Saint Clair Church (C), Saint James Church (D), Bible Fellowship Church (E), Royerford Baptist Church (F), Humane Church (G), Royersford Methodist Church (H), Royersford Church of the Brethren (I). Display/hide their locations on the map
Cemeteries: Limerick Garden-Memories Cemetery (1), Tyson Cemetery (2), Fernwood Cemetery (3), Dismant Cemetery (4), Mingo Cemetery (5). Display/hide their locations on the map
In group quarters: 469 (-1 institutionalized population)
Size of family households: 3,037 2-persons, 2,210 3-persons, 1,745 4-persons, 543 5-persons, 178 6-persons, 49 7-or-more-persons
Size of nonfamily households: 2,539 1-person, 392 2-persons, 69 3-persons
4,234 married couples with children.
1,439 single-parent households (323 men, 1,116 women).
90.6% of residents of 19468 zip code speak English at home.
0.9% of residents speak Spanish at home (58% very well, 6% well, 23% not well, 14% not at all).
4.3% of residents speak other Indo-European language at home (75% very well, 21% well, 4% not well).
2.1% of residents speak Asian or Pacific Island language at home (82% very well, 11% well, 7% not well).
1.4% of residents speak other language at home (69% very well, 28% well, 3% not well).
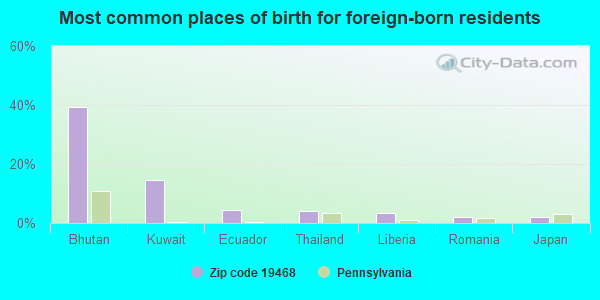
Foreign born population: 2,003 (7.1%) (55.7% of them are naturalized citizens)
This zip code:
7.1%
Whole state:
7.5%
39%Bhutan
15%Kuwait
4%Ecuador
4%Thailand
3%Liberia
2%Romania
2%Japan
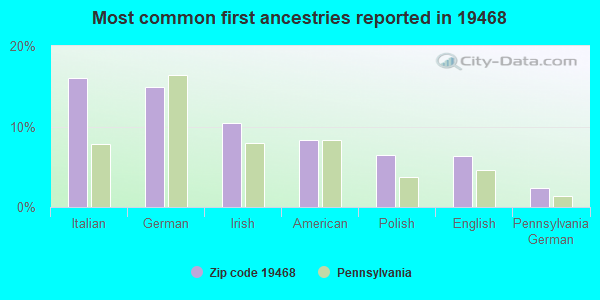
16%Italian
15%German
10%Irish
8%American
6%Polish
6%English
2%Pennsylvania German
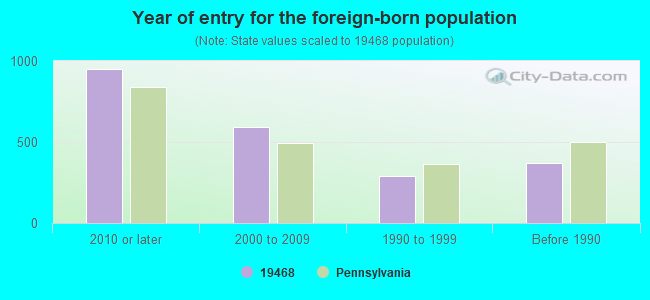
Year of entry for the foreign-born population
9522010 or later
5912000 to 2009
2881990 to 1999
370Before 1990
Facilities with environmental interests located in this zip code:
AMERICAN MACHINE AND TOOL COMPANY (400 SPRING STREET in ROYERSFORD, PA)
COMPLIANCE ACTIVITY (Tracking inspections of insecticide, fungicide, and rodenticide, and toxic substances) Conditionally Exempt Small Quantity Generators, less than 100 kg/month of hazardous waste (Resource Conservation and Recovery Act (tracking hazardous waste)) - notification TRI REPORTER (Tracking of toxic chemicals releasing facilities) - ICIS-, ENFORCEMENT/COMPLIANCE ACTIVITY Business SIC classification: PUMPS AND PUMPING EQUIPMENT Business NAICS classification: PUMP AND PUMPING EQUIPMENT MANUFACTURING. Organizations: OPERNAME (CONTACT/OPERATOR)
, OWNERNAME (CONTACT/OWNER)
Alternative names: AMERICAN MCH & TL CO INC PA
BEMISS JASON CORPORATION (455 RAILROAD PLAZA in ROYERSFORD, PA)
AIR MAJOR (AIRS/AFS) (Resource Conservation and Recovery Act (tracking hazardous waste)) Business SIC classification: CONVERTED PAPER AND PAPERBOARD PRODUCTS Organizations: OPERNAME (CONTACT/OPERATOR)
ACCUMETRICS (134 ADAMS ST in ROYERSFORD, PA)
Small Quantity Generators, between 100 kg and 1000 kg of hazardous waste/month (Resource Conservation and Recovery Act (tracking hazardous waste)) - notification Organizations: ACCUMETRICS LTD (CONTACT/OWNER)
AMERICAN MACHINERY & TOOL CO. (400 SPRING ST. in ROVERSFORD, PA)
COMPLIANCE ACTIVITY (Tracking inspections of insecticide, fungicide, and rodenticide, and toxic substances) Business SIC classification: PUMPS AND PUMPING EQUIPMENT
Housing units lacking complete plumbing facilities: 0.9% Housing units lacking complete kitchen facilities: 1.2%
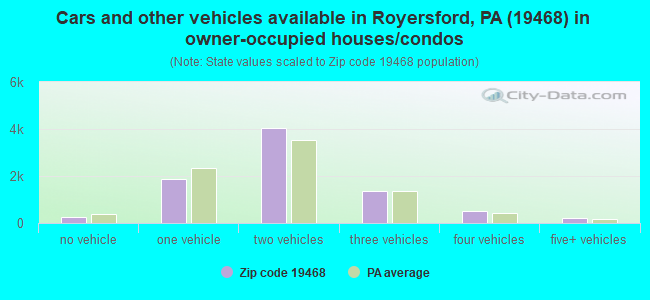
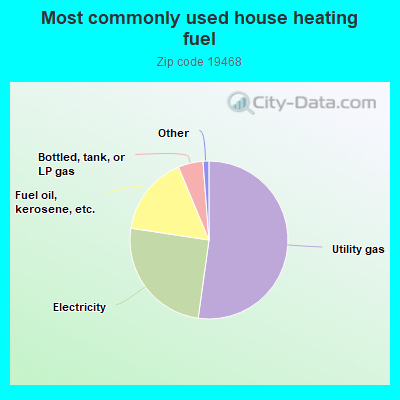
52.2%Utility gas
25.2%Electricity
16.3%Fuel oil, kerosene, etc.
5.1%Bottled, tank, or LP gas
Population in 1990: 13,825. Population change in the 1990s: +7,602 (+55.0%).
Place of birth for U.S.-born residents:
This state: 21,003
Northeast: 2,322
Midwest: 1,007
South: 1,113
West: 377
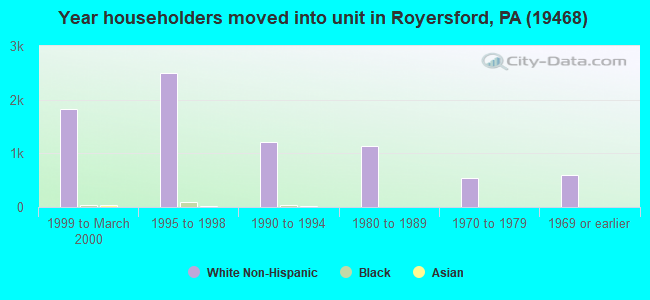
49% of the 19468 zip code residents lived in the same house 5 years ago. Out of people who lived in different houses, 51% lived in this county. Out of people who lived in different counties, 50% lived in Pennsylvania.
89% of the 19468 zip code residents lived in the same house 1 year ago. Out of people who lived in different houses, 54% moved from this county. Out of people who lived in different houses, 35% moved from different county within same state. Out of people who lived in different houses, 6% moved from different state. Out of people who lived in different houses, 3% moved from abroad.
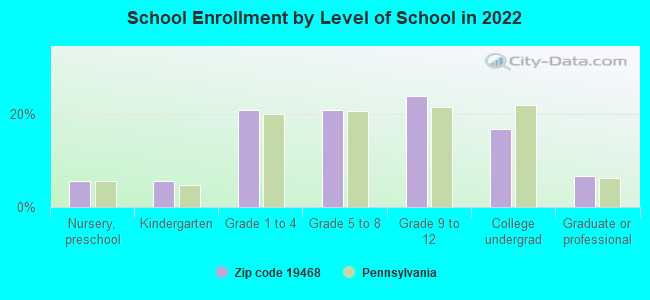
Private vs. public school enrollment:
Students in private schools in grades 1 to 8 (elementary and middle school): 240
Here:
9.1%
Pennsylvania:
15.7%
Students in private schools in grades 9 to 12 (high school): 117
Here:
7.7%
Pennsylvania:
13.4%
Students in private undergraduate colleges: 388
Here:
35.9%
Pennsylvania:
39.8%
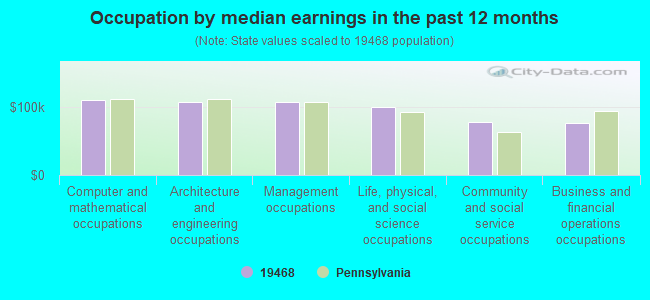
Occupation by median earnings in the past 12 months ($)
111,432Computer and mathematical occupations
108,734Architecture and engineering occupations
108,454Management occupations
101,036Life, physical, and social science occupations
77,959Community and social service occupations
76,563Business and financial operations occupations
Companies with federal contracts located in this zip code (ROYERSFORD, PA):
HYVAC PRODUCTS INC (201 N 5TH AVE; small business) : $308,073 in 10 contractsfrom 2000 to 2006
Contracts for Compressors and Vacuum Pumps, Maintenance, Repair and Rebuilding of Equipment -- Space Vehicles, Maintenance, Repair and Rebuilding of Equipment -- Pumps and Compressors by Air Force, NASA, Army, Agricultural Research Service, and others Signed by year:2000: $232,400; 2001: $0; 2002: $3,321; 2003: $33,678; 2004: $0; 2005: $23,674; 2006: $15,000.
Biggest contracts:
$117,600 with Air Force for Compressors and Vacuum Pumps. Signed on 2000-03-09. Completion date: 2000-08-31.
$114,800, same as above.Signed on 2000-12-28. Completion date: 2001-04-30.
$29,919, same as above.Signed on 2003-04-09. Completion date: 2003-07-31.
$15,000, same as above.Signed on 2006-03-13. Completion date: 2006-07-15.
PROCONEX GOVERNMENT SERVICES (103 ENTERPRISE DR; small business) : $238,768 in 2 contractsin 2006
$234,560 with Navy for Maintenance, Repair and Rebuilding of Equipment -- Plumbing, Heating, and Waste Disposal Equipment. Signed on 2006-01-12. Completion date: 2006-07-01.
$4,208 with Navy for Plumbing Fixtures and Accessories. Taking place in DC. Signed on 2006-01-24. Completion date: 2006-01-31.
BERKMONT COMMUNICATIONS (15 BENNER RD; small business) : $5,343 in 3 contractsfrom 2004 to 2006
$2,781 with Army for Telephone and/or Communications Services (includes Telegraph, Telex, and Cablevision Services). Signed on 2005-11-15. Completion date: 2005-11-30.
$2,700, same as above.Signed on 2004-11-18. Completion date: 2005-11-30.
-$138, same as above.Signed on 2006-05-31. Completion date: 2005-11-30.
WENDT DUNNINGTON CO (546 ENTERPRISE DRIVE; small business)
$3,965 with Army for Cutting Tools for Machine Tools. Signed on 2005-04-14. Completion date: 2005-06-24.
A-ROUND CONNECTORS, INC (510 TRAPPE RD; small business)
$1,732 with Navy for Motors, Electrical. Signed on 2005-07-27. Completion date: 2005-08-03.
Top industries in this zip code by the number of employees in 2005:
2003 - 2018 National Fire Incident Reporting System (NFIRS) incidents
According to the data from the years 2003 - 2018 the average number of fires per year is 55. The highest number of reported fires - 128 took place in 2016, and the least - 7 in 2009. The data has an increasing trend.
When looking into fire subcategories, the most reports belonged to: Structure Fires (61.5%), and Outside Fires (26.2%).
Fire incident types reported to NFIRS in Zip Code 19468
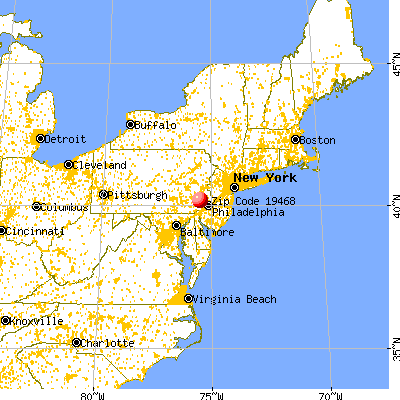


 Nearest zip codes: 19457, 19473, 19453, 19475, 19460, 19492.


 According to the data from the years 2003 - 2018 the average number of fires per year is 55. The highest number of reported fires - 128 took place in 2016, and the least - 7 in 2009. The data has an increasing trend.
 When looking into fire subcategories, the most reports belonged to: Structure Fires (61.5%), and Outside Fires (26.2%).