Estimated zip code population in 2022: 11,824 Zip code population in 2010: 11,283 Zip code population in 2000: 9,718
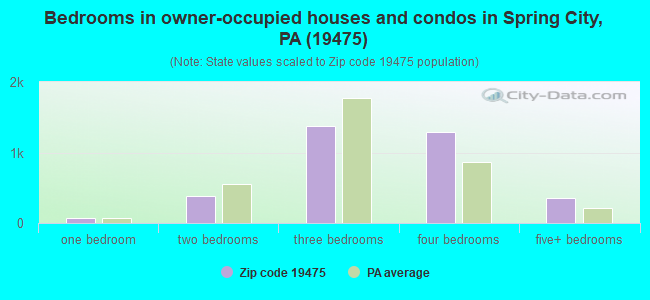
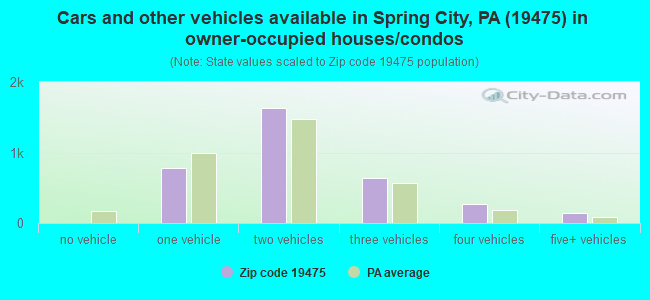
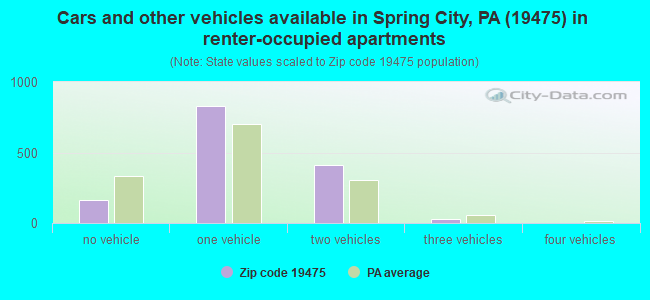
Houses and condos: 5,116 Renter-occupied apartments: 1,420
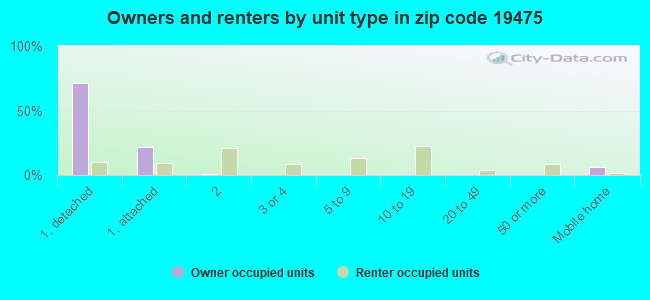
% of renters here:
29%
State:
31%
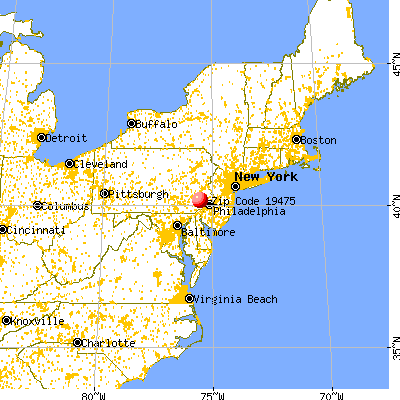
March 2022 cost of living index in zip code 19475: 103.1 (near average, U.S. average is 100)
Land area: 16.5 sq. mi. Water area: 0.3 sq. mi.
Population density: 715 people per square mile
(low).
OSM Map
General Map
Google Map
MSN Map
OSM Map
General Map
Google Map
MSN Map
OSM Map
General Map
Google Map
MSN Map
OSM Map
General Map
Google Map
MSN Map
Please wait while loading the map...
Real estate property taxes paid for housing units in 2022:
This zip code:
1.4% ($5,411)
Pennsylvania:
1.3% ($3,094)
Median real estate property taxes paid for housing units with mortgages in 2022: $5,871 (1.5%) Median real estate property taxes paid for housing units with no mortgage in 2022: $4,185 (1.4%)
Estimated median house/condo value in 2022: $373,677
19475:
$373,677
Pennsylvania:
$245,500
According to our research of Pennsylvania and other state lists, there were 11 registered sex offenders living in 19475 zip code as of May 13, 2024. The ratio of all residents to sex offenders in zip code 19475 is 1,042 to 1. The ratio of registered sex offenders to all residents in this zip code is lower than the state average.
Median resident age:
This zip code:
40.7 years
Pennsylvania median age:
40.9 years
Average household size:
This zip code:
2.4 people
Pennsylvania:
2.4 people
Averages for the 2020 tax year for zip code 19475, filed in 2021:
Average Adjusted Gross Income (AGI) in 2020: $86,128 (Individual Income Tax Returns)
Here:
$86,128
State:
$75,707
Salary/wage: $78,171 (reported on 84.0% of returns)
Here:
$78,171
State:
$62,806
(% of AGI for various income ranges: 1034.2% for AGIs below $25k, 3543.0% for AGIs $25k-50k, 6451.2% for AGIs $50k-75k, 9602.4% for AGIs $75k-100k, 19689.8% for AGIs $100k-200k, 69295.8% for AGIs over 200k)
Taxable interest for individuals: $1,060 (reported on 35.8% of returns)
This zip code:
$1,060
Pennsylvania:
$1,633
(% of AGI for various income ranges: 21.4% for AGIs below $25k, 22.0% for AGIs $25k-50k, 30.8% for AGIs $50k-75k, 55.7% for AGIs $75k-100k, 96.8% for AGIs $100k-200k, 384.7% for AGIs over 200k)
Ordinary dividends: $4,430 (reported on 25.9% of returns)
Here:
$4,430
State:
$7,382
(% of AGI for various income ranges: 32.9% for AGIs below $25k, 33.3% for AGIs $25k-50k, 76.8% for AGIs $50k-75k, 134.9% for AGIs $75k-100k, 292.3% for AGIs $100k-200k, 1615.8% for AGIs over 200k)
Net capital gain/loss in AGI: +$11,265 (reported on 21.5% of returns)
Here:
+$11,265
State:
+$23,522
(% of AGI for various income ranges: 17.8% for AGIs below $25k, 33.2% for AGIs $25k-50k, 80.4% for AGIs $50k-75k, 201.4% for AGIs $75k-100k, 483.2% for AGIs $100k-200k, 4712.1% for AGIs over 200k)
Profit/loss from business: +$20,012 (reported on 14.6% of returns)
Here:
+$20,012
State:
+$16,274
(% of AGI for various income ranges: 96.3% for AGIs below $25k, 177.8% for AGIs $25k-50k, 188.6% for AGIs $50k-75k, 331.1% for AGIs $75k-100k, 743.4% for AGIs $100k-200k, 3637.4% for AGIs over 200k)
Taxable individual retirement arrangement distribution: $18,419 (reported on 10.2% of returns)
19475:
$18,419
Pennsylvania:
$18,583
(% of AGI for various income ranges: 72.2% for AGIs below $25k, 119.3% for AGIs $25k-50k, 194.2% for AGIs $50k-75k, 340.8% for AGIs $75k-100k, 545.7% for AGIs $100k-200k, 1586.8% for AGIs over 200k)
Self-employed (Keogh) retirement plans: $26,400 (reported on 0.7% of returns)
19475:
$26,400
Pennsylvania:
$25,407
(% of AGI for various income ranges: 555.8% for AGIs over 200k)
Total itemized deductions: $28,452 (reported on 10.6% of returns)
Here:
$28,452
State:
$34,850
(% of AGI for various income ranges: 64.4% for AGIs below $25k, 109.1% for AGIs $25k-50k, 285.8% for AGIs $50k-75k, 450.8% for AGIs $75k-100k, 897.2% for AGIs $100k-200k, 3385.3% for AGIs over 200k)
Charity contributions: $6,662 (reported on 8.3% of returns)
Here:
$6,662
State:
$12,392
(% of AGI for various income ranges: 14.7% for AGIs $25k-50k, 44.0% for AGIs $50k-75k, 59.7% for AGIs $75k-100k, 154.8% for AGIs $100k-200k, 812.1% for AGIs over 200k)
Taxes paid: $8,740 (reported on 10.6% of returns)
19475:
$8,740
State:
$8,200
(% of AGI for various income ranges: 13.0% for AGIs below $25k, 36.1% for AGIs $25k-50k, 93.4% for AGIs $50k-75k, 170.8% for AGIs $75k-100k, 299.1% for AGIs $100k-200k, 905.3% for AGIs over 200k)
Earned income credit: $2,047 (reported on 8.6% of returns)
Here:
$2,047
State:
$2,100
(% of AGI for various income ranges: 55.7% for AGIs below $25k, 44.7% for AGIs $25k-50k)
Percentage of individuals using paid preparers for their 2020 taxes: 92.4%
Here:
92%
State:
92%
(% for various income ranges: 89.9% for AGIs below $25k, 94.3% for AGIs $25k-50k, 92.5% for AGIs $50k-75k, 92.5% for AGIs $75k-100k, 92.9% for AGIs $100k-200k, 94.4% for AGIs over 200k)
Averages for the 2012 tax year for zip code 19475, filed in 2013:
Average Adjusted Gross Income (AGI) in 2012: $71,368 (Individual Income Tax Returns)
Here:
$71,368
State:
$61,346
Salary/wage: $65,437 (reported on 85.5% of returns)
Here:
$65,437
State:
$51,902
(% of AGI for various income ranges: 70.3% for AGIs below $25k, 83.8% for AGIs $25k-50k, 77.9% for AGIs $50k-75k, 79.2% for AGIs $75k-100k, 85.4% for AGIs $100k-200k, 70.6% for AGIs over 200k)
Taxable interest for individuals: $1,002 (reported on 42.1% of returns)
This zip code:
$1,002
Pennsylvania:
$1,588
(% of AGI for various income ranges: 1.8% for AGIs below $25k, 0.7% for AGIs $25k-50k, 0.8% for AGIs $50k-75k, 0.5% for AGIs $75k-100k, 0.4% for AGIs $100k-200k, 0.5% for AGIs over 200k)
Ordinary dividends: $3,037 (reported on 26.8% of returns)
Here:
$3,037
State:
$5,827
(% of AGI for various income ranges: 1.9% for AGIs below $25k, 0.8% for AGIs $25k-50k, 1.1% for AGIs $50k-75k, 1.1% for AGIs $75k-100k, 1.0% for AGIs $100k-200k, 1.4% for AGIs over 200k)
Net capital gain/loss in AGI: +$4,938 (reported on 19.7% of returns)
Here:
+$4,938
State:
+$14,495
(% of AGI for various income ranges: 0.3% for AGIs $25k-50k, 0.4% for AGIs $50k-75k, 0.6% for AGIs $75k-100k, 0.8% for AGIs $100k-200k, 3.2% for AGIs over 200k)
Profit/loss from business: +$18,591 (reported on 13.5% of returns)
Here:
+$18,591
State:
+$16,268
(% of AGI for various income ranges: 6.3% for AGIs below $25k, 2.5% for AGIs $25k-50k, 3.8% for AGIs $50k-75k, 2.9% for AGIs $75k-100k, 3.1% for AGIs $100k-200k, 4.0% for AGIs over 200k)
Taxable individual retirement arrangement distribution: $13,878 (reported on 11.2% of returns)
19475:
$13,878
Pennsylvania:
$14,550
(% of AGI for various income ranges: 4.3% for AGIs below $25k, 2.1% for AGIs $25k-50k, 3.2% for AGIs $50k-75k, 3.2% for AGIs $75k-100k, 1.7% for AGIs $100k-200k, 1.6% for AGIs over 200k)
Self-employment retirement plans: $17,433 (reported on 0.6% of returns)
19475:
$17,433
Pennsylvania:
$20,922
Total itemized deductions: $24,429 (18% of AGI, reported on 40.9% of returns)
Here:
$24,429
State:
$23,538
Here:
18.5% of AGI
State:
18.4% of AGI
(% of AGI for various income ranges: 10.0% for AGIs below $25k, 9.0% for AGIs $25k-50k, 14.7% for AGIs $50k-75k, 17.4% for AGIs $75k-100k, 17.2% for AGIs $100k-200k, 11.7% for AGIs over 200k)
Charity contributions: $3,094 (reported on 34.2% of returns)
Here:
$3,094
State:
$4,025
(% of AGI for various income ranges: 0.6% for AGIs below $25k, 0.8% for AGIs $25k-50k, 1.6% for AGIs $50k-75k, 1.8% for AGIs $75k-100k, 1.6% for AGIs $100k-200k, 1.6% for AGIs over 200k)
Taxes paid: $11,558 (reported on 40.7% of returns)
19475:
$11,558
State:
$9,982
(% of AGI for various income ranges: 2.7% for AGIs below $25k, 3.2% for AGIs $25k-50k, 5.6% for AGIs $50k-75k, 7.2% for AGIs $75k-100k, 8.4% for AGIs $100k-200k, 6.8% for AGIs over 200k)
Earned income credit: $1,996 (reported on 11.0% of returns)
Here:
$1,996
State:
$2,106
(% of AGI for various income ranges: 4.5% for AGIs below $25k, 0.7% for AGIs $25k-50k)
Percentage of individuals using paid preparers for their 2012 taxes: 47.9%
Here:
48%
State:
53%
(% for various income ranges: 42.0% for AGIs below $25k, 45.9% for AGIs $25k-50k, 50.7% for AGIs $50k-75k, 53.2% for AGIs $75k-100k, 52.3% for AGIs $100k-200k, 64.3% for AGIs over 200k)
Averages for the 2004 tax year for zip code 19475, filed in 2005:
Average Adjusted Gross Income (AGI) in 2004: $61,324 (Individual Income Tax Returns)
Here:
$61,324
State:
$48,049
Salary/wage: $55,070 (reported on 87.3% of returns)
Here:
$55,070
State:
$42,646
(% of AGI for various income ranges: 104.3% for AGIs below $10k, 75.6% for AGIs $10k-25k, 84.7% for AGIs $25k-50k, 86.3% for AGIs $50k-75k, 87.3% for AGIs $75k-100k, 71.6% for AGIs over 100k)
Taxable interest for individuals: $1,064 (reported on 53.3% of returns)
This zip code:
$1,064
Pennsylvania:
$1,657
(% of AGI for various income ranges: 6.7% for AGIs below $10k, 2.7% for AGIs $10k-25k, 1.1% for AGIs $25k-50k, 1.0% for AGIs $50k-75k, 0.5% for AGIs $75k-100k, 0.7% for AGIs over 100k)
Taxable dividends: $2,245 (reported on 32.1% of returns)
Here:
$2,245
State:
$3,566
(% of AGI for various income ranges: 8.7% for AGIs below $10k, 1.8% for AGIs $10k-25k, 0.8% for AGIs $25k-50k, 0.8% for AGIs $50k-75k, 0.9% for AGIs $75k-100k, 1.2% for AGIs over 100k)
Net capital gain/loss: +$9,232 (reported on 23.5% of returns)
Here:
+$9,232
State:
+$9,716
(% of AGI for various income ranges: -2.5% for AGIs below $10k, 0.8% for AGIs $10k-25k, 0.8% for AGIs $25k-50k, 0.6% for AGIs $50k-75k, 0.9% for AGIs $75k-100k, 6.2% for AGIs over 100k)
Profit/loss from business: +$14,596 (reported on 13.8% of returns)
Here:
+$14,596
State:
+$14,267
(% of AGI for various income ranges: 4.0% for AGIs below $10k, 4.2% for AGIs $10k-25k, 4.2% for AGIs $25k-50k, 2.4% for AGIs $50k-75k, 2.8% for AGIs $75k-100k, 3.4% for AGIs over 100k)
IRA payment deduction: $3,042 (reported on 2.5% of returns)
19475:
$3,042
Pennsylvania:
$2,903
(% of AGI for various income ranges: 0.7% for AGIs below $10k, 0.3% for AGIs $25k-50k, 0.2% for AGIs $50k-75k, 0.1% for AGIs $75k-100k, 0.1% for AGIs over 100k)
Self-employed pension: $13,467 (reported on 0.6% of returns)
Here:
$13,467
Pennsylvania:
$14,674
Total itemized deductions: $20,517 (19% of AGI, reported on 43.4% of returns)
Here:
$20,517
State:
$18,804
Here:
18.9% of AGI
State:
19.5% of AGI
(% of AGI for various income ranges: 16.1% for AGIs below $10k, 9.6% for AGIs $10k-25k, 12.0% for AGIs $25k-50k, 16.2% for AGIs $50k-75k, 18.4% for AGIs $75k-100k, 14.0% for AGIs over 100k)
Charity contributions deductions: $2,530 (2% of AGI, reported on 38.8% of returns)
Here:
$2,530
State:
$3,337
Here:
2.2% of AGI
State:
3.3% of AGI
(% of AGI for various income ranges: 0.7% for AGIs below $10k, 0.8% for AGIs $10k-25k, 1.3% for AGIs $25k-50k, 1.9% for AGIs $50k-75k, 1.8% for AGIs $75k-100k, 1.7% for AGIs over 100k)
Total tax: $9,914 (reported on 79.5% of returns)
19475:
$9,914
State:
$8,008
(% of AGI for various income ranges: 3.1% for AGIs below $10k, 4.7% for AGIs $10k-25k, 7.9% for AGIs $25k-50k, 8.7% for AGIs $50k-75k, 9.7% for AGIs $75k-100k, 17.2% for AGIs over 100k)
Earned income credit: $1,539 (reported on 8.3% of returns)
Here:
$1,539
State:
$1,643
Percentage of individuals using paid preparers for their 2004 taxes: 53.0%
Here:
53%
State:
56%
(% for various income ranges: 48.5% for AGIs below $10k, 55.2% for AGIs $10k-25k, 52.8% for AGIs $25k-50k, 54.4% for AGIs $50k-75k, 53.2% for AGIs $75k-100k, 54.9% for AGIs over 100k)
Likely homosexual households (counted as self-reported same-sex unmarried-partner households)
Lesbian couples: 0.2% of all households
Gay men: 0.4% of all households
Household received Food Stamps/SNAP in the past 12 months: 790 Household did not receive Food Stamps/SNAP in the past 12 months: 4,110
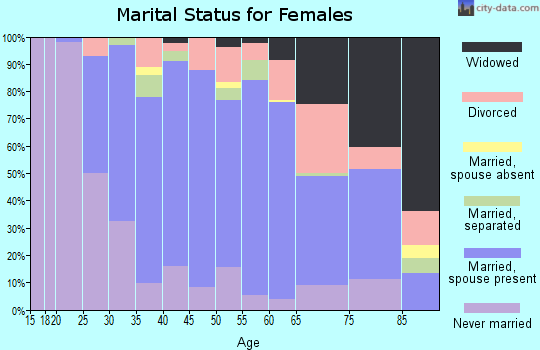
Women who had a birth in the past 12 months: 102 (75 now married, 27 unmarried) Women who did not have a birth in the past 12 months: 2,253 (1,014 now married, 1,234 unmarried)
Housing units in zip code 19475 with a mortgage: 2,399 (288 second mortgage, 259 both second mortgage and home equity loan) Houses without a mortgage: 61
Median monthly owner costs for units with a mortgage: $2,170 Median monthly owner costs for units without a mortgage: $807
Residents with income below the poverty level in 2022:
This zip code:
15.0%
Whole state:
11.8%
Residents with income below 50% of the poverty level in 2022:
This zip code:
5.5%
Whole state:
6.1%
Median number of rooms in houses and condos:
Here:
7.9
State:
6.8
Median number of rooms in apartments:
Here:
4.2
State:
4.3
Notable locations in this zip code not listed on our city pages
Notable locations in zip code 19475: Pennhurst Station (A), Royersford Station (B), Camp Innabah (C), Camp Sankanac (D), Cromby Industrial Park (E), Spring Hollow Golf Course (F), Kimberton Fish and Game Association (G), Liberty Steam Fire Company 1 (H), Southeast Veterans Administration (I), Pennhurst Fire Station (J), Pennhurst Police Station (K), Spring City Borough Hall (L), Spring City Library (M), Spring City Police Station (N), Spring Mill Station 45 Fire Station (O), Springford Rescue Center (P), Ridge Fire Company 1 (Q). Display/hide their locations on the map
Churches in zip code 19475 include: Vincent Church (A), Saint Vincent Church (B), Vincent Mennonite Church (C), United Christ Church (D), Parker Ford Baptist Church (E), Schuylkill Valley Baptist Church (F), Saint Joseph Catholic Churrch (G), East Vincent Church (H). Display/hide their locations on the map
Cemeteries: Brower Cemetery (1), Parker Ford Baptist Cemetery (2), Oak Grove Cemetery (3), Vincent Mennonite Cemetery (4). Display/hide their locations on the map
Parks in zip code 19475 include: Brown Street Neighborhood Park (1), State Game Lands Number 234 (2), Spring City Borough Park (3). Display/hide their locations on the map
1,656 married couples with children.
964 single-parent households (224 men, 740 women).
94.0% of residents of 19475 zip code speak English at home.
1.3% of residents speak Spanish at home (92% very well, 8% not well).
1.8% of residents speak other Indo-European language at home (91% very well, 9% well).
1.6% of residents speak Asian or Pacific Island language at home (88% very well, 12% well).
0.4% of residents speak other language at home (100% very well).
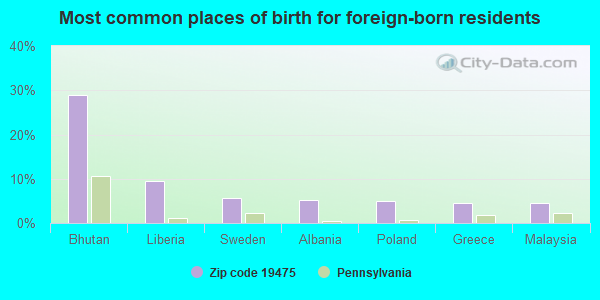
Foreign born population: 455 (3.9%) (43.9% of them are naturalized citizens)
This zip code:
3.9%
Whole state:
7.5%
29%Bhutan
9%Liberia
6%Sweden
5%Albania
5%Poland
5%Greece
5%Malaysia
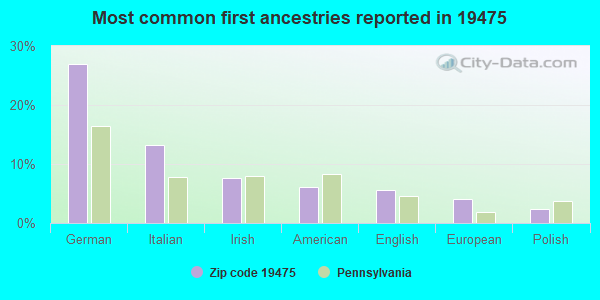
27%German
13%Italian
8%Irish
6%American
6%English
4%European
2%Polish
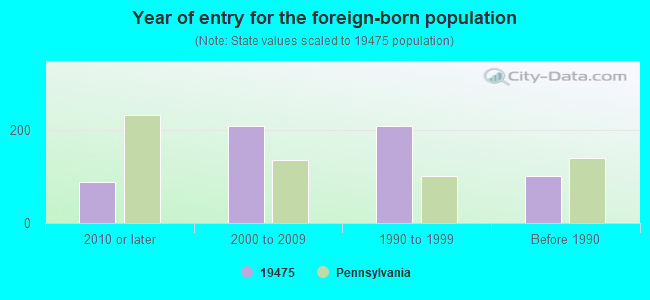
Year of entry for the foreign-born population
882010 or later
2092000 to 2009
2091990 to 1999
102Before 1990
Facilities with environmental interests located in this zip code:
3D CHESMONT COLLISION (711 SOUTH MAIN STREET in SPRING CITY, PA)
STATE MASTER (Pennsylvania database) - AFS-00-1200255-1, AIR PROGRAM Conditionally Exempt Small Quantity Generators, less than 100 kg/month of hazardous waste (Resource Conservation and Recovery Act (tracking hazardous waste)) - notification Business SIC classification: TOP, BODY, AND UPHOLSTERY REPAIR SHOPS AND PAINT SHOPS Business NAICS classification: AUTOMOTIVE BODY, PAINT, AND INTERIOR REPAIR AND MAINTENANCE. Organizations: OPERNAME (CONTACT/OPERATOR)
, NIESTROY DAVID (CONTACT/OWNER)
Alternative names: 3 D S CHESMONT COLLISION CTR, 3D CHESMONT COLLISION CENTER
ANTONIO & PAMELA LOGIOIA (2606 PHEASANT RUN LANE in SPRING CITY, PA)
National Pollutant Discharge Elimination System NON-MAJOR (Tracking pollutant discharge elimination systems) - permit Business SIC classification: OPERATORS OF DWELLINGS OTHER THAN APARTMENT BUILDINGS Alternative names: LOGIOIA, ANTONIO & PAMELA
ATLANTIC SERVICE STATION (3395 SCHUYLKILL RD in SPRING CITY, PA)
Small Quantity Generators, between 100 kg and 1000 kg of hazardous waste/month (Resource Conservation and Recovery Act (tracking hazardous waste)) - notification Organizations: OPERNAME (CONTACT/OPERATOR)
, ATLANTIC REFINING & MKT (CONTACT/OWNER)
Housing units lacking complete kitchen facilities: 1.6%
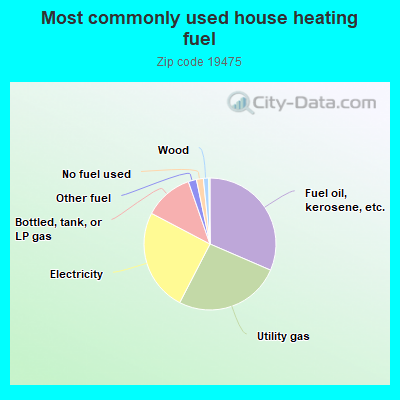
31.5%Fuel oil, kerosene, etc.
26.1%Utility gas
25.1%Electricity
12.0%Bottled, tank, or LP gas
2.0%Other fuel
1.7%No fuel used
1.3%Wood
Population in 1990: 7,988. Population change in the 1990s: +1,730 (+21.7%).
Place of birth for U.S.-born residents:
This state: 9,053
Northeast: 1,123
Midwest: 159
South: 631
West: 186
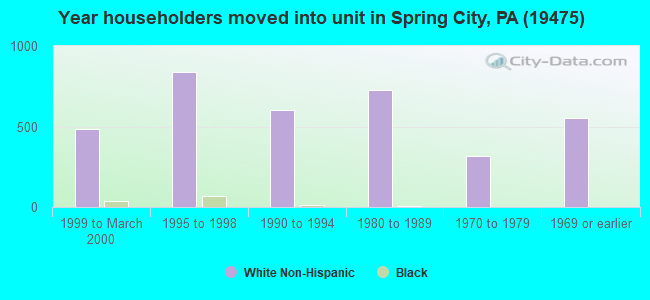
64% of the 19475 zip code residents lived in the same house 5 years ago. Out of people who lived in different houses, 42% lived in this county. Out of people who lived in different counties, 50% lived in Pennsylvania.
89% of the 19475 zip code residents lived in the same house 1 year ago. Out of people who lived in different houses, 52% moved from this county. Out of people who lived in different houses, 44% moved from different county within same state. Out of people who lived in different houses, 2% moved from different state.
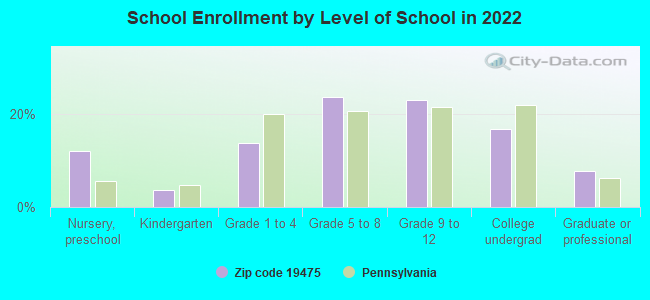
Private vs. public school enrollment:
Students in private schools in grades 1 to 8 (elementary and middle school): 94
Here:
9.3%
Pennsylvania:
15.7%
Students in private schools in grades 9 to 12 (high school): 64
Here:
10.4%
Pennsylvania:
13.4%
Students in private undergraduate colleges: 113
Here:
25.0%
Pennsylvania:
39.8%
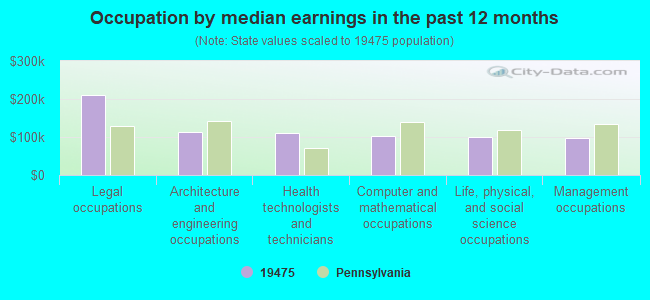
Occupation by median earnings in the past 12 months ($)
211,666Legal occupations
114,371Architecture and engineering occupations
109,571Health technologists and technicians
103,150Computer and mathematical occupations
98,708Life, physical, and social science occupations
96,232Management occupations
Companies with federal contracts located in this zip code:
HYDROMOTION INC (85 E BRIDGE ST in SPRING CITY, PA; small business) : $828,130 in 10 contractsfrom 2000 to 2006
Contracts for Valves, Powered by Defense Logistics Agency Signed by year:2000: $180,700; 2001: $86,250; 2002: $234,880; 2003: $0; 2004: $66,025; 2005: $182,975; 2006: $77,300.
Biggest contracts:
$180,700 with Defense Logistics Agency for Valves, Powered. Signed on 2000-10-29. Completion date: 2001-10-29.
$96,880, same as above.Signed on 2002-05-31. Completion date: 2002-08-02.
$90,350, same as above.Signed on 2005-01-10. Completion date: 2005-03-11.
$86,250, same as above.Signed on 2001-06-01. Completion date: 2001-09-06.
SPRING FORD INDUSTRIES (501 S MAIN STREET in SPRING CITY, PA) : $191,895 in 2 contractsin 2000
$99,000 with Defense Logistics Agency for Underwear and Nightwear, Men's. Signed on 2000-04-14. Completion date: 2000-07-11.
$92,895, same as above.Signed on 2000-11-02. Completion date: 2000-12-21.
AHB, LLC (303 S HAVERFIELD DRIVE in SPRING CITY, PA; small business) : $84,654 in 2 contractsin 2003
$51,540 with Navy for Fittings for Rope, Cable, and Chain. Signed on 2003-10-23. Completion date: 2003-12-03.
$33,114 with Air Force for Miscellaneous Engine Accessories, Nonaircraft. Signed on 2003-09-26. Completion date: 2003-11-10.
Top industries in this zip code by the number of employees in 2005:
2003 - 2018 National Fire Incident Reporting System (NFIRS) incidents
Based on the data from the years 2003 - 2018 the average number of fires per year is 41. The highest number of reported fire incidents - 72 took place in 2008, and the least - 11 in 2010. The data has a decreasing trend.
When looking into fire subcategories, the most incidents belonged to: Structure Fires (42.9%), and Outside Fires (34.3%).
Fire incident types reported to NFIRS in Zip Code 19475


 Nearest zip codes: 19457, 19442, 19468, 19460, 19465, 19425.
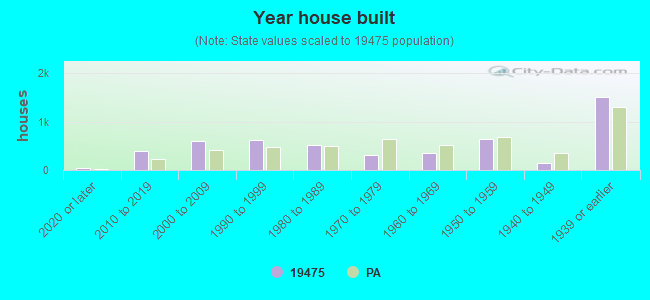


 Based on the data from the years 2003 - 2018 the average number of fires per year is 41. The highest number of reported fire incidents - 72 took place in 2008, and the least - 11 in 2010. The data has a decreasing trend.
 When looking into fire subcategories, the most incidents belonged to: Structure Fires (42.9%), and Outside Fires (34.3%).