Estimated zip code population in 2022: 40,597 Zip code population in 2010: 40,937 Zip code population in 2000: 40,106
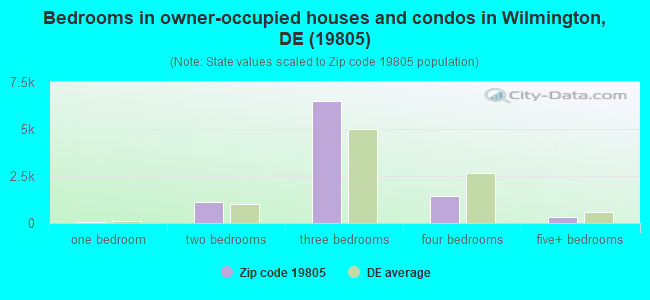
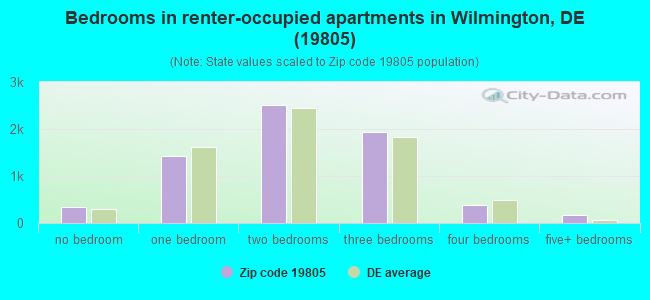
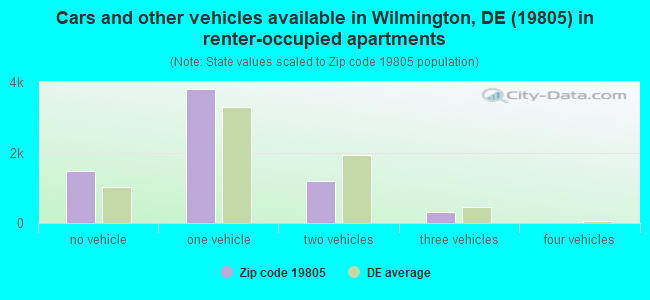
Houses and condos: 18,059 Renter-occupied apartments: 6,799
% of renters here:
42%
State:
26%
March 2022 cost of living index in zip code 19805: 101.9 (near average, U.S. average is 100)
Land area: 5.3 sq. mi. Water area: 0.0 sq. mi.
Population density: 7,632 people per square mile
(high).
OSM Map
General Map
Google Map
MSN Map
OSM Map
General Map
Google Map
MSN Map
OSM Map
General Map
Google Map
MSN Map
OSM Map
General Map
Google Map
MSN Map
Please wait while loading the map...
Real estate property taxes paid for housing units in 2022:
This zip code:
0.7% ($1,603)
Delaware:
0.5% ($1,635)
Median real estate property taxes paid for housing units with mortgages in 2022: $1,673 (0.7%) Median real estate property taxes paid for housing units with no mortgage in 2022: $1,395 (0.7%)
Averages for the 2020 tax year for zip code 19805, filed in 2021:
Average Adjusted Gross Income (AGI) in 2020: $44,698 (Individual Income Tax Returns)
Here:
$44,698
State:
$74,239
Salary/wage: $40,208 (reported on 88.0% of returns)
Here:
$40,208
State:
$59,982
(% of AGI for various income ranges: 1213.4% for AGIs below $25k, 3887.2% for AGIs $25k-50k, 7341.1% for AGIs $50k-75k, 10256.1% for AGIs $75k-100k, 18055.6% for AGIs $100k-200k, 75242.5% for AGIs over 200k)
Taxable interest for individuals: $1,148 (reported on 14.2% of returns)
This zip code:
$1,148
Delaware:
$1,604
(% of AGI for various income ranges: 6.4% for AGIs below $25k, 8.1% for AGIs $25k-50k, 13.6% for AGIs $50k-75k, 46.0% for AGIs $75k-100k, 76.6% for AGIs $100k-200k, 1448.8% for AGIs over 200k)
Ordinary dividends: $5,478 (reported on 8.4% of returns)
Here:
$5,478
State:
$8,303
(% of AGI for various income ranges: 6.0% for AGIs below $25k, 11.5% for AGIs $25k-50k, 31.3% for AGIs $50k-75k, 89.4% for AGIs $75k-100k, 251.5% for AGIs $100k-200k, 5873.8% for AGIs over 200k)
Net capital gain/loss in AGI: +$10,669 (reported on 7.0% of returns)
Here:
+$10,669
State:
+$19,461
(% of AGI for various income ranges: 1.7% for AGIs below $25k, 9.3% for AGIs $25k-50k, 35.4% for AGIs $50k-75k, 116.0% for AGIs $75k-100k, 382.9% for AGIs $100k-200k, 11735.0% for AGIs over 200k)
Profit/loss from business: +$7,717 (reported on 12.3% of returns)
Here:
+$7,717
State:
+$13,079
(% of AGI for various income ranges: 99.2% for AGIs below $25k, 94.4% for AGIs $25k-50k, 116.4% for AGIs $50k-75k, 166.6% for AGIs $75k-100k, 393.0% for AGIs $100k-200k, 1581.2% for AGIs over 200k)
Taxable individual retirement arrangement distribution: $16,200 (reported on 4.5% of returns)
19805:
$16,200
Delaware:
$22,095
(% of AGI for various income ranges: 19.5% for AGIs below $25k, 40.5% for AGIs $25k-50k, 126.1% for AGIs $50k-75k, 255.6% for AGIs $75k-100k, 538.6% for AGIs $100k-200k, 2840.0% for AGIs over 200k)
Self-employed (Keogh) retirement plans: $22,733 (reported on 0.2% of returns)
19805:
$22,733
Delaware:
$28,197
(% of AGI for various income ranges: 93.4% for AGIs $100k-200k)
Total itemized deductions: $25,975 (reported on 5.4% of returns)
Here:
$25,975
State:
$30,452
(% of AGI for various income ranges: 15.2% for AGIs below $25k, 65.9% for AGIs $25k-50k, 254.3% for AGIs $50k-75k, 484.2% for AGIs $75k-100k, 814.4% for AGIs $100k-200k, 9937.5% for AGIs over 200k)
Charity contributions: $5,899 (reported on 4.0% of returns)
Here:
$5,899
State:
$8,999
(% of AGI for various income ranges: 1.0% for AGIs below $25k, 10.1% for AGIs $25k-50k, 45.8% for AGIs $50k-75k, 59.5% for AGIs $75k-100k, 154.4% for AGIs $100k-200k, 1767.5% for AGIs over 200k)
Taxes paid: $6,967 (reported on 5.3% of returns)
19805:
$6,967
State:
$7,483
(% of AGI for various income ranges: 1.3% for AGIs below $25k, 11.9% for AGIs $25k-50k, 70.9% for AGIs $50k-75k, 193.5% for AGIs $75k-100k, 317.7% for AGIs $100k-200k, 1397.5% for AGIs over 200k)
Earned income credit: $2,439 (reported on 26.5% of returns)
Here:
$2,439
State:
$2,247
(% of AGI for various income ranges: 140.0% for AGIs below $25k, 83.3% for AGIs $25k-50k, 0.8% for AGIs $50k-75k)
Percentage of individuals using paid preparers for their 2020 taxes: 91.7%
Here:
92%
State:
92%
(% for various income ranges: 91.3% for AGIs below $25k, 92.3% for AGIs $25k-50k, 91.6% for AGIs $50k-75k, 91.9% for AGIs $75k-100k, 91.3% for AGIs $100k-200k, 92.3% for AGIs over 200k)
Averages for the 2012 tax year for zip code 19805, filed in 2013:
Average Adjusted Gross Income (AGI) in 2012: $39,305 (Individual Income Tax Returns)
Here:
$39,305
State:
$61,157
Salary/wage: $36,059 (reported on 89.8% of returns)
Here:
$36,059
State:
$50,642
(% of AGI for various income ranges: 80.2% for AGIs below $25k, 88.5% for AGIs $25k-50k, 84.5% for AGIs $50k-75k, 84.3% for AGIs $75k-100k, 82.3% for AGIs $100k-200k, 59.9% for AGIs over 200k)
Taxable interest for individuals: $961 (reported on 18.9% of returns)
This zip code:
$961
Delaware:
$1,571
(% of AGI for various income ranges: 0.6% for AGIs below $25k, 0.3% for AGIs $25k-50k, 0.4% for AGIs $50k-75k, 0.4% for AGIs $75k-100k, 0.6% for AGIs $100k-200k, 1.0% for AGIs over 200k)
Ordinary dividends: $4,232 (reported on 10.1% of returns)
Here:
$4,232
State:
$6,610
(% of AGI for various income ranges: 0.6% for AGIs below $25k, 0.4% for AGIs $25k-50k, 0.7% for AGIs $50k-75k, 0.7% for AGIs $75k-100k, 1.6% for AGIs $100k-200k, 4.6% for AGIs over 200k)
Net capital gain/loss in AGI: +$4,118 (reported on 6.6% of returns)
Here:
+$4,118
State:
+$11,439
(% of AGI for various income ranges: 0.1% for AGIs $25k-50k, 0.2% for AGIs $50k-75k, 0.3% for AGIs $75k-100k, 1.4% for AGIs $100k-200k, 3.9% for AGIs over 200k)
Profit/loss from business: +$9,637 (reported on 8.4% of returns)
Here:
+$9,637
State:
+$12,773
(% of AGI for various income ranges: 5.4% for AGIs below $25k, 1.5% for AGIs $25k-50k, 0.9% for AGIs $50k-75k, 0.9% for AGIs $75k-100k, 1.4% for AGIs $100k-200k, 3.5% for AGIs over 200k)
Taxable individual retirement arrangement distribution: $13,716 (reported on 5.7% of returns)
19805:
$13,716
Delaware:
$16,790
(% of AGI for various income ranges: 1.4% for AGIs below $25k, 1.1% for AGIs $25k-50k, 1.8% for AGIs $50k-75k, 2.4% for AGIs $75k-100k, 2.4% for AGIs $100k-200k, 4.9% for AGIs over 200k)
Self-employment retirement plans: $15,733 (reported on 0.2% of returns)
19805:
$15,733
Delaware:
$22,611
Total itemized deductions: $17,386 (21% of AGI, reported on 23.1% of returns)
Here:
$17,386
State:
$23,216
Here:
21.4% of AGI
State:
19.8% of AGI
(% of AGI for various income ranges: 3.6% for AGIs below $25k, 7.1% for AGIs $25k-50k, 12.2% for AGIs $50k-75k, 13.6% for AGIs $75k-100k, 14.7% for AGIs $100k-200k, 13.7% for AGIs over 200k)
Charity contributions: $2,673 (reported on 18.1% of returns)
Here:
$2,673
State:
$3,791
(% of AGI for various income ranges: 0.3% for AGIs below $25k, 0.8% for AGIs $25k-50k, 1.4% for AGIs $50k-75k, 1.5% for AGIs $75k-100k, 1.8% for AGIs $100k-200k, 2.5% for AGIs over 200k)
Taxes paid: $6,058 (reported on 22.7% of returns)
19805:
$6,058
State:
$8,129
(% of AGI for various income ranges: 0.5% for AGIs below $25k, 1.7% for AGIs $25k-50k, 3.7% for AGIs $50k-75k, 4.6% for AGIs $75k-100k, 6.1% for AGIs $100k-200k, 7.2% for AGIs over 200k)
Earned income credit: $2,383 (reported on 29.6% of returns)
Here:
$2,383
State:
$2,231
(% of AGI for various income ranges: 9.2% for AGIs below $25k, 1.4% for AGIs $25k-50k)
Percentage of individuals using paid preparers for their 2012 taxes: 44.9%
Here:
45%
State:
47%
(% for various income ranges: 43.1% for AGIs below $25k, 42.9% for AGIs $25k-50k, 47.1% for AGIs $50k-75k, 51.9% for AGIs $75k-100k, 56.2% for AGIs $100k-200k, 66.7% for AGIs over 200k)
Averages for the 2004 tax year for zip code 19805, filed in 2005:
Average Adjusted Gross Income (AGI) in 2004: $35,595 (Individual Income Tax Returns)
Here:
$35,595
State:
$54,038
Salary/wage: $32,192 (reported on 90.0% of returns)
Here:
$32,192
State:
$44,625
(% of AGI for various income ranges: 103.4% for AGIs below $10k, 82.4% for AGIs $10k-25k, 89.8% for AGIs $25k-50k, 86.3% for AGIs $50k-75k, 86.0% for AGIs $75k-100k, 59.7% for AGIs over 100k)
Taxable interest for individuals: $1,319 (reported on 28.1% of returns)
This zip code:
$1,319
Delaware:
$1,734
(% of AGI for various income ranges: 3.6% for AGIs below $10k, 1.4% for AGIs $10k-25k, 0.7% for AGIs $25k-50k, 0.9% for AGIs $50k-75k, 0.9% for AGIs $75k-100k, 1.3% for AGIs over 100k)
Taxable dividends: $2,197 (reported on 14.9% of returns)
Here:
$2,197
State:
$5,362
(% of AGI for various income ranges: 1.6% for AGIs below $10k, 0.7% for AGIs $10k-25k, 0.4% for AGIs $25k-50k, 0.7% for AGIs $50k-75k, 0.7% for AGIs $75k-100k, 2.1% for AGIs over 100k)
Net capital gain/loss: +$8,866 (reported on 9.5% of returns)
Here:
+$8,866
State:
+$17,328
(% of AGI for various income ranges: -0.8% for AGIs below $10k, 0.0% for AGIs $10k-25k, 0.1% for AGIs $25k-50k, 0.5% for AGIs $50k-75k, 1.0% for AGIs $75k-100k, 9.8% for AGIs over 100k)
Profit/loss from business: +$8,221 (reported on 7.4% of returns)
Here:
+$8,221
State:
+$12,191
(% of AGI for various income ranges: 3.7% for AGIs below $10k, 3.1% for AGIs $10k-25k, 1.2% for AGIs $25k-50k, 1.5% for AGIs $50k-75k, 0.7% for AGIs $75k-100k, 2.1% for AGIs over 100k)
IRA payment deduction: $2,344 (reported on 1.5% of returns)
19805:
$2,344
Delaware:
$3,027
(% of AGI for various income ranges: 0.1% for AGIs below $10k, 0.1% for AGIs $10k-25k, 0.1% for AGIs $25k-50k, 0.1% for AGIs $50k-75k, 0.1% for AGIs $75k-100k, 0.0% for AGIs over 100k)
Self-employed pension: $12,114 (reported on 0.3% of returns)
Here:
$12,114
Delaware:
$15,466
Total itemized deductions: $14,470 (21% of AGI, reported on 26.0% of returns)
Here:
$14,470
State:
$19,441
Here:
20.5% of AGI
State:
19.3% of AGI
(% of AGI for various income ranges: 4.7% for AGIs below $10k, 4.4% for AGIs $10k-25k, 9.8% for AGIs $25k-50k, 13.0% for AGIs $50k-75k, 13.9% for AGIs $75k-100k, 12.6% for AGIs over 100k)
Charity contributions deductions: $2,457 (3% of AGI, reported on 23.0% of returns)
Here:
$2,457
State:
$3,727
Here:
3.4% of AGI
State:
3.5% of AGI
(% of AGI for various income ranges: 0.4% for AGIs below $10k, 0.6% for AGIs $10k-25k, 1.2% for AGIs $25k-50k, 1.7% for AGIs $50k-75k, 2.0% for AGIs $75k-100k, 2.6% for AGIs over 100k)
Total tax: $5,392 (reported on 66.5% of returns)
19805:
$5,392
State:
$8,958
(% of AGI for various income ranges: 1.7% for AGIs below $10k, 3.2% for AGIs $10k-25k, 6.7% for AGIs $25k-50k, 10.0% for AGIs $50k-75k, 11.0% for AGIs $75k-100k, 19.9% for AGIs over 100k)
Earned income credit: $1,874 (reported on 26.2% of returns)
Here:
$1,874
State:
$1,733
Percentage of individuals using paid preparers for their 2004 taxes: 58.4%
Here:
58%
State:
55%
(% for various income ranges: 55.9% for AGIs below $10k, 61.9% for AGIs $10k-25k, 56.9% for AGIs $25k-50k, 56.0% for AGIs $50k-75k, 57.3% for AGIs $75k-100k, 63.6% for AGIs over 100k)
Likely homosexual households (counted as self-reported same-sex unmarried-partner households)
Lesbian couples: 0.0% of all households
Gay men: 0.4% of all households
Household received Food Stamps/SNAP in the past 12 months: 3,346 Household did not receive Food Stamps/SNAP in the past 12 months: 13,185
Women who had a birth in the past 12 months: 521 (262 now married, 240 unmarried) Women who did not have a birth in the past 12 months: 9,288 (2,809 now married, 6,407 unmarried)
Housing units in zip code 19805 with a mortgage: 6,781 (667 second mortgage, 14 home equity loan, 536 both second mortgage and home equity loan) Houses without a mortgage: 159
Median monthly owner costs for units with a mortgage: $1,361 Median monthly owner costs for units without a mortgage: $404
Residents with income below the poverty level in 2022:
This zip code:
18.7%
Whole state:
9.4%
Residents with income below 50% of the poverty level in 2022:
This zip code:
8.0%
Whole state:
4.6%
Median number of rooms in houses and condos:
Here:
6.2
State:
6.9
Median number of rooms in apartments:
Here:
4.8
State:
4.4
Notable locations in this zip code not listed on our city pages
Notable locations in zip code 19805: Barley Mill Plaza Professional Park (A), Elsmere Police Department (B), Elsmere Library (C), Elsmere Town Hall (D), Woodlawn Branch Library (E), Saint Anthonys Community Center (F), La Biblioteca del Pueblo Library (G), Latin American Community Center (H), New Castle County Detention Center (I), Elsmere Fire Company Number 1 (J), Wilmington Fire Department Station 6 (K). Display/hide their locations on the map
Shopping Centers: Canby Park Shopping Center (1), Chestnut Run Shopping Center (2), Lancaster Pike Market Shopping Center (3). Display/hide their locations on the map
Churches in zip code 19805 include: Saint Pauls Catholic Church (A), Wesleyan Church (B), Saint Hedwigs Roman Catholic Church (C), Be Ready Jesus is Coming Church (D), Peregrino Church of God (E), Evangelistic Temple of Truth (F), New Holiness Fellowship Church (G), Haven United Methodist Church (H), Saint Elizabeths Catholic Church (I). Display/hide their locations on the map
Cemeteries: Mount Olive Cemetery (1), Mount Zion Cemetery (2), Beth Emeth Cemetery (3), Cathedral Cemetery (4), Silverbrook Cemetery (5). Display/hide their locations on the map
Parks in zip code 19805 include: Brown Park (1), Canby Park (2), Clayton Park (3), Delamore Park (4), Woodlawn Park (5), Biden Park (6). Display/hide their locations on the map
Tourist attractions (not listed on the city page) : Ardiss International (Recreation Areas; 103 North Broom St), Psychic Dream Readings (Arcades & Amusements; 1505 2nd Avenue).
3,210 married couples with children.
4,687 single-parent households (1,133 men, 3,554 women).
78.7% of residents of 19805 zip code speak English at home.
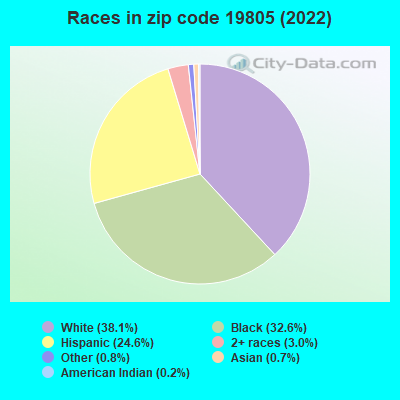
18.3% of residents speak Spanish at home (54% very well, 16% well, 24% not well, 6% not at all).
1.4% of residents speak other Indo-European language at home (100% very well).
0.5% of residents speak Asian or Pacific Island language at home (26% very well, 47% well, 18% not well, 9% not at all).
0.8% of residents speak other language at home (62% very well, 9% well, 29% not well).
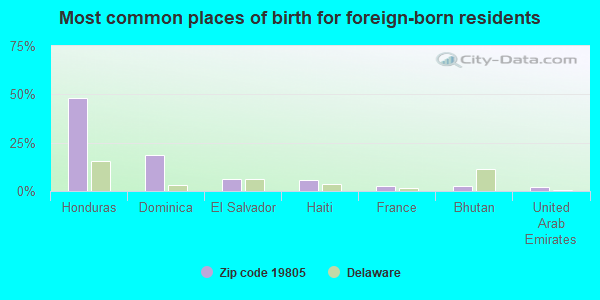
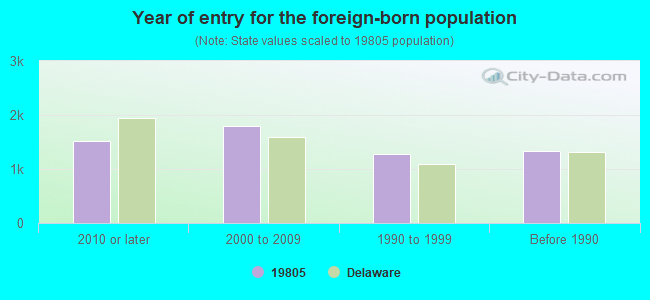
Foreign born population: 4,164 (10.3%) (50.3% of them are naturalized citizens)
Major facilities with environmental interests located in this zip code:
DUPONT CHESTNUT RUN (974 CENTRE ROAD in WILMINGTON, DE)
AIR MAJOR (AIRS/AFS) COMPLIANCE ACTIVITY (Tracking inspections of insecticide, fungicide, and rodenticide, and toxic substances) CRITERIA AND HAZARDOUS AIR POLLUTANT INVENTORY (Inventory of air pollution sources) HAZARDOUS WASTE BIENNIAL REPORTER (Resource Conservation and Recovery Act (tracking hazardous waste)) Large Quantity Generators, more that 1000 kg of hazardous waste/month (Resource Conservation and Recovery Act (tracking hazardous waste)) - notification TSD (Resource Conservation and Recovery Act (tracking hazardous waste)) - notification Business SIC classification: OPERATORS OF NONRESIDENTIAL BUILDINGS; TESTING LABORATORIES Organizations: EI DUPONT DE NEMOURS AND CO (CONTACT/OPERATOR)
Alternative names: CHESTNUT RUN PLAZA, DUPONT CO - CHESTNUT RUN PLAZA
VETERANS ADMINISTRATION HOSPITAL (1601 KIRKWOOD HIGHWAY in WILMINGTON, DE) . Federal Facility. DEPARTMENT OF VETERANS AFFAIRS
AIR MAJOR (AIRS/AFS) ENFORCEMENT/COMPLIANCE ACTIVITY (Integrated Compliance Information System) COMPLIANCE ACTIVITY (Tracking inspections of insecticide, fungicide, and rodenticide, and toxic substances) CRITERIA AND HAZARDOUS AIR POLLUTANT INVENTORY (Inventory of air pollution sources) Small Quantity Generators, between 100 kg and 1000 kg of hazardous waste/month (Resource Conservation and Recovery Act (tracking hazardous waste)) - notification Business SIC classification: GENERAL MEDICAL AND SURGICAL HOSPITALS Organizations: OPERNAME (CONTACT/OPERATOR)
, VETERANS ADMINSTRATION (CONTACT/OWNER)
Alternative names: DEPT. OF VETERANS AFFAIRS MEDICAL CENTER, V.A. HOSPITAL, VA MEDICAL CENTER
BAYARD ELEMENTARY SCHOOL (200 S. DUPONT ST in WILMINGTON, DE)
(Geographic Names Information System) (National Center for Education Statistics) - STATE ID-352 Organizations: CHRISTINA SCHOOL DISTRICT (SCHOOL DISTRICT)
AUSTIN D BALTZ ELEMENTARY SCHOOL (1500 SPRUCE AVENUE in WILMINGTON, DE)
(Geographic Names Information System) (National Center for Education Statistics) - STATE ID-252 Organizations: RED CLAY CONSOLIDATED SCHOOL DISTRICT (SCHOOL DISTRICT)
CASIMIR PULASKI ELEMENTARY SCHOOL (1300 CEDAR ST in WILMINGTON, DE)
(Geographic Names Information System) (National Center for Education Statistics) - STATE ID-358 Organizations: CHRISTINA SCHOOL DISTRICT (SCHOOL DISTRICT)
ZION KINDERGARTEN & PRE SCHOOL (2101 LANCASTER AVENUE in WILMINGTON, DE)
(Integrated Compliance Information System) - ICIS-03-1989-0552, FORMAL ENFORCEMENT ACTION COMPLIANCE ACTIVITY (Tracking inspections of insecticide, fungicide, and rodenticide, and toxic substances) Business SIC classification: CHILD DAY CARE SERVICES Alternative names: ZION KGN/PRE SCHOOL, ZION KINDERGARTEN/PRESCHOOL, ZION PRE-SCHOOL DAY CARE CTR
MCGEEHANS KINDERGARTEN/NURSRY (201 SMYRNA AVE in WILMINGTON, DE)
(Integrated Compliance Information System) - ICIS-03-1989-0539, FORMAL ENFORCEMENT ACTION COMPLIANCE ACTIVITY (Tracking inspections of insecticide, fungicide, and rodenticide, and toxic substances) Alternative names: MCGEEHAN'S KINDERGARTEN/NURSERY
DIAMOND STATE SALVAGE (702 E. 14TH STREET in WILMINGTON, DE)
SUPERFUND (Superfund database) (Integrated Compliance Information System) - ICIS-03-1996-0339, FORMAL ENFORCEMENT ACTION, ICIS-03-1997-0294, ENFORCEMENT/COMPLIANCE ACTIVITY Business SIC classification: SCRAP AND WASTE MATERIALS
ALTERNATIVE PROGRAMS (JOSEPH H. DOUGLASS SCHOOL in WILMINGTON, DE)
(National Center for Education Statistics) - STATE ID-537 Organizations: CHRISTINA SCHOOL DISTRICT (SCHOOL DISTRICT)
ST. FRANCIS HOSPITAL (7TH & DUPONT STREETS in WILMINGTON, DE)
AIR SYNTHETIC MINOR (AIRS/AFS) COMPLIANCE ACTIVITY (Tracking inspections of insecticide, fungicide, and rodenticide, and toxic substances) CRITERIA AND HAZARDOUS AIR POLLUTANT INVENTORY (Inventory of air pollution sources) Small Quantity Generators, between 100 kg and 1000 kg of hazardous waste/month (Resource Conservation and Recovery Act (tracking hazardous waste)) - notification Business SIC classification: GENERAL MEDICAL AND SURGICAL HOSPITALS Organizations: OPERNAME (CONTACT/OPERATOR)
, ST FRANCIS HOSPITAL (CONTACT/OWNER)
JOY CLEANERS (301 GREENHILL AVENUE in WILMINGTON, DE)
AIR MINOR (AIRS/AFS) Small Quantity Generators, between 100 kg and 1000 kg of hazardous waste/month (Resource Conservation and Recovery Act (tracking hazardous waste)) - notification Business SIC classification: DRYCLEANING PLANTS, EXCEPT RUG CLEANING Organizations: OPERNAME (CONTACT/OPERATOR)
, AMEY, HARRY (CONTACT/OWNER)
TONI CLEANERS (1606 KIRKWOOD HIGHWAY in WILMINGTON, DE)
AIR MINOR (AIRS/AFS) Conditionally Exempt Small Quantity Generators, less than 100 kg/month of hazardous waste (Resource Conservation and Recovery Act (tracking hazardous waste)) - notification Business SIC classification: DRYCLEANING PLANTS, EXCEPT RUG CLEANING Organizations: OPERNAME (CONTACT/OPERATOR)
, CHUNG CHONG (CONTACT/OWNER)
VOGUE CLEANER (BLUE SWAN, INC.) (1710 WEST 4TH STREET in WILMINGTON, DE)
AIR MINOR (AIRS/AFS) Small Quantity Generators, between 100 kg and 1000 kg of hazardous waste/month (Resource Conservation and Recovery Act (tracking hazardous waste)) - notification Business SIC classification: DRYCLEANING PLANTS, EXCEPT RUG CLEANING Organizations: OPERNAME (CONTACT/OPERATOR)
, OLIVERE, RON (CONTACT/OWNER)
Alternative names: BLUE SWAN INC
Housing units lacking complete plumbing facilities: 2.0% Housing units lacking complete kitchen facilities: 1.7%
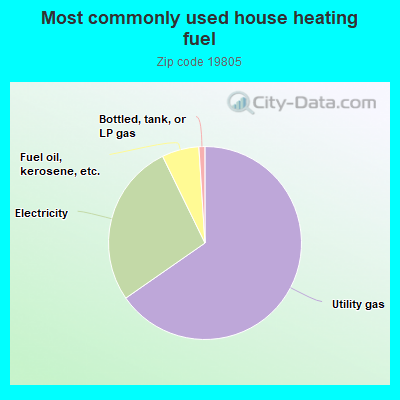
65.0%Utility gas
27.3%Electricity
6.2%Fuel oil, kerosene, etc.
1.0%Bottled, tank, or LP gas
Population in 1990: 40,087. Population change in the 1990s: +19 (+0.0%).
Place of birth for U.S.-born residents:
This state: 21,562
Northeast: 9,030
Midwest: 368
South: 2,916
West: 565
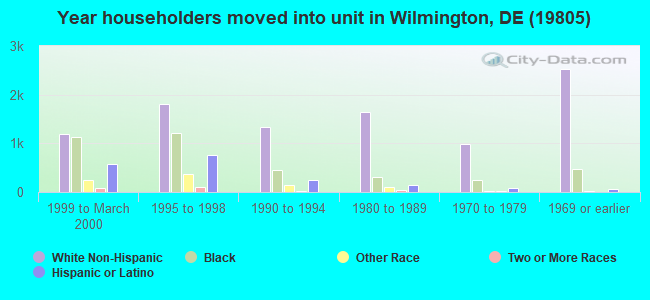
57% of the 19805 zip code residents lived in the same house 5 years ago. Out of people who lived in different houses, 78% lived in this county. Out of people who lived in different counties, 50% lived in Delaware.
88% of the 19805 zip code residents lived in the same house 1 year ago. Out of people who lived in different houses, 57% moved from this county. Out of people who lived in different houses, 6% moved from different county within same state. Out of people who lived in different houses, 31% moved from different state. Out of people who lived in different houses, 2% moved from abroad.
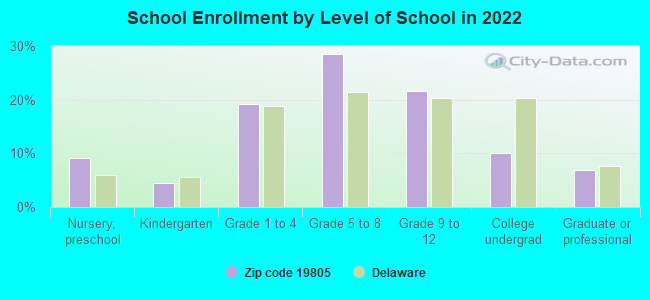
Private vs. public school enrollment:
Students in private schools in grades 1 to 8 (elementary and middle school): 380
Here:
8.0%
Delaware:
11.5%
Students in private schools in grades 9 to 12 (high school): 281
Here:
13.0%
Delaware:
12.1%
Students in private undergraduate colleges: 357
Here:
35.3%
Delaware:
19.2%
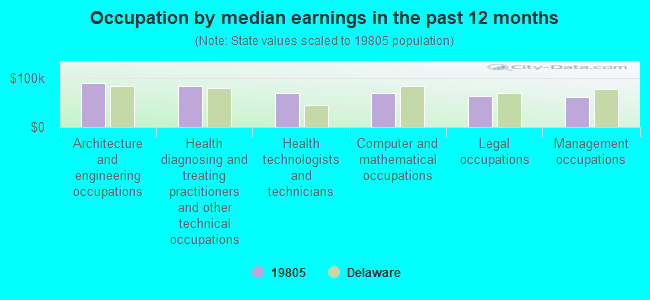
Occupation by median earnings in the past 12 months ($)
90,710Architecture and engineering occupations
85,366Health diagnosing and treating practitioners and other technical occupations
70,545Health technologists and technicians
70,484Computer and mathematical occupations
64,617Legal occupations
62,638Management occupations
Companies with federal contracts located in this zip code:
ST FRANCIS HOSPITAL INC (7TH & CLAYTON STS in WILMINGTON, DE) 1200 employees, $95893000 revenue: $117,000 in 4 contractsfrom 1999 to 2002
$44,000 with Department of Veterans Affairs for Radiology Services. Signed on 2001-12-15. Completion date: 2002-09-15.
$44,000, same as above.Signed on 1999-10-15. Completion date: 2000-09-15.
$29,000, same as above.Signed on 2002-10-15. Completion date: 2002-12-15.
$0, same as above.Signed on 2002-10-15. Completion date: 2002-12-15.
JDH CONSTRUCTION INC (1104 KIRKWOOD HWY in WILMINGTON, DE; small business)
$19,500 with Army for Lease or Rental of Facilities -- Restoration of real property. Taking place in MD. Signed on 2004-06-14. Completion date: 2004-06-25.
HANNA''S PHARMACEUTICAL SUPPLY (2505 W 6TH ST in WILMINGTON, DE; small business)
$7,858 with Uniformed Services University of the Health Sciences for Miscellaneous Items. Signed on 2005-09-07. Completion date: 2005-04-06.
Top industries in this zip code by the number of employees in 2005:
Wholesale Trade: Other Chemical and Allied Products Merchant Wholesalers (over 1000 employees: 1 establishment, 1-4 employees: 2 establishments)
Health Care and Social Assistance: General Medical and Surgical Hospitals (500-999: 2)
Health Care and Social Assistance: Nursing Care Facilities (100-249: 3, 1-4: 3)
Professional, Scientific, and Technical Services: Research and Development in the Physical, Engineering, and Life Sciences (250-499: 1, 50-99: 1)
Construction: Commercial and Institutional Building Construction (100-249: 2, 20-49: 1, 5-9: 2, 1-4: 2)
Other Services (except Public Administration): Religious Organizations (100-249: 1, 50-99: 1, 20-49: 2, 10-19: 2, 5-9: 2, 1-4: 2)
2002 - 2018 National Fire Incident Reporting System (NFIRS) incidents
Based on the data from the years 2002 - 2018 the average number of fires per year is 295. The highest number of reported fires - 418 took place in 2007, and the least - 145 in 2013. The data has an increasing trend.
When looking into fire subcategories, the most incidents belonged to: Structure Fires (70.9%), and Outside Fires (19.3%).
Fire incident types reported to NFIRS in Zip Code 19805


 Nearest zip codes: 19806, 19804, 19732, 19710, 19801, 19807.


 Based on the data from the years 2002 - 2018 the average number of fires per year is 295. The highest number of reported fires - 418 took place in 2007, and the least - 145 in 2013. The data has an increasing trend.
 When looking into fire subcategories, the most incidents belonged to: Structure Fires (70.9%), and Outside Fires (19.3%).