Estimated zip code population in 2022: 32,312 Zip code population in 2010: 30,138 Zip code population in 2000: 28,772
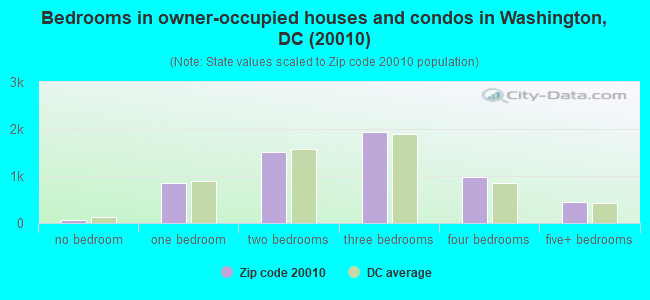
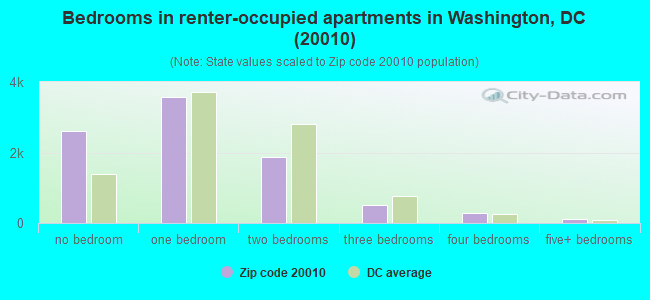
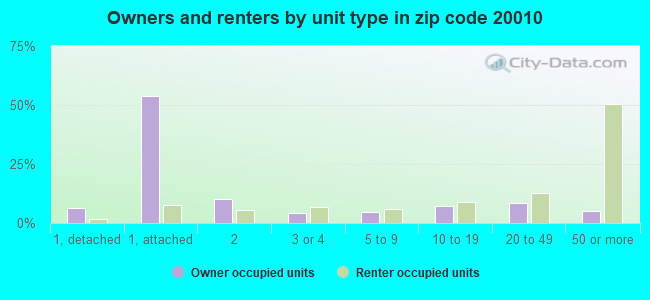
Houses and condos: 16,287 Renter-occupied apartments: 9,124
% of renters here:
61%
State:
59%
March 2022 cost of living index in zip code 20010: 121.6 (high, U.S. average is 100)
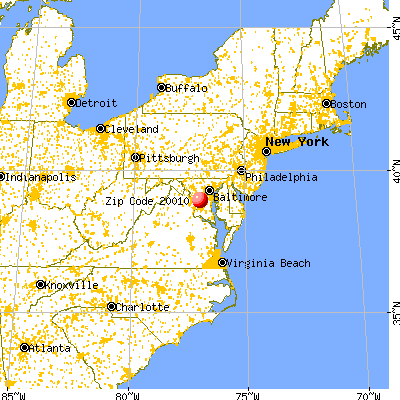
Land area: 1.1 sq. mi. Water area: 0.0 sq. mi.
Population density: 29,843 people per square mile
(very high).
OSM Map
General Map
Google Map
MSN Map
OSM Map
General Map
Google Map
MSN Map
OSM Map
General Map
Google Map
MSN Map
OSM Map
General Map
Google Map
MSN Map
Please wait while loading the map...
Real estate property taxes paid for housing units in 2022:
This zip code:
0.6% ($4,826)
District of Columbia:
0.6% ($4,114)
Median real estate property taxes paid for housing units with mortgages in 2022: $4,896 (0.6%) Median real estate property taxes paid for housing units with no mortgage in 2022: $3,914 (0.5%)
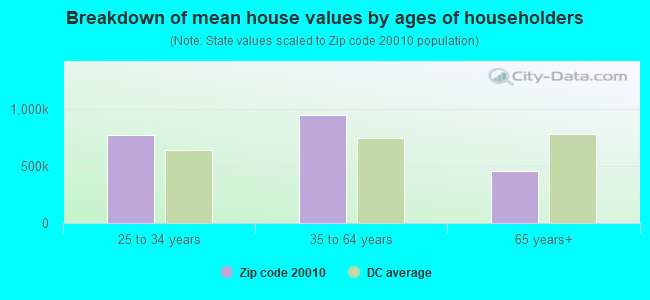
Estimated median house/condo value in 2022: $824,573
20010:
$824,573
District of Columbia:
$711,100
According to our research of District of Columbia and other state lists, there were 27 registered sex offenders living in 20010 zip code as of April 27, 2024. The ratio of all residents to sex offenders in zip code 20010 is 1,218 to 1. The ratio of registered sex offenders to all residents in this zip code is lower than the state average.
Median resident age:
This zip code:
32.5 years
District of Columbia median age:
34.9 years
Average household size:
This zip code:
2.1 people
District of Columbia:
1.9 people
Averages for the 2020 tax year for zip code 20010, filed in 2021:
Average Adjusted Gross Income (AGI) in 2020: $82,094 (Individual Income Tax Returns)
Here:
$82,094
State:
$115,481
Salary/wage: $75,632 (reported on 88.8% of returns)
Here:
$75,632
State:
$91,123
(% of AGI for various income ranges: 1295.2% for AGIs below $25k, 4064.4% for AGIs $25k-50k, 7763.5% for AGIs $50k-75k, 11749.0% for AGIs $75k-100k, 20384.1% for AGIs $100k-200k, 80573.3% for AGIs over 200k)
Taxable interest for individuals: $818 (reported on 28.7% of returns)
This zip code:
$818
District of Columbia:
$2,372
(% of AGI for various income ranges: 3.9% for AGIs below $25k, 6.1% for AGIs $25k-50k, 15.5% for AGIs $50k-75k, 23.6% for AGIs $75k-100k, 60.0% for AGIs $100k-200k, 474.9% for AGIs over 200k)
Ordinary dividends: $4,428 (reported on 23.4% of returns)
Here:
$4,428
State:
$11,383
(% of AGI for various income ranges: 11.6% for AGIs below $25k, 20.5% for AGIs $25k-50k, 44.5% for AGIs $50k-75k, 96.6% for AGIs $75k-100k, 249.5% for AGIs $100k-200k, 2361.8% for AGIs over 200k)
Net capital gain/loss in AGI: +$16,497 (reported on 21.0% of returns)
Here:
+$16,497
State:
+$37,778
(% of AGI for various income ranges: 12.6% for AGIs below $25k, 33.7% for AGIs $25k-50k, 53.5% for AGIs $50k-75k, 113.1% for AGIs $75k-100k, 464.1% for AGIs $100k-200k, 10373.5% for AGIs over 200k)
Profit/loss from business: +$16,226 (reported on 18.7% of returns)
Here:
+$16,226
State:
+$22,231
(% of AGI for various income ranges: 228.7% for AGIs below $25k, 181.6% for AGIs $25k-50k, 180.7% for AGIs $50k-75k, 309.0% for AGIs $75k-100k, 763.6% for AGIs $100k-200k, 4447.8% for AGIs over 200k)
Taxable individual retirement arrangement distribution: $18,127 (reported on 2.9% of returns)
20010:
$18,127
District of Columbia:
$28,122
(% of AGI for various income ranges: 10.6% for AGIs below $25k, 19.3% for AGIs $25k-50k, 34.5% for AGIs $50k-75k, 76.2% for AGIs $75k-100k, 212.9% for AGIs $100k-200k, 687.8% for AGIs over 200k)
Self-employed (Keogh) retirement plans: $27,465 (reported on 1.1% of returns)
20010:
$27,465
District of Columbia:
$39,370
(% of AGI for various income ranges: 14.1% for AGIs $25k-50k, 71.6% for AGIs $100k-200k, 812.2% for AGIs over 200k)
Total itemized deductions: $29,130 (reported on 15.6% of returns)
Here:
$29,130
State:
$36,798
(% of AGI for various income ranges: 43.7% for AGIs below $25k, 136.9% for AGIs $25k-50k, 249.4% for AGIs $50k-75k, 715.7% for AGIs $75k-100k, 1841.0% for AGIs $100k-200k, 6810.2% for AGIs over 200k)
Charity contributions: $6,110 (reported on 12.3% of returns)
Here:
$6,110
State:
$12,983
(% of AGI for various income ranges: 4.7% for AGIs below $25k, 29.1% for AGIs $25k-50k, 53.6% for AGIs $50k-75k, 102.8% for AGIs $75k-100k, 222.8% for AGIs $100k-200k, 1326.7% for AGIs over 200k)
Taxes paid: $8,644 (reported on 15.6% of returns)
20010:
$8,644
State:
$8,470
(% of AGI for various income ranges: 9.9% for AGIs below $25k, 31.2% for AGIs $25k-50k, 66.4% for AGIs $50k-75k, 230.2% for AGIs $75k-100k, 634.1% for AGIs $100k-200k, 1828.4% for AGIs over 200k)
Earned income credit: $1,909 (reported on 11.4% of returns)
Here:
$1,909
State:
$2,144
(% of AGI for various income ranges: 86.2% for AGIs below $25k, 38.1% for AGIs $25k-50k)
Percentage of individuals using paid preparers for their 2020 taxes: 90.6%
Here:
91%
State:
91%
(% for various income ranges: 85.3% for AGIs below $25k, 89.8% for AGIs $25k-50k, 93.6% for AGIs $50k-75k, 93.1% for AGIs $75k-100k, 92.8% for AGIs $100k-200k, 95.8% for AGIs over 200k)
Averages for the 2012 tax year for zip code 20010, filed in 2013:
Average Adjusted Gross Income (AGI) in 2012: $53,912 (Individual Income Tax Returns)
Here:
$53,912
State:
$85,963
Salary/wage: $51,638 (reported on 90.1% of returns)
Here:
$51,638
State:
$68,630
(% of AGI for various income ranges: 83.2% for AGIs below $25k, 91.9% for AGIs $25k-50k, 92.2% for AGIs $50k-75k, 90.1% for AGIs $75k-100k, 87.5% for AGIs $100k-200k, 71.4% for AGIs over 200k)
Taxable interest for individuals: $579 (reported on 26.1% of returns)
This zip code:
$579
District of Columbia:
$2,095
(% of AGI for various income ranges: 0.2% for AGIs below $25k, 0.1% for AGIs $25k-50k, 0.2% for AGIs $50k-75k, 0.4% for AGIs $75k-100k, 0.3% for AGIs $100k-200k, 0.4% for AGIs over 200k)
Ordinary dividends: $3,558 (reported on 16.8% of returns)
Here:
$3,558
State:
$12,032
(% of AGI for various income ranges: 1.0% for AGIs below $25k, 0.4% for AGIs $25k-50k, 1.0% for AGIs $50k-75k, 1.1% for AGIs $75k-100k, 1.1% for AGIs $100k-200k, 2.1% for AGIs over 200k)
Net capital gain/loss in AGI: +$7,496 (reported on 12.8% of returns)
Here:
+$7,496
State:
+$29,160
(% of AGI for various income ranges: 0.1% for AGIs $25k-50k, 0.6% for AGIs $50k-75k, 0.9% for AGIs $75k-100k, 1.2% for AGIs $100k-200k, 6.9% for AGIs over 200k)
Profit/loss from business: +$12,346 (reported on 16.4% of returns)
Here:
+$12,346
State:
+$21,205
(% of AGI for various income ranges: 10.7% for AGIs below $25k, 2.9% for AGIs $25k-50k, 2.1% for AGIs $50k-75k, 2.4% for AGIs $75k-100k, 3.5% for AGIs $100k-200k, 4.4% for AGIs over 200k)
Taxable individual retirement arrangement distribution: $14,046 (reported on 2.7% of returns)
20010:
$14,046
District of Columbia:
$24,847
(% of AGI for various income ranges: 0.6% for AGIs below $25k, 0.4% for AGIs $25k-50k, 0.4% for AGIs $50k-75k, 0.6% for AGIs $75k-100k, 0.9% for AGIs $100k-200k, 1.2% for AGIs over 200k)
Self-employment retirement plans: $16,306 (reported on 0.9% of returns)
20010:
$16,306
District of Columbia:
$33,749
(% of AGI for various income ranges: 0.2% for AGIs below $25k, 0.2% for AGIs $50k-75k, 0.3% for AGIs $100k-200k, 0.8% for AGIs over 200k)
Total itemized deductions: $21,109 (22% of AGI, reported on 33.2% of returns)
Here:
$21,109
State:
$33,550
Here:
21.9% of AGI
State:
20.5% of AGI
(% of AGI for various income ranges: 8.6% for AGIs below $25k, 11.0% for AGIs $25k-50k, 9.6% for AGIs $50k-75k, 13.7% for AGIs $75k-100k, 17.2% for AGIs $100k-200k, 15.0% for AGIs over 200k)
Charity contributions: $2,757 (reported on 25.6% of returns)
Here:
$2,757
State:
$6,251
(% of AGI for various income ranges: 0.7% for AGIs below $25k, 1.2% for AGIs $25k-50k, 1.3% for AGIs $50k-75k, 1.6% for AGIs $75k-100k, 1.4% for AGIs $100k-200k, 1.4% for AGIs over 200k)
Taxes paid: $7,982 (reported on 33.1% of returns)
20010:
$7,982
State:
$14,283
(% of AGI for various income ranges: 1.3% for AGIs below $25k, 2.0% for AGIs $25k-50k, 2.8% for AGIs $50k-75k, 5.5% for AGIs $75k-100k, 7.7% for AGIs $100k-200k, 8.1% for AGIs over 200k)
Earned income credit: $1,928 (reported on 14.8% of returns)
Here:
$1,928
State:
$2,233
(% of AGI for various income ranges: 5.0% for AGIs below $25k, 0.5% for AGIs $25k-50k)
Percentage of individuals using paid preparers for their 2012 taxes: 45.1%
Here:
45%
State:
47%
(% for various income ranges: 51.9% for AGIs below $25k, 43.5% for AGIs $25k-50k, 34.8% for AGIs $50k-75k, 37.5% for AGIs $75k-100k, 43.3% for AGIs $100k-200k, 63.2% for AGIs over 200k)
Averages for the 2004 tax year for zip code 20010, filed in 2005:
Average Adjusted Gross Income (AGI) in 2004: $36,556 (Individual Income Tax Returns)
Here:
$36,556
State:
$64,660
Salary/wage: $35,210 (reported on 90.1% of returns)
Here:
$35,210
State:
$51,773
(% of AGI for various income ranges: 98.1% for AGIs below $10k, 88.7% for AGIs $10k-25k, 92.1% for AGIs $25k-50k, 89.2% for AGIs $50k-75k, 88.2% for AGIs $75k-100k, 76.3% for AGIs over 100k)
Taxable interest for individuals: $656 (reported on 28.0% of returns)
This zip code:
$656
District of Columbia:
$2,287
(% of AGI for various income ranges: 1.0% for AGIs below $10k, 0.4% for AGIs $10k-25k, 0.3% for AGIs $25k-50k, 0.6% for AGIs $50k-75k, 0.6% for AGIs $75k-100k, 0.7% for AGIs over 100k)
Taxable dividends: $2,372 (reported on 12.7% of returns)
Here:
$2,372
State:
$7,977
(% of AGI for various income ranges: 1.9% for AGIs below $10k, 0.3% for AGIs $10k-25k, 0.3% for AGIs $25k-50k, 0.6% for AGIs $50k-75k, 1.0% for AGIs $75k-100k, 1.7% for AGIs over 100k)
Net capital gain/loss: +$5,345 (reported on 10.1% of returns)
Here:
+$5,345
State:
+$33,330
(% of AGI for various income ranges: 0.1% for AGIs below $10k, 0.2% for AGIs $10k-25k, 0.2% for AGIs $25k-50k, 0.3% for AGIs $50k-75k, 1.4% for AGIs $75k-100k, 4.6% for AGIs over 100k)
Profit/loss from business: +$10,194 (reported on 14.5% of returns)
Here:
+$10,194
State:
+$18,695
(% of AGI for various income ranges: 18.2% for AGIs below $10k, 4.5% for AGIs $10k-25k, 2.0% for AGIs $25k-50k, 2.8% for AGIs $50k-75k, 3.8% for AGIs $75k-100k, 5.9% for AGIs over 100k)
IRA payment deduction: $2,276 (reported on 1.7% of returns)
20010:
$2,276
District of Columbia:
$2,548
(% of AGI for various income ranges: 0.1% for AGIs $10k-25k, 0.2% for AGIs $25k-50k, 0.1% for AGIs $50k-75k, 0.1% for AGIs $75k-100k, 0.1% for AGIs over 100k)
Self-employed pension: $15,590 (reported on 1.0% of returns)
Here:
$15,590
District of Columbia:
$24,328
(% of AGI for various income ranges: 0.0% for AGIs $10k-25k, 0.1% for AGIs $25k-50k, 0.2% for AGIs $50k-75k, 0.5% for AGIs $75k-100k, 1.2% for AGIs over 100k)
Total itemized deductions: $17,204 (27% of AGI, reported on 35.1% of returns)
Here:
$17,204
State:
$26,296
Here:
27.1% of AGI
State:
21.9% of AGI
(% of AGI for various income ranges: 7.4% for AGIs below $10k, 11.7% for AGIs $10k-25k, 14.5% for AGIs $25k-50k, 19.8% for AGIs $50k-75k, 21.8% for AGIs $75k-100k, 18.5% for AGIs over 100k)
Charity contributions deductions: $2,781 (4% of AGI, reported on 29.2% of returns)
Here:
$2,781
State:
$6,415
Here:
4.2% of AGI
State:
5.1% of AGI
(% of AGI for various income ranges: 0.4% for AGIs below $10k, 1.2% for AGIs $10k-25k, 2.2% for AGIs $25k-50k, 2.9% for AGIs $50k-75k, 2.5% for AGIs $75k-100k, 2.5% for AGIs over 100k)
Total tax: $5,255 (reported on 74.7% of returns)
20010:
$5,255
State:
$13,545
(% of AGI for various income ranges: 3.7% for AGIs below $10k, 4.1% for AGIs $10k-25k, 7.4% for AGIs $25k-50k, 10.9% for AGIs $50k-75k, 12.8% for AGIs $75k-100k, 18.3% for AGIs over 100k)
Earned income credit: $1,621 (reported on 21.7% of returns)
Here:
$1,621
State:
$1,722
Percentage of individuals using paid preparers for their 2004 taxes: 57.9%
Here:
58%
State:
55%
(% for various income ranges: 60.0% for AGIs below $10k, 65.0% for AGIs $10k-25k, 54.1% for AGIs $25k-50k, 50.1% for AGIs $50k-75k, 46.4% for AGIs $75k-100k, 55.7% for AGIs over 100k)
Likely homosexual households (counted as self-reported same-sex unmarried-partner households)
Lesbian couples: 0.0% of all households
Gay men: 0.8% of all households
Household received Food Stamps/SNAP in the past 12 months: 1,647 Household did not receive Food Stamps/SNAP in the past 12 months: 13,238
Women who had a birth in the past 12 months: 501 (258 now married, 240 unmarried) Women who did not have a birth in the past 12 months: 9,305 (2,606 now married, 6,700 unmarried)
Housing units in zip code 20010 with a mortgage: 4,651 (561 second mortgage, 76 home equity loan, 432 both second mortgage and home equity loan) Houses without a mortgage: 139
Median monthly owner costs for units with a mortgage: $3,076 Median monthly owner costs for units without a mortgage: $738
Residents with income below the poverty level in 2022:
This zip code:
13.1%
Whole state:
13.3%
Residents with income below 50% of the poverty level in 2022:
This zip code:
5.7%
Whole state:
5.3%
Median number of rooms in houses and condos:
Here:
5.7
State:
5.9
Median number of rooms in apartments:
Here:
2.7
State:
3.2
Notable locations in this zip code not listed on our city pages
Notable locations in zip code 20010: Georgia Avenue-Petworth Metro Station (A), Tiny Tots Day Care Nursery (B), Stoddard Baptist Nursing Home (C), Spanish Catholic Center (D), Rosemont Center (E), Park Road South Side Historical Buildings (F), Kids Place Bilingual Child Development Center (G), Gap Community Child Care Center (H), Charles Kraemer House (I), Canaan Baptist Church Coalition for the Homeless (J), Bell Teen Parent and Child Development Center (K), Barbara Chambers Childrens Center (L), Adams House (M), District of Columbia Fire and Emergency Medical Services Engine Company 11 (N), Bancroft Recreation Center (O), Tenth Precinct Station House (P), Maxwell Woodhull House (Q), Riggs-Tompkins Building (R), Ingleside (S), Eighteen Hundred Block Park Road Buildings (T). Display/hide their locations on the map
Churches in zip code 20010 include: Mount Rona Missionary Baptist Church (A), Columbia Heights Christian Church (B), First Reformed Church (C), Francis Asbury Methodist Church (D), Shrine of the Sacred Heart Catholic Church (E), Sacred Heart Church (F), First Church of Christ Scientist (G), Fourth Church of Christ Scientist (H), Canaan Baptist Church (I). Display/hide their locations on the map
Parks in zip code 20010 include: Guglielmo Marconi Statue (1), James Cardinal Gibbons Statue (2), Parkview Recreation Center (3), Bancroft Playground (4), Raymond Playground (5), Powell Recreation Center (6), Cardinal James Gibbons Statue (7), Parkview Playground (8), Raymond Recreation Center (9). Display/hide their locations on the map
Tourist attractions (not listed on the city page) : Powhatan Museum (1519 Monroe Street Northwest), AccuTravel- Incorporated (Tourism Consultants; 3527 16th Street Northwest), Bernadette Tours (Tours & Charters; 506 Irving Street Northwest).
3,072 married couples with children.
2,719 single-parent households (181 men, 2,538 women).
61.8% of residents of 20010 zip code speak English at home.
28.8% of residents speak Spanish at home (66% very well, 13% well, 17% not well, 5% not at all).
4.4% of residents speak other Indo-European language at home (96% very well, 4% well).
3.3% of residents speak Asian or Pacific Island language at home (63% very well, 21% well, 16% not well).
2.9% of residents speak other language at home (55% very well, 27% well, 18% not well).
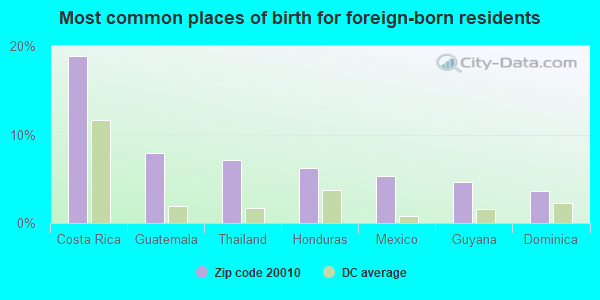
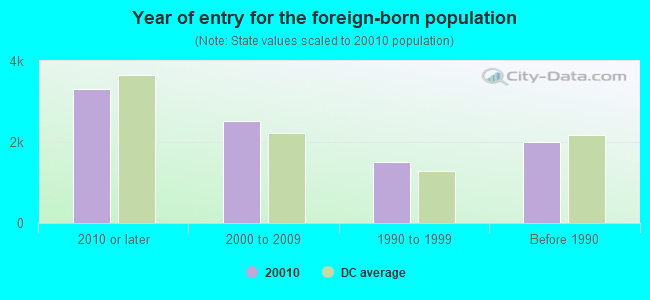
Foreign born population: 8,809 (27.3%) (45.7% of them are naturalized citizens)
Major facilities with environmental interests located in this zip code:
LINCOLN JUNIOR HIGH SCHOOL (3101 16TH ST NW in WASHINGTON, DC)
(Geographic Names Information System) (National Center for Education Statistics) - STATE ID-4609 Conditionally Exempt Small Quantity Generators, less than 100 kg/month of hazardous waste (Resource Conservation and Recovery Act (tracking hazardous waste)) - notification Organizations: OPERNAME (CONTACT/OPERATOR)
, D C GOVERNMENT (CONTACT/OWNER)
, DISTRICT OF COLUMBIA PUB SCHLS (SCHOOL DISTRICT)
Alternative names: LINCOLN J H S, LINCOLN MIDDLE SCHOOL
WASHINGTON HOSPITAL CENTER (110 IRVING STREET, NW in WASHINGTON, DC)
AIR MAJOR (AIRS/AFS) (Integrated Compliance Information System) - ICIS-03-2000-0614, FORMAL ENFORCEMENT ACTION, ICIS-03-2000-0618, Conditionally Exempt Small Quantity Generators, less than 100 kg/month of hazardous waste (Resource Conservation and Recovery Act (tracking hazardous waste)) HAZARDOUS WASTE BIENNIAL REPORTER (Resource Conservation and Recovery Act (tracking hazardous waste)) Business SIC classification: SKILLED NURSING CARE FACILITIES; GENERAL MEDICAL AND SURGICAL HOSPITALS; HOME HEALTH CARE SERVICES; MANAGEMENT SERVICES
NATIONAL HOUSE (770 PARK ROAD NW in WASHINGTON, DC)
(Integrated Compliance Information System) - ICIS-03-1990-0262, FORMAL ENFORCEMENT ACTION, ICIS-03-1989-0554, ICIS-03-1993-0116, COMPLIANCE ACTIVITY (Tracking inspections of insecticide, fungicide, and rodenticide, and toxic substances) Alternative names: NATIONAL HOUSE SCHOOL
BANCROFT ELEMENTARY SCHOOL (1755 NEWTON ST NW in WASHINGTON, DC)
(Geographic Names Information System) (National Center for Education Statistics) - STATE ID-5060 Organizations: DISTRICT OF COLUMBIA PUB SCHLS (SCHOOL DISTRICT)
FRENCH'S DRY CLEANERS (3706 14TH STREET, N. W. in WASHINGTON, DC)
AIR MINOR (AIRS/AFS) Conditionally Exempt Small Quantity Generators, less than 100 kg/month of hazardous waste (Resource Conservation and Recovery Act (tracking hazardous waste)) - notification HAZARDOUS WASTE BIENNIAL REPORTER (Resource Conservation and Recovery Act (tracking hazardous waste)) Business SIC classification: DRYCLEANING PLANTS, EXCEPT RUG CLEANING Organizations: OPERNAME (CONTACT/OPERATOR)
, BONG H YU (CONTACT/OPERATOR)
, KYONG & YOUNG INC (CONTACT/OWNER)
Alternative names: KYONG & YOUNG INC
PARK VIEW ELEMENTARY SCHOOL (3560 WARDER ST NW in WASHINGTON, DC)
(Geographic Names Information System) (National Center for Education Statistics) - STATE ID-5712 Organizations: DISTRICT OF COLUMBIA PUB SCHLS (SCHOOL DISTRICT)
RAYMOND ELEMENTARY SCHOOL (915 SPRING RD NW in WASHINGTON, DC)
(Geographic Names Information System) (National Center for Education Statistics) - STATE ID-5764 Organizations: DISTRICT OF COLUMBIA PUB SCHLS (SCHOOL DISTRICT)
TUBMAN ELEMENTARY SCHOOL (3101 13TH ST NW in WASHINGTON, DC)
(Geographic Names Information System) (National Center for Education Statistics) - STATE ID-5895 Organizations: DISTRICT OF COLUMBIA PUB SCHLS (SCHOOL DISTRICT)
BELL HIGH SCHOOL (3145 HIATT PL NW in WASHINGTON, DC)
(National Center for Education Statistics) - STATE ID-3080 Organizations: DISTRICT OF COLUMBIA PUB SCHLS (SCHOOL DISTRICT)
ELSIE WHITLOW STOKES COMMUNITY FREEDOM PCS (3220 16TH STREET, NW in WASHINGTON, DC)
(National Center for Education Statistics) - STATE ID-6009 Organizations: ELSIE WHITLOW STOKES COMMUNITY FREEDOM PCS AGY (SCHOOL DISTRICT)
FOR SISTER AND FOR BROTHER (1470 IRVING ST NW in WASHINGTON, DC)
(Integrated Compliance Information System) - ICIS-03-1989-0553, FORMAL ENFORCEMENT ACTION COMPLIANCE ACTIVITY (Tracking inspections of insecticide, fungicide, and rodenticide, and toxic substances)
PARK ROAD CLEANERS (1352 PARK ROAD NORTHWEST in WASHINGTON, DC)
AIR MINOR (AIRS/AFS) (Resource Conservation and Recovery Act (tracking hazardous waste)) Business SIC classification: DRYCLEANING PLANTS, EXCEPT RUG CLEANING Organizations: OPERNAME (CONTACT/OPERATOR)
, KIM JONG HYORK (CONTACT/OWNER)
Alternative names: PARK RD CLEANERS
ROBESON, PAUL (3700 10TH ST NW in WASHINGTON, DC)
(National Center for Education Statistics) - STATE ID-9250 Organizations: DISTRICT OF COLUMBIA PUB SCHLS (SCHOOL DISTRICT)
Housing units lacking complete plumbing facilities: 0.7% Housing units lacking complete kitchen facilities: 0.5%
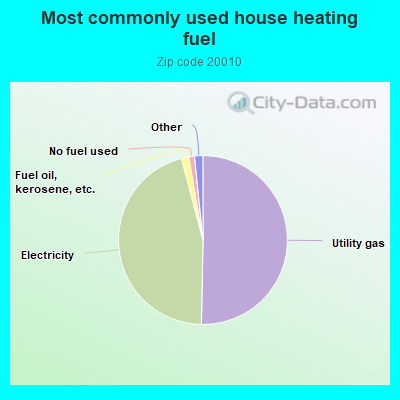
50.3%Utility gas
45.6%Electricity
1.4%Fuel oil, kerosene, etc.
1.1%No fuel used
0.6%Bottled, tank, or LP gas
0.6%Solar energy
Population in 1990: 28,849.
Place of birth for U.S.-born residents:
This state: 9,089
Northeast: 4,113
Midwest: 2,768
South: 5,478
West: 1,870
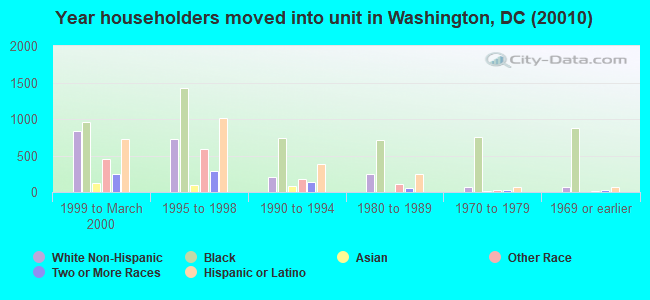
55% of the 20010 zip code residents lived in the same house 5 years ago. Out of people who lived in different houses, 63% lived in this county. Out of people who lived in different counties, 50% lived in District of Columbia.
78% of the 20010 zip code residents lived in the same house 1 year ago. Out of people who lived in different houses, 56% moved from this county. Out of people who lived in different houses, 28% moved from different state. Out of people who lived in different houses, 18% moved from abroad.
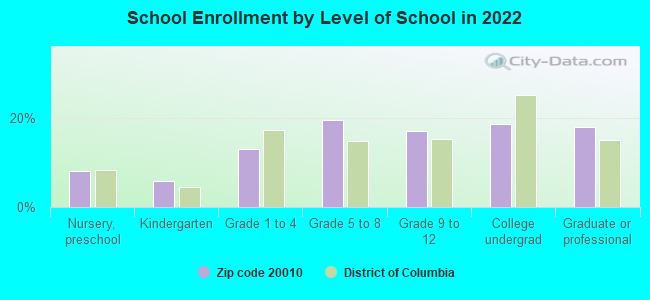
Private vs. public school enrollment:
Students in private schools in grades 1 to 8 (elementary and middle school): 352
Here:
15.0%
District of Columbia:
22.5%
Students in private schools in grades 9 to 12 (high school): 61
Here:
4.9%
District of Columbia:
21.7%
Students in private undergraduate colleges: 564
Here:
47.4%
District of Columbia:
75.9%
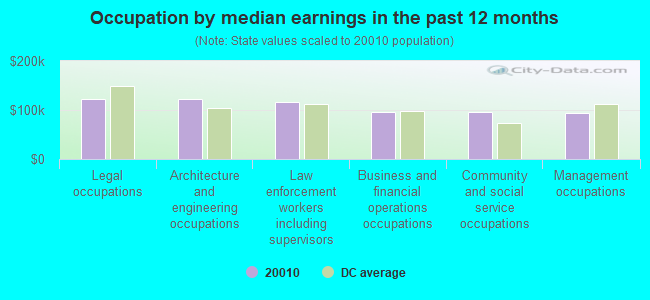
Occupation by median earnings in the past 12 months ($)
122,542Legal occupations
122,432Architecture and engineering occupations
117,318Law enforcement workers including supervisors
95,978Business and financial operations occupations
95,595Community and social service occupations
92,893Management occupations
Companies with biggest federal contracts located in this zip code:
MONTAGE, INC (3636 16TH STREET, NW in WASHINGTON, DC; small business) : $44,530,769 in 369 contractsfrom 1999 to 2006
Contracts for Miscellaneous Items, Construction of Structures and Facilities -- Other Administrative Facilities and Service Buildings, Other Architect and Engineering Services, Construction of Structures and Facilities -- Office Buildings, and moreby Department of State, Navy, Public Buildings Service, Army, and others Signed by year:2000: $14,409,056; 2001: $8,810,493; 2002: $6,261,903; 2003: $12,010,392; 2004: -$105,220; 2005: $2,391,259; 2006: $81,345.
Biggest contracts:
$5,856,000 with Department of State for Miscellaneous Items. Signed on 2000-09-15. Completion date: 2003-01-15.
$2,495,000 with Navy for Construction of Structures and Facilities -- Other Administrative Facilities and Service Buildings. Taking place in VA. Signed on 2003-07-31. Completion date: 2004-06-25.
$2,290,000, same as above.Signed on 2003-09-29. Completion date: 2005-05-30.
$1,600,000 with Department of State for Other Architect and Engineering Services. Signed on 2002-08-15. Completion date: 2003-02-15.
VERRAZANO CONTRACTING CO , INC (3110 GOERGIA AVE NW in WASHINGTON, DC; small business) : $10,868,208 in 113 contractsfrom 2003 to 2006
Contracts for Maintenance, Repair or Alteration of Real Property -- Office Buildings, Maintenance, Repair or Alteration of Real Property -- Other Administrative Facilities and Service Buildings, Construction of Structures and Facilities -- Other Administrative Facilities and Service Buildings, Construction of Structures and Facilities -- Family Housing Facilities, and moreby Public Buildings Service, Army, Navy, Geological Survey, and others Signed by year:2000: $0; 2001: $0; 2002: $0; 2003: $77,849; 2004: $2,660,940; 2005: $4,846,257; 2006: $3,283,162.
Biggest contracts:
$1,300,908 with Public Buildings Service for Maintenance, Repair or Alteration of Real Property -- Office Buildings. Signed on 2006-06-28. Effective on 2006-06-29. Completion date: 2007-12-31.
$1,184,917 with Army for Maintenance, Repair or Alteration of Real Property -- Other Administrative Facilities and Service Buildings. Taking place in MD. Signed on 2004-02-05. Completion date: 2005-01-28.
$918,245 with Navy for Construction of Structures and Facilities -- Other Administrative Facilities and Service Buildings. Taking place in MD. Signed on 2005-09-30. Completion date: 2006-12-03.
$703,821 with Army for Construction of Structures and Facilities -- Family Housing Facilities. Taking place in VA. Signed on 2005-06-13. Completion date: 2005-09-30.
CHILDRENS NATIONAL MEDICAL CEN (111 MICHIGAN AVENUE, NW in WASHINGTON, DC; small business) : $2,445,183 in 26 contractsfrom 2000 to 2006
Contracts for Other Medical Services, Ambulance Service, Pediatric Services, General Health Care Services by Army Signed by year:2000: $431,328; 2001: $74,502; 2002: $802,679; 2003: $358,104; 2004: $131,827; 2005: $199,647; 2006: $447,096.
Biggest contracts:
$461,497 with Army for Other Medical Services. Signed on 2003-02-06. Completion date: 2003-09-30.
$322,760 with Army for Ambulance Service. Signed on 2006-04-25. Completion date: 2006-09-30.
$314,880 with Army for Pediatric Services. Signed on 2004-11-20. Completion date: 2005-09-30.
$283,296 with Army for General Health Care Services. Signed on 2002-11-05. Completion date: 2001-09-30.
CAROL A. KELLEY (1808 IRVING STREET, N.W. in WASHINGTON, D.C., DC; small business) : $338,141 in 5 contractsfrom 2004 to 2006
Contracts for Personal Services Contracts by Departmental Offices Signed by year:2000: $0; 2001: $0; 2002: $0; 2003: $0; 2004: $168,980; 2005: $112,027; 2006: $57,134.
Biggest contracts:
$168,980 with Departmental Offices for Personal Services Contracts. Signed on 2004-01-09. Effective on 2004-01-14. Completion date: 2005-01-13.
$86,191, same as above.Signed on 2005-01-26. Completion date: 2006-01-13.
$55,134, same as above.Signed on 2006-01-13. Effective on 2006-01-14. Completion date: 2007-01-13.
$25,836, same as above.Signed on 2005-10-24. Completion date: 2006-01-13.
LEDDY, PETER (1673 PARK RD NW APT-302 in WASHINGTON, DC; small business)
$37,000 with Army for Program Management/Support Services. Signed on 2004-03-15. Completion date: 2005-03-15.
MAXCOM CONSULTING (3163 ADAMS MILL RD , NW in WASHINGTON, DC; small business)
$22,950 with Army for Signs, Advertising Displays, and Identification Plates. Taking place in MD. Signed on 2001-12-13. Completion date: 2002-02-28.
MEDIATE FACILITATE, INC (3307 19TH ST NW STE A4 in WASHINGTON, DC; small business)
$10,000 with Uniformed Services University of the Health Sciences for Program Review/Development Services. Signed on 2005-08-13. Completion date: 2005-10-31.
AZIZ,MOHAMMED (1914 PARK RD NW in WASHINGTON, DC; small business)
$5,000 with Uniformed Services University of the Health Sciences for Educational Services. Taking place in MD. Signed on 2005-06-30. Completion date: 2005-08-05.
BALENGER, SALLY (1665 LAMONT ST in WASHINGTON, DC; small business)
$2,400 with Army for Educational Services. Signed on 2004-06-14. Completion date: 2004-09-07.
MAINORS BUS SERVICE (3226 GEORGIA AV NW in WASHINGTON, DC; small business) : -$700 in 2 contractsin 2001
$0 with Army for Passenger Motor Charter Service. Taking place in MD. Signed on 2001-05-30. Completion date: 2001-05-02.
-$700, same as above.Signed on 2001-05-30. Completion date: 2001-05-02.
Top industries in this zip code by the number of employees in 2005:
Health Care and Social Assistance: General Medical and Surgical Hospitals (over 1000 employees: 2 establishments)
Health Care and Social Assistance: Specialty (except Psychiatric and Substance Abuse) Hospitals (over 1000: 1)
Professional, Scientific, and Technical Services: Research and Development in the Physical, Engineering, and Life Sciences (250-499: 2)
Health Care and Social Assistance: Offices of Physicians (except Mental Health Specialists) (50-99: 1, 20-49: 3, 10-19: 11, 5-9: 15, 1-4: 35)
Administrative and Support and Waste Management and Remediation Services: Janitorial Services (250-499: 1, 50-99: 1, 5-9: 1, 1-4: 2)
Health Care and Social Assistance: Child Day Care Services (50-99: 1, 20-49: 4, 10-19: 2, 1-4: 2)
Health Care and Social Assistance: Nursing Care Facilities (100-249: 1)
Other Services (except Public Administration): Linen Supply (100-249: 1)
Health Care and Social Assistance: Other Individual and Family Services (20-49: 2, 10-19: 4, 5-9: 1, 1-4: 2)
People in group quarters in 2010:
284 people in emergency and transitional shelters (with sleeping facilities) for people experiencing homelessness
260 people in nursing facilities/skilled-nursing facilities
56 people in other noninstitutional facilities
31 people in residential treatment centers for adults
19 people in group homes for juveniles (non-correctional)
16 people in group homes intended for adults
People in group quarters in 2000:
318 people in other noninstitutional group quarters
218 people in nursing homes
104 people in orthopedic wards and institutions for the physically handicapped
39 people in halfway houses
29 people in homes or halfway houses for drug/alcohol abuse
20 people in homes for the mentally retarded
18 people in hospitals/wards and hospices for chronically ill
18 people in other hospitals or wards for chronically ill
18 people in other group homes
18 people in religious group quarters
12 people in homes for the mentally ill
10 people in other nonhousehold living situations
7 people in hospitals or wards for drug/alcohol abuse
6 people in homes for the physically handicapped
5 people in short-term care, detention or diagnostic centers for delinquent children
Fatal accident statistics in 2012:
Fatal accident count: 1
Vehicles involved in fatal accidents: 1
Fatal accidents caused by drunken drivers: 0
Fatalities: 1
Persons involved in fatal accidents: 1
Pedestrians involved in fatal accidents: 1
Home Mortgage Disclosure Act Aggregated Statistics For Year 2009 (Based on 4 full and 14 partial tracts)
A) FHA, FSA/RHS & VA Home Purchase Loans
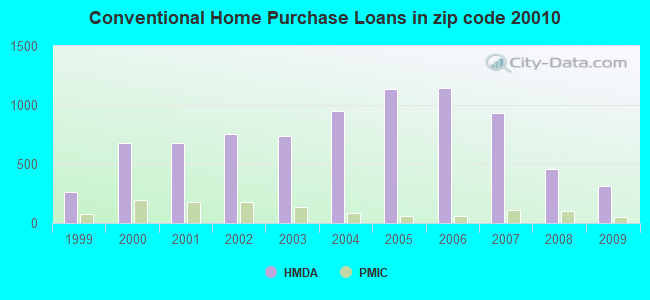
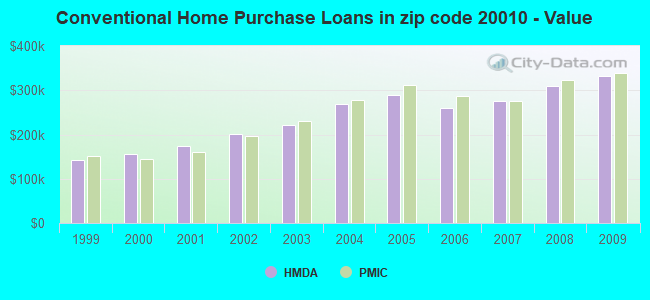
B) Conventional Home Purchase Loans
C) Refinancings
D) Home Improvement Loans
E) Loans on Dwellings For 5+ Families
F) Non-occupant Loans on < 5 Family Dwellings (A B C & D)
Number
Average Value
Number
Average Value
Number
Average Value
Number
Average Value
Number
Average Value
Number
Average Value
LOANS ORIGINATED
245
$348,840
315
$331,145
990
$351,724
54
$284,369
10
$5,084,000
95
$352,642
APPLICATIONS APPROVED, NOT ACCEPTED
3
$397,057
25
$286,684
63
$315,377
5
$282,164
0
$0
5
$268,848
APPLICATIONS DENIED
32
$247,690
46
$265,376
372
$320,287
42
$100,768
2
$1,468,380
52
$252,792
APPLICATIONS WITHDRAWN
43
$297,263
69
$313,200
236
$337,077
24
$212,957
2
$1,543,235
33
$256,974
FILES CLOSED FOR INCOMPLETENESS
4
$390,180
4
$442,882
54
$336,167
4
$223,632
0
$0
10
$330,924
Aggregated Statistics For Year 2008 (Based on 4 full and 14 partial tracts)
A) FHA, FSA/RHS & VA Home Purchase Loans
B) Conventional Home Purchase Loans
C) Refinancings
D) Home Improvement Loans
E) Loans on Dwellings For 5+ Families
F) Non-occupant Loans on < 5 Family Dwellings (A B C & D)
Number
Average Value
Number
Average Value
Number
Average Value
Number
Average Value
Number
Average Value
Number
Average Value
LOANS ORIGINATED
94
$373,581
459
$310,599
572
$300,347
62
$118,793
6
$1,768,617
104
$307,447
APPLICATIONS APPROVED, NOT ACCEPTED
8
$301,290
47
$286,583
92
$309,008
15
$59,988
3
$127,037
19
$271,922
APPLICATIONS DENIED
23
$326,022
77
$349,585
294
$316,258
76
$92,856
5
$1,528,992
79
$258,051
APPLICATIONS WITHDRAWN
20
$368,654
70
$331,884
165
$302,446
9
$225,880
0
$0
25
$275,348
FILES CLOSED FOR INCOMPLETENESS
0
$0
14
$297,034
26
$346,602
0
$0
0
$0
7
$200,759
Aggregated Statistics For Year 2007 (Based on 4 full and 14 partial tracts)
A) FHA, FSA/RHS & VA Home Purchase Loans
B) Conventional Home Purchase Loans
C) Refinancings
D) Home Improvement Loans
E) Loans on Dwellings For 5+ Families
F) Non-occupant Loans on < 5 Family Dwellings (A B C & D)
G) Loans On Manufactured Home Dwelling (A B C & D)
Number
Average Value
Number
Average Value
Number
Average Value
Number
Average Value
Number
Average Value
Number
Average Value
Number
Average Value
LOANS ORIGINATED
9
$285,587
928
$275,070
791
$284,917
109
$164,095
12
$3,980,261
195
$332,023
0
$0
APPLICATIONS APPROVED, NOT ACCEPTED
1
$107,070
100
$288,193
164
$295,519
20
$127,532
0
$0
29
$370,342
2
$39,535
APPLICATIONS DENIED
2
$123,950
219
$318,269
448
$340,514
67
$151,978
1
$9,559,500
149
$369,646
0
$0
APPLICATIONS WITHDRAWN
0
$0
98
$298,302
180
$312,182
9
$241,010
1
$1,200,000
43
$319,997
0
$0
FILES CLOSED FOR INCOMPLETENESS
0
$0
27
$267,571
36
$299,191
3
$304,003
0
$0
15
$320,327
0
$0
Aggregated Statistics For Year 2006 (Based on 4 full and 14 partial tracts)
A) FHA, FSA/RHS & VA Home Purchase Loans
B) Conventional Home Purchase Loans
C) Refinancings
D) Home Improvement Loans
E) Loans on Dwellings For 5+ Families
F) Non-occupant Loans on < 5 Family Dwellings (A B C & D)
G) Loans On Manufactured Home Dwelling (A B C & D)
Number
Average Value
Number
Average Value
Number
Average Value
Number
Average Value
Number
Average Value
Number
Average Value
Number
Average Value
LOANS ORIGINATED
2
$305,240
1,148
$258,808
1,168
$285,487
162
$219,024
9
$7,074,683
352
$289,239
0
$0
APPLICATIONS APPROVED, NOT ACCEPTED
0
$0
145
$226,946
178
$261,080
40
$110,632
3
$1,952,943
69
$235,809
0
$0
APPLICATIONS DENIED
3
$188,640
233
$279,010
528
$309,622
82
$128,083
2
$3,100
161
$334,594
1
$50,000
APPLICATIONS WITHDRAWN
3
$144,030
148
$271,758
246
$276,264
18
$164,126
0
$0
58
$260,859
0
$0
FILES CLOSED FOR INCOMPLETENESS
0
$0
46
$177,431
56
$305,601
7
$146,307
0
$0
18
$260,224
0
$0
Aggregated Statistics For Year 2005 (Based on 4 full and 14 partial tracts)
A) FHA, FSA/RHS & VA Home Purchase Loans
B) Conventional Home Purchase Loans
C) Refinancings
D) Home Improvement Loans
E) Loans on Dwellings For 5+ Families
F) Non-occupant Loans on < 5 Family Dwellings (A B C & D)
G) Loans On Manufactured Home Dwelling (A B C & D)
Number
Average Value
Number
Average Value
Number
Average Value
Number
Average Value
Number
Average Value
Number
Average Value
Number
Average Value
LOANS ORIGINATED
7
$257,691
1,134
$288,416
1,279
$277,600
127
$176,601
13
$3,902,535
361
$297,732
5
$249,440
APPLICATIONS APPROVED, NOT ACCEPTED
1
$271,490
119
$273,453
194
$241,736
22
$133,970
0
$0
52
$300,979
3
$179,603
APPLICATIONS DENIED
0
$0
219
$276,793
413
$280,486
63
$126,955
4
$2,204,235
127
$262,212
0
$0
APPLICATIONS WITHDRAWN
1
$459,670
120
$277,741
211
$264,289
35
$135,963
0
$0
71
$277,326
0
$0
FILES CLOSED FOR INCOMPLETENESS
0
$0
28
$315,286
58
$242,995
12
$85,503
0
$0
11
$224,006
0
$0
Aggregated Statistics For Year 2004 (Based on 4 full and 14 partial tracts)
A) FHA, FSA/RHS & VA Home Purchase Loans
B) Conventional Home Purchase Loans
C) Refinancings
D) Home Improvement Loans
E) Loans on Dwellings For 5+ Families
F) Non-occupant Loans on < 5 Family Dwellings (A B C & D)
G) Loans On Manufactured Home Dwelling (A B C & D)
Number
Average Value
Number
Average Value
Number
Average Value
Number
Average Value
Number
Average Value
Number
Average Value
Number
Average Value
LOANS ORIGINATED
13
$210,788
950
$268,206
1,323
$231,906
104
$140,242
20
$1,252,377
325
$240,464
1
$84,250
APPLICATIONS APPROVED, NOT ACCEPTED
1
$162,000
120
$255,090
164
$216,114
15
$161,393
0
$0
50
$229,541
0
$0
APPLICATIONS DENIED
3
$277,133
208
$260,757
430
$227,205
70
$129,220
5
$1,932,506
99
$227,362
3
$124,623
APPLICATIONS WITHDRAWN
1
$298,260
100
$261,886
178
$216,271
9
$125,334
1
$133,830
39
$196,923
0
$0
FILES CLOSED FOR INCOMPLETENESS
2
$140,815
17
$300,228
55
$179,387
6
$184,418
0
$0
13
$257,364
0
$0
Aggregated Statistics For Year 2003 (Based on 4 full and 14 partial tracts)
A) FHA, FSA/RHS & VA Home Purchase Loans
B) Conventional Home Purchase Loans
C) Refinancings
D) Home Improvement Loans
E) Loans on Dwellings For 5+ Families
F) Non-occupant Loans on < 5 Family Dwellings (A B C & D)
Number
Average Value
Number
Average Value
Number
Average Value
Number
Average Value
Number
Average Value
Number
Average Value
LOANS ORIGINATED
33
$221,682
739
$222,107
2,233
$206,657
60
$68,696
18
$1,292,117
351
$201,103
APPLICATIONS APPROVED, NOT ACCEPTED
3
$229,460
69
$195,148
243
$186,753
22
$49,706
0
$0
52
$156,692
APPLICATIONS DENIED
7
$219,000
96
$198,088
429
$185,052
71
$39,975
3
$1,447,793
73
$157,042
APPLICATIONS WITHDRAWN
6
$215,820
103
$201,549
187
$195,259
5
$54,204
3
$587,440
35
$180,423
FILES CLOSED FOR INCOMPLETENESS
1
$373,020
23
$204,679
73
$174,286
5
$50,592
0
$0
14
$135,494
Aggregated Statistics For Year 2002 (Based on 4 full and 14 partial tracts)
A) FHA, FSA/RHS & VA Home Purchase Loans
B) Conventional Home Purchase Loans
C) Refinancings
D) Home Improvement Loans
E) Loans on Dwellings For 5+ Families
F) Non-occupant Loans on < 5 Family Dwellings (A B C & D)
Number
Average Value
Number
Average Value
Number
Average Value
Number
Average Value
Number
Average Value
Number
Average Value
LOANS ORIGINATED
97
$166,592
757
$202,064
1,164
$204,764
36
$27,495
22
$909,919
190
$189,619
APPLICATIONS APPROVED, NOT ACCEPTED
4
$225,908
49
$194,844
127
$151,992
10
$38,042
0
$0
17
$136,468
APPLICATIONS DENIED
15
$162,795
79
$192,755
236
$157,791
73
$38,921
1
$667,000
53
$141,469
APPLICATIONS WITHDRAWN
16
$164,006
80
$193,123
119
$168,832
7
$47,209
2
$766,765
35
$166,001
FILES CLOSED FOR INCOMPLETENESS
4
$164,218
22
$165,560
53
$176,876
1
$43,000
0
$0
6
$169,540
Aggregated Statistics For Year 2001 (Based on 4 full and 14 partial tracts)
A) FHA, FSA/RHS & VA Home Purchase Loans
B) Conventional Home Purchase Loans
C) Refinancings
D) Home Improvement Loans
E) Loans on Dwellings For 5+ Families
F) Non-occupant Loans on < 5 Family Dwellings (A B C & D)
Number
Average Value
Number
Average Value
Number
Average Value
Number
Average Value
Number
Average Value
Number
Average Value
LOANS ORIGINATED
115
$149,483
676
$174,869
914
$185,158
68
$34,801
10
$1,071,413
170
$151,657
APPLICATIONS APPROVED, NOT ACCEPTED
9
$140,977
59
$149,123
120
$152,273
33
$45,728
1
$391,100
23
$125,996
APPLICATIONS DENIED
20
$138,078
122
$145,683
272
$135,699
100
$31,292
2
$1,220,570
68
$134,812
APPLICATIONS WITHDRAWN
10
$131,192
86
$167,210
150
$129,643
12
$32,518
8
$542,851
37
$139,503
FILES CLOSED FOR INCOMPLETENESS
3
$166,780
18
$178,296
48
$174,025
1
$71,840
0
$0
4
$80,222
Aggregated Statistics For Year 2000 (Based on 4 full and 14 partial tracts)
A) FHA, FSA/RHS & VA Home Purchase Loans
B) Conventional Home Purchase Loans
C) Refinancings
D) Home Improvement Loans
E) Loans on Dwellings For 5+ Families
F) Non-occupant Loans on < 5 Family Dwellings (A B C & D)
Number
Average Value
Number
Average Value
Number
Average Value
Number
Average Value
Number
Average Value
Number
Average Value
LOANS ORIGINATED
137
$136,135
682
$155,097
348
$133,996
49
$37,218
21
$596,270
97
$130,056
APPLICATIONS APPROVED, NOT ACCEPTED
13
$150,009
68
$154,155
96
$103,113
32
$23,254
3
$143,783
27
$128,429
APPLICATIONS DENIED
21
$132,410
166
$125,747
252
$108,355
118
$27,652
2
$259,705
71
$114,249
APPLICATIONS WITHDRAWN
22
$117,809
82
$167,694
94
$127,886
12
$31,460
4
$808,622
12
$108,288
FILES CLOSED FOR INCOMPLETENESS
4
$188,968
17
$224,953
23
$133,090
0
$0
0
$0
3
$154,530
Aggregated Statistics For Year 1999 (Based on 3 full and 7 partial tracts)
A) FHA, FSA/RHS & VA Home Purchase Loans
B) Conventional Home Purchase Loans
C) Refinancings
D) Home Improvement Loans
E) Loans on Dwellings For 5+ Families
F) Non-occupant Loans on < 5 Family Dwellings (A B C & D)
2004 - 2018 National Fire Incident Reporting System (NFIRS) incidents
Based on the data from the years 2004 - 2018 the average number of fires per year is 32. The highest number of reported fires - 77 took place in 2017, and the least - 0 in 2006. The data has an increasing trend.
When looking into fire subcategories, the most incidents belonged to: Structure Fires (58.8%), and Outside Fires (26.7%).
Fire incident types reported to NFIRS in Zip Code 20010


 Nearest zip codes: 20009, 20317, 20011, 20001, 20036, 20005.


 Based on the data from the years 2004 - 2018 the average number of fires per year is 32. The highest number of reported fires - 77 took place in 2017, and the least - 0 in 2006. The data has an increasing trend.
 When looking into fire subcategories, the most incidents belonged to: Structure Fires (58.8%), and Outside Fires (26.7%).