Estimated zip code population in 2022: 40,339 Zip code population in 2010: 35,653 Zip code population in 2000: 31,688
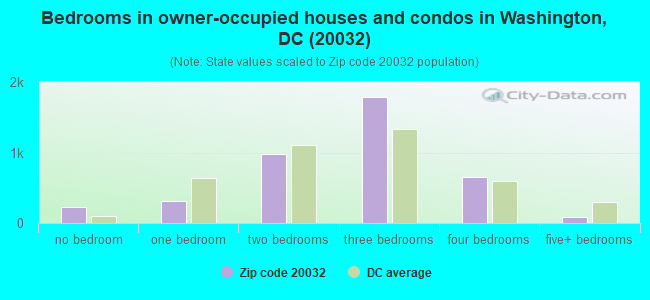
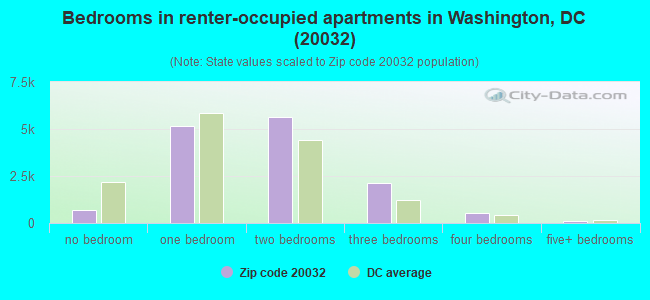
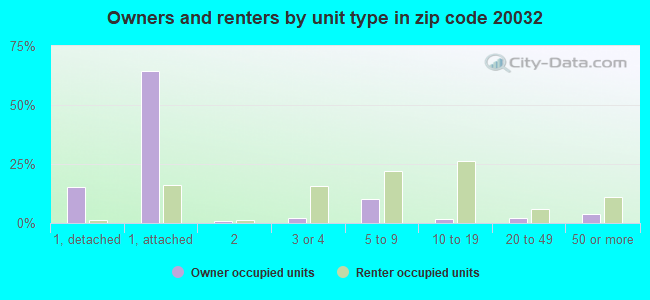
Houses and condos: 20,306 Renter-occupied apartments: 14,124
% of renters here:
77%
State:
59%
March 2022 cost of living index in zip code 20032: 120.2 (high, U.S. average is 100)
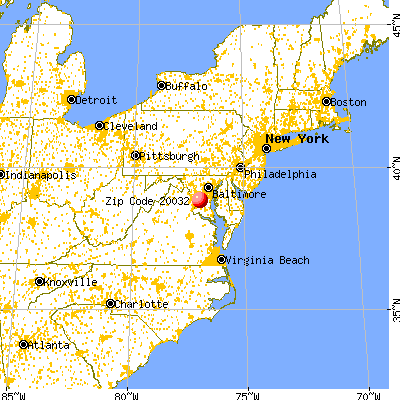
Land area: 5.3 sq. mi. Water area: 0.1 sq. mi.
Population density: 7,680 people per square mile
(high).
OSM Map
General Map
Google Map
MSN Map
OSM Map
General Map
Google Map
MSN Map
OSM Map
General Map
Google Map
MSN Map
OSM Map
General Map
Google Map
MSN Map
Please wait while loading the map...
Real estate property taxes paid for housing units in 2022:
This zip code:
0.6% ($2,278)
District of Columbia:
0.6% ($4,114)
Median real estate property taxes paid for housing units with mortgages in 2022: $2,423 (0.6%) Median real estate property taxes paid for housing units with no mortgage in 2022: $1,244 (0.4%)
Business Search- 14 Million verified businesses
Males: 19,179
(47.5%)
Females: 21,159
(52.5%)
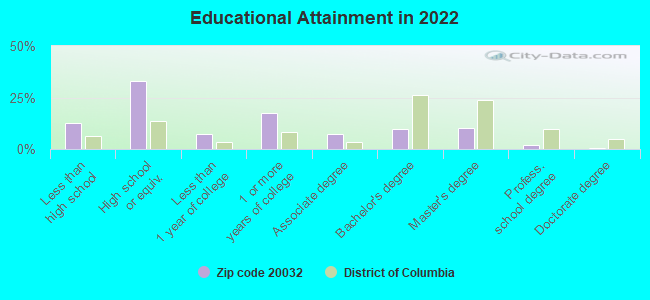
For population 25 years and over in 20032:
High school or higher: 83.4%
Bachelor's degree or higher: 21.6%
Graduate or professional degree: 12.1%
Unemployed: 11.4%
Mean travel time to work (commute): 35.9 minutes
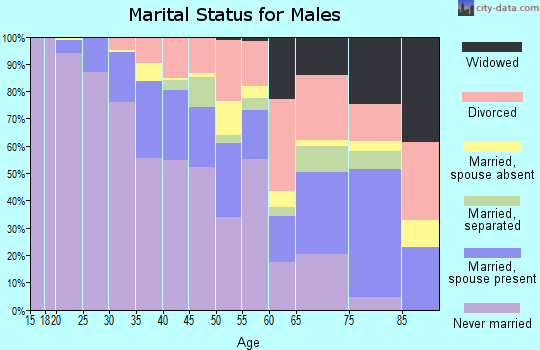
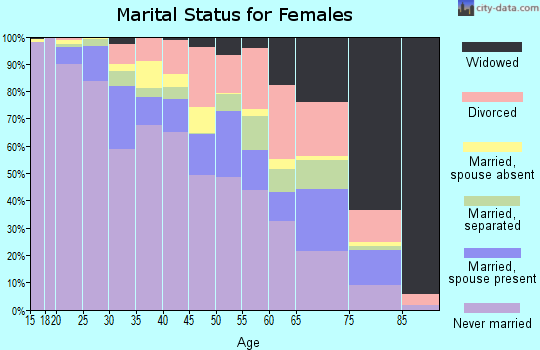
For population 15 years and over in 20032:
Never married: 60.1%
Now married: 23.1%
Separated: 2.1%
Widowed: 4.9%
Divorced: 9.8%
Zip code 20032 compared to state average:
Median household income below state average.
Median house value below state average.
Unemployed percentage above state average.
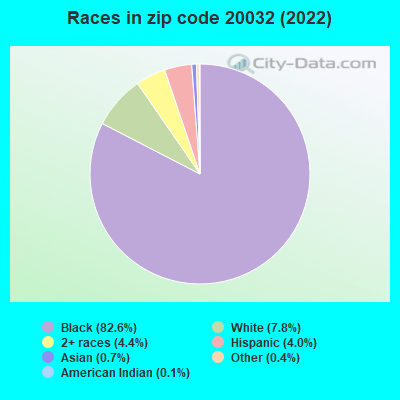
Black race population percentage above state average.
Hispanic race population percentage below state average.
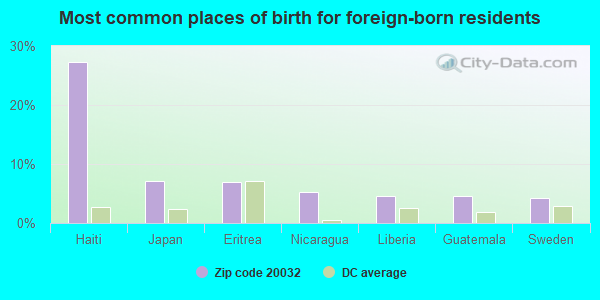
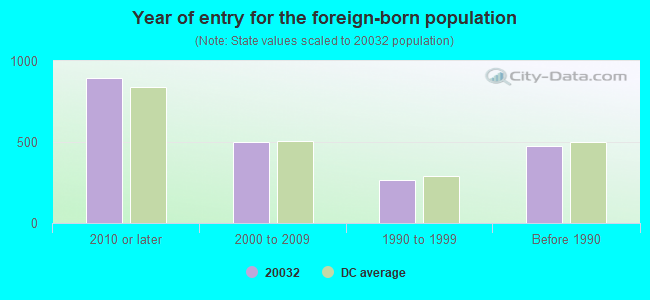
Foreign-born population percentage significantly below state average.
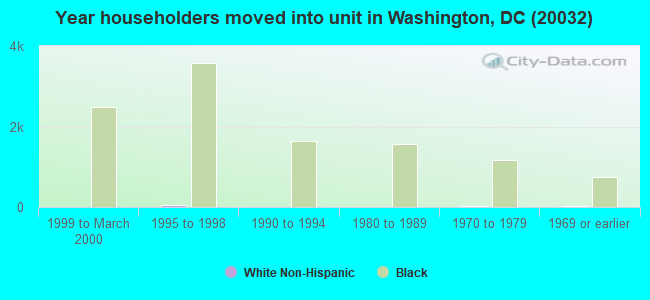
Length of stay since moving in significantly above state average.
Percentage of population with a bachelor's degree or higher significantly below state average.
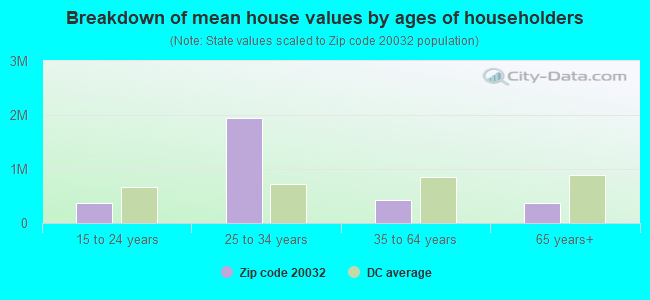
Estimated median house/condo value in 2022: $363,417
20032:
$363,417
District of Columbia:
$711,100
According to our research of District of Columbia and other state lists, there were 161 registered sex offenders living in 20032 zip code as of April 27, 2024. The ratio of all residents to sex offenders in zip code 20032 is 260 to 1.
Median resident age:
This zip code:
33.8 years
District of Columbia median age:
34.9 years
Average household size:
This zip code:
2.1 people
District of Columbia:
1.9 people
Averages for the 2020 tax year for zip code 20032, filed in 2021:
Average Adjusted Gross Income (AGI) in 2020: $40,992 (Individual Income Tax Returns)
Here:
$40,992
State:
$115,481
Salary/wage: $39,800 (reported on 87.6% of returns)
Here:
$39,800
State:
$91,123
(% of AGI for various income ranges: 1039.4% for AGIs below $25k, 3747.9% for AGIs $25k-50k, 7244.5% for AGIs $50k-75k, 11271.8% for AGIs $75k-100k, 17664.9% for AGIs $100k-200k, 50966.7% for AGIs over 200k)
Taxable interest for individuals: $363 (reported on 9.6% of returns)
This zip code:
$363
District of Columbia:
$2,372
(% of AGI for various income ranges: 1.1% for AGIs below $25k, 2.0% for AGIs $25k-50k, 6.0% for AGIs $50k-75k, 12.5% for AGIs $75k-100k, 22.7% for AGIs $100k-200k, 151.7% for AGIs over 200k)
Ordinary dividends: $1,360 (reported on 3.5% of returns)
Here:
$1,360
State:
$11,383
(% of AGI for various income ranges: 0.3% for AGIs below $25k, 0.9% for AGIs $25k-50k, 2.8% for AGIs $50k-75k, 12.8% for AGIs $75k-100k, 46.5% for AGIs $100k-200k, 485.0% for AGIs over 200k)
Net capital gain/loss in AGI: +$5,198 (reported on 3.8% of returns)
Here:
+$5,198
State:
+$37,778
(% of AGI for various income ranges: 0.1% for AGIs below $25k, 1.7% for AGIs $25k-50k, 5.0% for AGIs $50k-75k, 11.9% for AGIs $75k-100k, 162.7% for AGIs $100k-200k, 3246.7% for AGIs over 200k)
Profit/loss from business: +$436 (reported on 14.8% of returns)
Here:
+$436
State:
+$22,231
(% of AGI for various income ranges: 71.0% for AGIs below $25k, 438.3% for AGIs over 200k)
Taxable individual retirement arrangement distribution: $11,796 (reported on 1.7% of returns)
20032:
$11,796
District of Columbia:
$28,122
(% of AGI for various income ranges: 8.4% for AGIs below $25k, 11.3% for AGIs $25k-50k, 35.2% for AGIs $50k-75k, 46.3% for AGIs $75k-100k, 205.6% for AGIs $100k-200k)
Total itemized deductions: $28,158 (reported on 9.7% of returns)
Here:
$28,158
State:
$36,798
(% of AGI for various income ranges: 27.0% for AGIs below $25k, 137.3% for AGIs $25k-50k, 622.7% for AGIs $50k-75k, 1366.8% for AGIs $75k-100k, 2249.5% for AGIs $100k-200k, 4775.0% for AGIs over 200k)
Charity contributions: $10,626 (reported on 8.3% of returns)
Here:
$10,626
State:
$12,983
(% of AGI for various income ranges: 6.0% for AGIs below $25k, 48.0% for AGIs $25k-50k, 203.7% for AGIs $50k-75k, 455.6% for AGIs $75k-100k, 667.6% for AGIs $100k-200k, 1856.7% for AGIs over 200k)
Taxes paid: $6,218 (reported on 9.6% of returns)
20032:
$6,218
State:
$8,470
(% of AGI for various income ranges: 2.9% for AGIs below $25k, 18.8% for AGIs $25k-50k, 109.2% for AGIs $50k-75k, 330.4% for AGIs $75k-100k, 647.5% for AGIs $100k-200k, 1001.7% for AGIs over 200k)
Earned income credit: $2,441 (reported on 34.3% of returns)
Here:
$2,441
State:
$2,144
(% of AGI for various income ranges: 166.2% for AGIs below $25k, 96.8% for AGIs $25k-50k)
Percentage of individuals using paid preparers for their 2020 taxes: 90.9%
Here:
91%
State:
91%
(% for various income ranges: 92.8% for AGIs below $25k, 91.2% for AGIs $25k-50k, 88.1% for AGIs $50k-75k, 86.9% for AGIs $75k-100k, 87.4% for AGIs $100k-200k, 92.9% for AGIs over 200k)
Averages for the 2012 tax year for zip code 20032, filed in 2013:
Average Adjusted Gross Income (AGI) in 2012: $32,122 (Individual Income Tax Returns)
Here:
$32,122
State:
$85,963
Salary/wage: $32,216 (reported on 84.7% of returns)
Here:
$32,216
State:
$68,630
(% of AGI for various income ranges: 74.8% for AGIs below $25k, 88.7% for AGIs $25k-50k, 87.8% for AGIs $50k-75k, 88.9% for AGIs $75k-100k, 86.0% for AGIs $100k-200k, 69.8% for AGIs over 200k)
Taxable interest for individuals: $378 (reported on 9.3% of returns)
This zip code:
$378
District of Columbia:
$2,095
(% of AGI for various income ranges: 0.1% for AGIs $50k-75k, 0.1% for AGIs $75k-100k, 0.3% for AGIs $100k-200k, 0.1% for AGIs over 200k)
Ordinary dividends: $1,662 (reported on 3.3% of returns)
Here:
$1,662
State:
$12,032
(% of AGI for various income ranges: 0.1% for AGIs below $25k, 0.2% for AGIs $50k-75k, 0.1% for AGIs $75k-100k, 0.5% for AGIs $100k-200k)
Net capital gain/loss in AGI: +$2,255 (reported on 2.0% of returns)
Here:
+$2,255
State:
+$29,160
(% of AGI for various income ranges: 1.1% for AGIs $100k-200k)
Profit/loss from business: +$4,432 (reported on 16.4% of returns)
Here:
+$4,432
State:
+$21,205
(% of AGI for various income ranges: 12.9% for AGIs below $25k)
Taxable individual retirement arrangement distribution: $7,858 (reported on 2.0% of returns)
20032:
$7,858
District of Columbia:
$24,847
(% of AGI for various income ranges: 0.3% for AGIs below $25k, 0.5% for AGIs $25k-50k, 0.4% for AGIs $50k-75k, 0.8% for AGIs $75k-100k, 0.8% for AGIs $100k-200k)
Total itemized deductions: $18,323 (31% of AGI, reported on 21.9% of returns)
Here:
$18,323
State:
$33,550
Here:
30.6% of AGI
State:
20.5% of AGI
(% of AGI for various income ranges: 4.4% for AGIs below $25k, 11.1% for AGIs $25k-50k, 17.5% for AGIs $50k-75k, 18.0% for AGIs $75k-100k, 16.3% for AGIs $100k-200k, 15.8% for AGIs over 200k)
Charity contributions: $5,210 (reported on 19.3% of returns)
Here:
$5,210
State:
$6,251
(% of AGI for various income ranges: 0.9% for AGIs below $25k, 2.8% for AGIs $25k-50k, 4.4% for AGIs $50k-75k, 4.3% for AGIs $75k-100k, 4.2% for AGIs $100k-200k, 4.4% for AGIs over 200k)
Taxes paid: $4,218 (reported on 21.7% of returns)
20032:
$4,218
State:
$14,283
(% of AGI for various income ranges: 0.5% for AGIs below $25k, 1.8% for AGIs $25k-50k, 4.0% for AGIs $50k-75k, 5.2% for AGIs $75k-100k, 5.1% for AGIs $100k-200k, 5.0% for AGIs over 200k)
Earned income credit: $2,598 (reported on 41.7% of returns)
Here:
$2,598
State:
$2,233
(% of AGI for various income ranges: 13.4% for AGIs below $25k, 1.7% for AGIs $25k-50k)
Percentage of individuals using paid preparers for their 2012 taxes: 46.6%
Here:
47%
State:
47%
(% for various income ranges: 45.8% for AGIs below $25k, 45.6% for AGIs $25k-50k, 51.4% for AGIs $50k-75k, 48.5% for AGIs $75k-100k, 53.3% for AGIs $100k-200k)
Averages for the 2004 tax year for zip code 20032, filed in 2005:
Average Adjusted Gross Income (AGI) in 2004: $28,470 (Individual Income Tax Returns)
Here:
$28,470
State:
$64,660
Salary/wage: $28,140 (reported on 90.8% of returns)
Here:
$28,140
State:
$51,773
(% of AGI for various income ranges: 86.4% for AGIs below $10k, 86.0% for AGIs $10k-25k, 92.3% for AGIs $25k-50k, 91.8% for AGIs $50k-75k, 88.6% for AGIs $75k-100k, 83.4% for AGIs over 100k)
Taxable interest for individuals: $471 (reported on 15.4% of returns)
This zip code:
$471
District of Columbia:
$2,287
(% of AGI for various income ranges: 0.2% for AGIs below $10k, 0.2% for AGIs $10k-25k, 0.3% for AGIs $25k-50k, 0.2% for AGIs $50k-75k, 0.2% for AGIs $75k-100k, 0.4% for AGIs over 100k)
Taxable dividends: $1,000 (reported on 4.5% of returns)
Here:
$1,000
State:
$7,977
(% of AGI for various income ranges: 0.1% for AGIs below $10k, 0.0% for AGIs $10k-25k, 0.0% for AGIs $25k-50k, 0.1% for AGIs $50k-75k, 0.2% for AGIs $75k-100k, 1.2% for AGIs over 100k)
Net capital gain/loss: +$2,240 (reported on 2.8% of returns)
Here:
+$2,240
State:
+$33,330
(% of AGI for various income ranges: -0.0% for AGIs $10k-25k, 0.0% for AGIs $25k-50k, 0.1% for AGIs $50k-75k, 0.3% for AGIs $75k-100k, 2.4% for AGIs over 100k)
Profit/loss from business: +$736 (reported on 8.6% of returns)
Here:
+$736
State:
+$18,695
(% of AGI for various income ranges: 9.7% for AGIs below $10k, 0.8% for AGIs $10k-25k, -0.5% for AGIs $25k-50k, -0.2% for AGIs $50k-75k, -0.2% for AGIs $75k-100k, -0.8% for AGIs over 100k)
IRA payment deduction: $2,162 (reported on 1.2% of returns)
20032:
$2,162
District of Columbia:
$2,548
(% of AGI for various income ranges: 0.1% for AGIs $10k-25k, 0.1% for AGIs $25k-50k, 0.1% for AGIs $50k-75k, 0.1% for AGIs $75k-100k)
Total itemized deductions: $15,566 (32% of AGI, reported on 24.8% of returns)
Here:
$15,566
State:
$26,296
Here:
31.8% of AGI
State:
21.9% of AGI
(% of AGI for various income ranges: 3.1% for AGIs below $10k, 6.1% for AGIs $10k-25k, 13.5% for AGIs $25k-50k, 19.9% for AGIs $50k-75k, 19.6% for AGIs $75k-100k, 15.9% for AGIs over 100k)
Charity contributions deductions: $4,664 (9% of AGI, reported on 23.2% of returns)
Here:
$4,664
State:
$6,415
Here:
9.4% of AGI
State:
5.1% of AGI
(% of AGI for various income ranges: 0.4% for AGIs below $10k, 1.4% for AGIs $10k-25k, 3.9% for AGIs $25k-50k, 5.5% for AGIs $50k-75k, 5.3% for AGIs $75k-100k, 4.9% for AGIs over 100k)
Total tax: $3,008 (reported on 56.4% of returns)
20032:
$3,008
State:
$13,545
(% of AGI for various income ranges: 2.2% for AGIs below $10k, 2.3% for AGIs $10k-25k, 4.7% for AGIs $25k-50k, 8.2% for AGIs $50k-75k, 9.9% for AGIs $75k-100k, 14.4% for AGIs over 100k)
Earned income credit: $1,881 (reported on 40.0% of returns)
Here:
$1,881
State:
$1,722
Percentage of individuals using paid preparers for their 2004 taxes: 59.1%
Here:
59%
State:
55%
(% for various income ranges: 59.1% for AGIs below $10k, 65.1% for AGIs $10k-25k, 56.5% for AGIs $25k-50k, 52.3% for AGIs $50k-75k, 48.0% for AGIs $75k-100k, 51.7% for AGIs over 100k)
Likely homosexual households (counted as self-reported same-sex unmarried-partner households)
Lesbian couples: 0.0% of all households
Gay men: 0.4% of all households
Household received Food Stamps/SNAP in the past 12 months: 6,399 Household did not receive Food Stamps/SNAP in the past 12 months: 12,143
Women who had a birth in the past 12 months: 788 (230 now married, 543 unmarried) Women who did not have a birth in the past 12 months: 10,190 (2,222 now married, 7,960 unmarried)
Housing units in zip code 20032 with a mortgage: 2,997 (384 second mortgage, 149 both second mortgage and home equity loan) Houses without a mortgage: 61
Median monthly owner costs for units with a mortgage: $1,971 Median monthly owner costs for units without a mortgage: $441
Residents with income below the poverty level in 2022:
This zip code:
22.1%
Whole state:
13.3%
Residents with income below 50% of the poverty level in 2022:
This zip code:
6.6%
Whole state:
5.3%
Median number of rooms in houses and condos:
Here:
5.9
State:
5.9
Median number of rooms in apartments:
Here:
3.9
State:
3.2
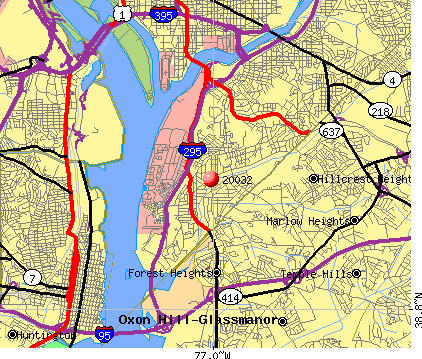
Notable locations in this zip code not listed on our city pages
Notable locations in zip code 20032: Junior Village (A), Blue Plains (B), District of Columbia Village (C), Congress Heights Metro Station (D), Shepherds Landing (E), District of Columbia Impounding Lot (F), Homeland Security and Emergency Management Agency District of Columbia (G), Zenas Child Development Center 2 (H), Zenas Child Development Center 1 (I), Tucker Day Care Center (J), Sunshine Early Learning Center (K), Rehoboth Baptist Church Child Development Center (L), Paramount Baptist Church Child Development Center (M), Paramount Baptist Church Center (N), Kuumba Learning Center (O), Anacostia Annex (P), Kids Are Us Learning Center (Q), Kiddies Kollege (R), Johenning Child Development Center (S), Dawn To Dusk Child Development Center (T). Display/hide their locations on the map
Churches in zip code 20032 include: Morning Star Baptist Church (A), Covenant Baptist Church (B), Harvey Memorial Baptist Church (C), Johenning Baptist Church (D), Greater Fellowship Full Gospel Baptist Church (E), Paramount Baptist Church (F), Rehoboth Baptist Church (G). Display/hide their locations on the map
Parks in zip code 20032 include: Mary Church Terrell Recreation Center (1), Bald Eagle Recreation Center (2), Congress Heights Recreation Center (3), Fort Greble Recreation Center (4), Malcolm X Recreation Center (5), Washington Highland Recreation Center (6), Congress Heights Playground (7), Shepherd Parkway (8), Fort Greble Recreation Center (9). Display/hide their locations on the map
2,952 married couples with children.
5,723 single-parent households (408 men, 5,315 women).
92.3% of residents of 20032 zip code speak English at home.
2.8% of residents speak Spanish at home (80% very well, 14% well, 5% not well, 1% not at all).
0.8% of residents speak other Indo-European language at home (72% very well, 13% well, 15% not well).
0.8% of residents speak Asian or Pacific Island language at home (39% very well, 49% well, 2% not well, 9% not at all).
0.9% of residents speak other language at home (54% very well, 46% well).
Foreign born population: 1,523 (3.8%) (57.6% of them are naturalized citizens)
Major facilities with environmental interests located in this zip code:
BLUE PLAINS WASTEWATER TREATMENT PLANT (5000 OVERLOOK AVENUE SW in WASHINGTON, DC)
AIR MAJOR (AIRS/AFS) (Integrated Compliance Information System) - ICIS-03-1990-0148, FORMAL ENFORCEMENT ACTION, ICIS-03-1990-0151, ICIS-03-1989-0111, ICIS-03-1987-0306, ICIS-03-1987-0304, ICIS-03-1986-0141, ICIS-03-1988-0688, ICIS-03-1998-0258, ICIS-03-1998-0406, ICIS-03-1976-0008, ICIS-03-1984-0007, ICIS-03-1990-0453, ICIS-03-1996-0072, ICIS-03-1998-0258, ENFORCEMENT/COMPLIANCE ACTIVITY (Integrated Compliance Information System) - ICIS-03-2000-0416, FORMAL ENFORCEMENT ACTION, ICIS-03-2004-0259, (Integrated Compliance Information System) - ICIS-03-2000-0416, FORMAL ENFORCEMENT ACTION, ICIS-03-2004-0259, ENFORCEMENT/COMPLIANCE ACTIVITY (Integrated Compliance Information System) COMPLIANCE ACTIVITY (Tracking inspections of insecticide, fungicide, and rodenticide, and toxic substances) National Pollutant Discharge Elimination System MAJOR (Tracking pollutant discharge elimination systems) - permit - ICIS-, ENFORCEMENT/COMPLIANCE ACTIVITY National Pollutant Discharge Elimination System NON-MAJOR (Tracking pollutant discharge elimination systems) - permit HAZARDOUS WASTE BIENNIAL REPORTER (Resource Conservation and Recovery Act (tracking hazardous waste)) Small Quantity Generators, between 100 kg and 1000 kg of hazardous waste/month (Resource Conservation and Recovery Act (tracking hazardous waste)) - notification COMMUNITY WATER SYSTEM (SDWIS) - SDWIS-DC0000002 1T, WATER TREATMENT PLANT Business SIC classification: SEWERAGE SYSTEMS Organizations: OPERNAME (CONTACT/OPERATOR)
Alternative names: BLUE PLAINS SEWAGE TREATMENT PLANT, D.C. BUREAU W-WATER TREATMENT, D. C. BUREAU WASTEWATER TREATM, D.C. WASA (BLUE PLAINS), DISTRICT OF COLUMBIA, DISTRICT OF COLUMBIA DEPT OF PUBLIC WORK, DISTRICT OF COLUMBIA (PUBLIC WORKS), DISTRICT OF COLUMBIA WATER & SEWER AUTHORITY, WATER AND SEWER UTILITY ADM.
THURGOOD MARSHALL ACADEMY PCS (421 ALABAMA AVENUE, SE in WASHINGTON, DC)
ENFORCEMENT/COMPLIANCE ACTIVITY (Integrated Compliance Information System) - ICIS-03-2004-0044, FORMAL ENFORCEMENT ACTION (Integrated Compliance Information System) - ICIS-03-2004-0044, FORMAL ENFORCEMENT ACTION (National Center for Education Statistics) - STATE ID-6033 Organizations: THURGOOD MARSHALL ACADEMY PCS AGY (SCHOOL DISTRICT)
Alternative names: THURGOOD MARSHALL ACADEMY PUBLIC CHARTER SCHOOL
AMOCO OIL COMPANY (2801 ALABAMA AVENUE SOUTHEAST in WASHINGTON, DC)
AIR MINOR (AIRS/AFS) (Integrated Compliance Information System) - ICIS-03-1994-0232, FORMAL ENFORCEMENT ACTION Conditionally Exempt Small Quantity Generators, less than 100 kg/month of hazardous waste (Resource Conservation and Recovery Act (tracking hazardous waste)) - notification Business SIC classification: GASOLINE SERVICE STATIONS Organizations: L A ROLLMAN (CONTACT/OWNER)
Alternative names: HILLCREST AMOCO
WASHINGTON DC MERCURY INCIDENT (3401 4TH STREET SOUTHEAST in WASHINGTON, DC)
SUPERFUND (Superfund database) (National Center for Education Statistics) - STATE ID-2058 Conditionally Exempt Small Quantity Generators, less than 100 kg/month of hazardous waste (Resource Conservation and Recovery Act (tracking hazardous waste)) - notification Organizations: OPERNAME (CONTACT/OPERATOR)
, DC GOVERNMENT (CONTACT/OWNER)
, DISTRICT OF COLUMBIA PUB SCHLS (SCHOOL DISTRICT)
Alternative names: BALLOU S H S, Ballou Senior High School, BALLOU STAY
HART MIDDLE SCHOOL (601 MISSISSIPPI AVE SE in WASHINGTON, DC)
(Geographic Names Information System) (National Center for Education Statistics) - STATE ID-4518 Conditionally Exempt Small Quantity Generators, less than 100 kg/month of hazardous waste (Resource Conservation and Recovery Act (tracking hazardous waste)) - notification Organizations: OPERNAME (CONTACT/OPERATOR)
, D C GOVERNMENT (CONTACT/OWNER)
, DISTRICT OF COLUMBIA PUB SCHLS (SCHOOL DISTRICT)
Alternative names: HART J H S, HART JUNIOR HIGH SCHOOL
HENDLEY ELEMENTARY SCHOOL (425 CHESAPEAKE ST SE in WASHINGTON, DC)
(Geographic Names Information System) (National Center for Education Statistics) - STATE ID-5532 Organizations: DISTRICT OF COLUMBIA PUB SCHLS (SCHOOL DISTRICT)
CHESAPEAKE CLEANERS (605 CHESAPEAKE STREET, S. E. in WASHINGTON, DC)
AIR MINOR (AIRS/AFS) HAZARDOUS WASTE BIENNIAL REPORTER (Resource Conservation and Recovery Act (tracking hazardous waste)) (Resource Conservation and Recovery Act (tracking hazardous waste)) Business SIC classification: DRYCLEANING PLANTS, EXCEPT RUG CLEANING Organizations: OPERNAME (CONTACT/OPERATOR)
, CHUNG, PHILIP (CONTACT/OWNER)
M C TERRELL ELEMENTARY SCHOOL (3301 WHEELER RD SE, in WASHINGTON, DC)
(Geographic Names Information System) (National Center for Education Statistics) - STATE ID-5882 Organizations: DISTRICT OF COLUMBIA PUB SCHLS (SCHOOL DISTRICT)
SIMON ELEMENTARY SCHOOL (401 MISSISSIPPI AVE SE in WASHINGTON, DC)
(Geographic Names Information System) (National Center for Education Statistics) - STATE ID-5808 Organizations: DISTRICT OF COLUMBIA PUB SCHLS (SCHOOL DISTRICT)
DRAPER ELEMENTARY SCHOOL (908 WAHLER PL SE, in WASHINGTON, DC)
(Geographic Names Information System) (National Center for Education Statistics) - STATE ID-5418 Organizations: DISTRICT OF COLUMBIA PUB SCHLS (SCHOOL DISTRICT)
FEREBEE-HOPE ELEMENTARY SCHOOL (3999 8TH ST SE in WASHINGTON, DC)
(Geographic Names Information System) (National Center for Education Statistics) - STATE ID-5936 Organizations: DISTRICT OF COLUMBIA PUB SCHLS (SCHOOL DISTRICT)
MALCOLM X ELEMENTARY SCHOOL (1351 ALABAMA AVE SE in WASHINGTON, DC)
(Geographic Names Information System) (National Center for Education Statistics) - STATE ID-5010 Organizations: DISTRICT OF COLUMBIA PUB SCHLS (SCHOOL DISTRICT)
PATTERSON ELEMENTARY SCHOOL (4300 S CAPITOL TER SW in WASHINGTON, DC)
(Geographic Names Information System) (National Center for Education Statistics) - STATE ID-5716 Organizations: DISTRICT OF COLUMBIA PUB SCHLS (SCHOOL DISTRICT)
Housing units lacking complete plumbing facilities: 1.9% Housing units lacking complete kitchen facilities: 0.8%
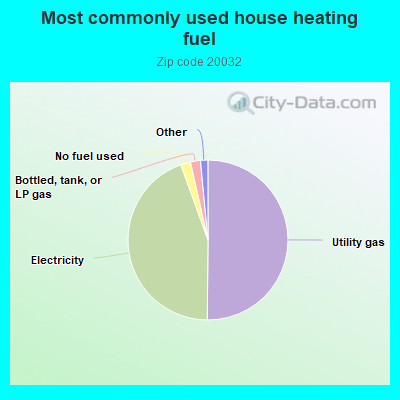
50.1%Utility gas
44.3%Electricity
2.0%No fuel used
2.0%Bottled, tank, or LP gas
0.8%Fuel oil, kerosene, etc.
0.6%Other fuel
Population in 1990: 40,265.
Place of birth for U.S.-born residents:
This state: 22,929
Northeast: 2,326
Midwest: 950
South: 9,497
West: 1,277
56% of the 20032 zip code residents lived in the same house 5 years ago. Out of people who lived in different houses, 77% lived in this county. Out of people who lived in different counties, 50% lived in District of Columbia.
83% of the 20032 zip code residents lived in the same house 1 year ago. Out of people who lived in different houses, 47% moved from this county. Out of people who lived in different houses, 49% moved from different state. Out of people who lived in different houses, 3% moved from abroad.
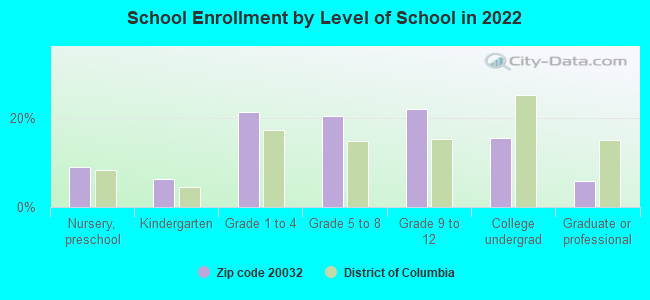
Private vs. public school enrollment:
Students in private schools in grades 1 to 8 (elementary and middle school): 1,336
Here:
28.3%
District of Columbia:
22.5%
Students in private schools in grades 9 to 12 (high school): 258
Here:
10.8%
District of Columbia:
21.7%
Students in private undergraduate colleges: 405
Here:
29.3%
District of Columbia:
75.9%
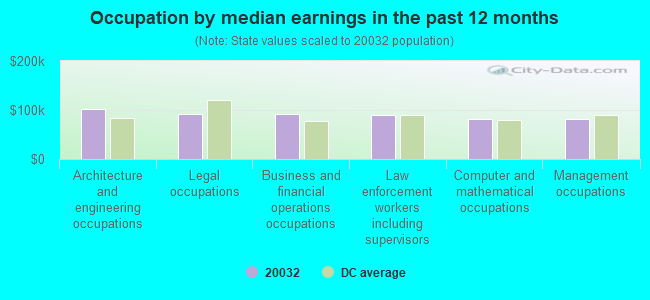
Occupation by median earnings in the past 12 months ($)
102,095Architecture and engineering occupations
92,267Legal occupations
91,348Business and financial operations occupations
89,712Law enforcement workers including supervisors
82,528Computer and mathematical occupations
81,533Management occupations
Companies with federal contracts located in this zip code (WASHINGTON, DC):
SUPERIOR LANDSCAPING COMPANY, (17B MISSISSIPPI AVE SE; small business) : $7,522,329 in 52 contractsfrom 2003 to 2006
Contracts for Landscaping/Groundskeeping Services, Maintenance, Repair or Alteration of Real Property -- Unimproved Real Property (Land), Facilities Operations Support Services, Snow Removal/Salt Service (also spreading aggregate or other snow melting material), and moreby Air Force, Navy Signed by year:2000: $0; 2001: $0; 2002: $0; 2003: $1,038,416; 2004: $3,224,242; 2005: $2,906,116; 2006: $353,555.
Biggest contracts:
$1,753,524 with Air Force for Landscaping/Groundskeeping Services. Taking place in MD. Signed on 2005-12-14. Completion date: 2006-09-30.
$1,525,764, same as above.Signed on 2004-10-01. Completion date: 2005-09-30.
$745,199, same as above.Signed on 2004-03-01. Completion date: 2008-09-30.
$624,001 with Navy for Landscaping/Groundskeeping Services. Signed on 2003-04-14. Completion date: 2004-04-30.
COMPUTER SYSTEMS MANAGEMENT, I (3215 MARTIN LUTHER KING J; small business) : $866,000 in 4 contractsfrom 2000 to 2001
$487,000 with ENERGY, Department of for Program Management/Support Services. Taking place in VA. Signed on 2000-08-15. Completion date: 2000-09-15.
$224,000, same as above.Signed on 2000-09-15. Completion date: 2000-11-15.
$150,000, same as above.Signed on 2001-01-15. Completion date: 2001-01-15.
$5,000, same as above.Signed on 2001-09-15. Completion date: 2001-01-15.
INNOVATIVE NETWORK SOLUTIONS (3130-B MARTIN LUTHER KING; small business) : $304,524 in 12 contractsfrom 2002 to 2004
Contracts for ADPE System Configuration, ADP Central Processing Unit (CPU, Computer), Analog by Army Signed by year:2000: $0; 2001: $0; 2002: $149,820; 2003: $146,164; 2004: $8,540; 2005: $0; 2006: $0.
Biggest contracts:
$149,820 with Army for ADPE System Configuration. Taking place in VA. Signed on 2002-12-11. Completion date: 2002-12-16.
$41,439, same as above.Signed on 2003-06-24. Completion date: 2003-07-30.
$35,506 with Army for ADPE System Configuration. Signed on 2003-09-17. Completion date: 2003-09-30.
$16,800, same as above.Signed on 2003-09-05. Completion date: 2003-09-26.
COMVET MEDICAL TECHNOLOGIES (419 MELLON ST SE; small business) : $236,193 in 5 contractsfrom 2004 to 2006
Contracts for Nursing Services by Army Signed by year:2000: $0; 2001: $0; 2002: $0; 2003: $0; 2004: $548,550; 2005: -$308,965; 2006: -$3,392.
Biggest contracts:
$548,550 with Army for Nursing Services. Taking place in GA. Signed on 2004-11-22. Completion date: 2005-09-30.
$55,890, same as above.Signed on 2005-11-03. Completion date: 2005-09-30.
-$3,392, same as above.Signed on 2006-03-01. Completion date: 2005-09-30.
-$12,930, same as above.Signed on 2005-09-20. Completion date: 2005-09-30.
HUBBARD CONSULTING (23 ARMOR CT SW; small business) : $146,640 in 6 contractsfrom 2004 to 2006
Contracts for Educational Services by Air Force Signed by year:2000: $0; 2001: $0; 2002: $0; 2003: $0; 2004: $24,955; 2005: $25,285; 2006: $96,400.
Biggest contracts:
$71,400 with Air Force for Educational Services. Signed on 2006-05-25. Completion date: 2006-09-30.
$25,000, same as above.Signed on 2006-05-25. Completion date: 2006-09-30.
$24,955, same as above.Signed on 2004-11-05. Completion date: 2005-05-31.
$9,960, same as above.Signed on 2005-12-12. Completion date: 2006-02-28.
ROBBIN L HOBBINS (22 WESTOVER AVE; small business) : $74,740 in 2 contractsfrom 2004 to 2005
$49,780 with Air Force for Educational Services. Signed on 2005-05-06. Completion date: 2005-05-09.
$24,960, same as above.Signed on 2004-11-04. Completion date: 2005-02-15.
NAVY, UNITED STATES DEPARTMENT (12 BOWLINE GREEN SW) : $48,870 in 5 contractsfrom 2004 to 2005
Contracts for Lodging - Hotel/Motel, Lease or Rental of Facilities -- Miscellaneous Buildings by Army, Navy Signed by year:2000: $0; 2001: $0; 2002: $0; 2003: $0; 2004: $45,442; 2005: $3,428; 2006: $0.
Biggest contracts:
$34,992 with Army for Lodging - Hotel/Motel. Signed on 2004-06-08. Completion date: 2004-08-06.
$4,225, same as above.Signed on 2004-05-18. Completion date: 2004-06-19.
$4,225, same as above.Signed on 2004-05-18. Completion date: 2004-07-17.
$3,428 with Army for Lodging - Hotel/Motel. Taking place in CA. Signed on 2005-05-05. Completion date: 2005-05-10.
MAXWELL, KENNETH (3464 C MARCH CIRCLE; small business)
$29,460 with Air Force for Other Professional Services. Signed on 2003-10-01. Completion date: 2004-09-30.
RIFENBERG, AMY (3428 A LACKLAND WAY; small business)
$23,220 with Air Force for Chaplain Services. Signed on 2004-10-01. Completion date: 2005-09-30.
Top industries in this zip code by the number of employees in 2005:
Health Care and Social Assistance: General Medical and Surgical Hospitals (over 1000 employees: 1 establishment, 250-499 employees: 1 establishment)
Health Care and Social Assistance: Child Day Care Services (100-249: 1, 20-49: 3, 10-19: 1, 5-9: 7, 1-4: 1)
2004 - 2018 National Fire Incident Reporting System (NFIRS) incidents
Based on the data from the years 2004 - 2018 the average number of fires per year is 104. The highest number of reported fires - 256 took place in 2017, and the least - 0 in 2006. The data has an increasing trend.
When looking into fire subcategories, the most incidents belonged to: Structure Fires (45.2%), and Outside Fires (32.0%).
Fire incident types reported to NFIRS in Zip Code 20032


 Nearest zip codes: 20373, 20745, 20319, 20593, 20020, 20024.


 Based on the data from the years 2004 - 2018 the average number of fires per year is 104. The highest number of reported fires - 256 took place in 2017, and the least - 0 in 2006. The data has an increasing trend.
 When looking into fire subcategories, the most incidents belonged to: Structure Fires (45.2%), and Outside Fires (32.0%).