Estimated zip code population in 2022: 51,096 Zip code population in 2010: 46,340 Zip code population in 2000: 33,557
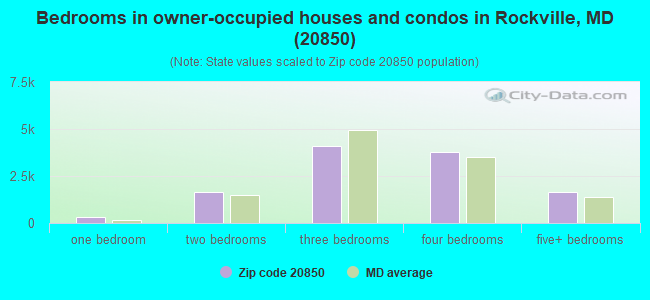
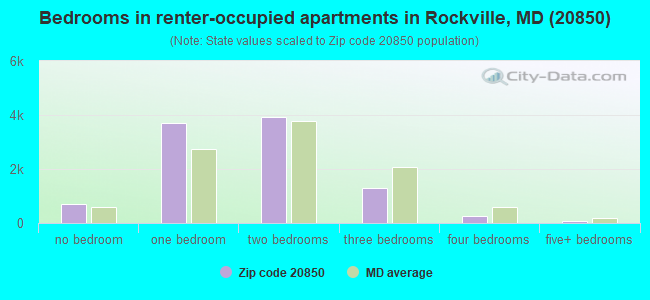
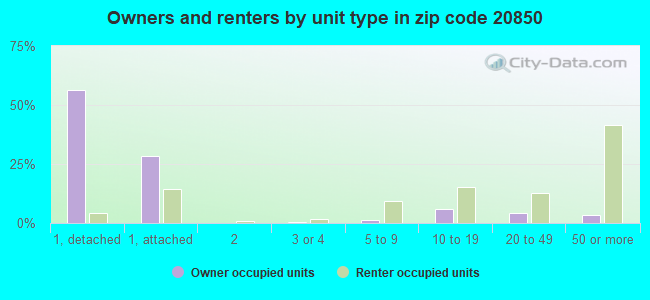
Houses and condos: 22,577 Renter-occupied apartments: 9,929
% of renters here:
46%
State:
32%
March 2022 cost of living index in zip code 20850: 183.4 (very high, U.S. average is 100)
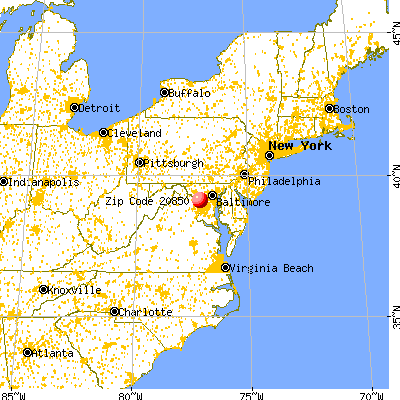
Land area: 14.1 sq. mi. Water area: 0.1 sq. mi.
Population density: 3,625 people per square mile
(average).
OSM Map
General Map
Google Map
MSN Map
OSM Map
General Map
Google Map
MSN Map
OSM Map
General Map
Google Map
MSN Map
OSM Map
General Map
Google Map
MSN Map
Please wait while loading the map...
Real estate property taxes paid for housing units in 2022:
This zip code:
1.0% ($6,886)
Maryland:
0.9% ($3,777)
Median real estate property taxes paid for housing units with mortgages in 2022: $6,984 (1.0%) Median real estate property taxes paid for housing units with no mortgage in 2022: $6,695 (1.0%)
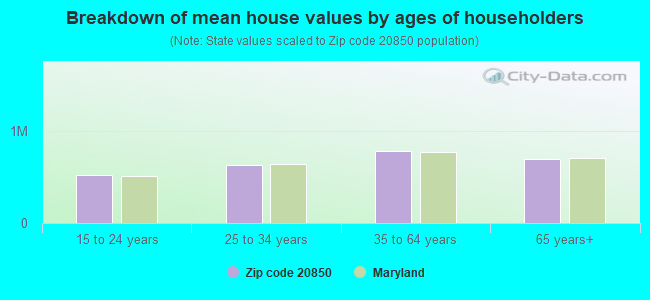
Estimated median house/condo value in 2022: $696,178
20850:
$696,178
Maryland:
$398,100
According to our research of Maryland and other state lists, there were 30 registered sex offenders living in 20850 zip code as of April 27, 2024. The ratio of all residents to sex offenders in zip code 20850 is 1,633 to 1. The ratio of registered sex offenders to all residents in this zip code is lower than the state average.
Median resident age:
This zip code:
40.8 years
Maryland median age:
39.7 years
Average household size:
This zip code:
2.3 people
Maryland:
2.5 people
Averages for the 2020 tax year for zip code 20850, filed in 2021:
Average Adjusted Gross Income (AGI) in 2020: $129,043 (Individual Income Tax Returns)
Here:
$129,043
State:
$86,905
Salary/wage: $104,991 (reported on 79.4% of returns)
Here:
$104,991
State:
$73,953
(% of AGI for various income ranges: 1177.8% for AGIs below $25k, 3839.5% for AGIs $25k-50k, 7444.7% for AGIs $50k-75k, 10396.8% for AGIs $75k-100k, 20291.5% for AGIs $100k-200k, 84750.1% for AGIs over 200k)
Taxable interest for individuals: $2,053 (reported on 49.2% of returns)
This zip code:
$2,053
Maryland:
$1,528
(% of AGI for various income ranges: 33.5% for AGIs below $25k, 39.9% for AGIs $25k-50k, 57.4% for AGIs $50k-75k, 116.5% for AGIs $75k-100k, 221.5% for AGIs $100k-200k, 1114.8% for AGIs over 200k)
Ordinary dividends: $10,043 (reported on 35.4% of returns)
Here:
$10,043
State:
$8,028
(% of AGI for various income ranges: 57.1% for AGIs below $25k, 85.9% for AGIs $25k-50k, 139.4% for AGIs $50k-75k, 282.4% for AGIs $75k-100k, 623.0% for AGIs $100k-200k, 4866.1% for AGIs over 200k)
Net capital gain/loss in AGI: +$23,402 (reported on 33.9% of returns)
Here:
+$23,402
State:
+$25,238
(% of AGI for various income ranges: 32.1% for AGIs below $25k, 64.7% for AGIs $25k-50k, 121.0% for AGIs $50k-75k, 432.3% for AGIs $75k-100k, 755.1% for AGIs $100k-200k, 13502.3% for AGIs over 200k)
Profit/loss from business: +$20,370 (reported on 20.9% of returns)
Here:
+$20,370
State:
+$11,398
(% of AGI for various income ranges: 253.1% for AGIs below $25k, 278.3% for AGIs $25k-50k, 290.6% for AGIs $50k-75k, 279.8% for AGIs $75k-100k, 805.2% for AGIs $100k-200k, 4619.8% for AGIs over 200k)
Taxable individual retirement arrangement distribution: $30,062 (reported on 9.3% of returns)
20850:
$30,062
Maryland:
$20,944
(% of AGI for various income ranges: 42.2% for AGIs below $25k, 82.3% for AGIs $25k-50k, 187.0% for AGIs $50k-75k, 389.4% for AGIs $75k-100k, 780.1% for AGIs $100k-200k, 2806.6% for AGIs over 200k)
Self-employed (Keogh) retirement plans: $30,081 (reported on 2.1% of returns)
20850:
$30,081
Maryland:
$29,558
(% of AGI for various income ranges: 7.6% for AGIs $25k-50k, 25.4% for AGIs $50k-75k, 84.4% for AGIs $100k-200k, 1027.7% for AGIs over 200k)
Total itemized deductions: $33,412 (reported on 23.8% of returns)
Here:
$33,412
State:
$30,672
(% of AGI for various income ranges: 160.1% for AGIs below $25k, 300.3% for AGIs $25k-50k, 554.2% for AGIs $50k-75k, 1169.6% for AGIs $75k-100k, 2176.6% for AGIs $100k-200k, 7595.0% for AGIs over 200k)
Charity contributions: $8,646 (reported on 19.5% of returns)
Here:
$8,646
State:
$9,065
(% of AGI for various income ranges: 9.6% for AGIs below $25k, 41.7% for AGIs $25k-50k, 78.8% for AGIs $50k-75k, 171.8% for AGIs $75k-100k, 320.0% for AGIs $100k-200k, 2222.3% for AGIs over 200k)
Taxes paid: $9,059 (reported on 23.6% of returns)
20850:
$9,059
State:
$8,475
(% of AGI for various income ranges: 24.7% for AGIs below $25k, 69.3% for AGIs $25k-50k, 157.1% for AGIs $50k-75k, 359.8% for AGIs $75k-100k, 708.0% for AGIs $100k-200k, 1766.5% for AGIs over 200k)
Earned income credit: $1,805 (reported on 8.1% of returns)
Here:
$1,805
State:
$2,151
(% of AGI for various income ranges: 62.8% for AGIs below $25k, 51.1% for AGIs $25k-50k, 0.6% for AGIs $50k-75k)
Percentage of individuals using paid preparers for their 2020 taxes: 89.2%
Here:
89%
State:
90%
(% for various income ranges: 86.1% for AGIs below $25k, 90.8% for AGIs $25k-50k, 89.9% for AGIs $50k-75k, 90.8% for AGIs $75k-100k, 89.8% for AGIs $100k-200k, 89.9% for AGIs over 200k)
Averages for the 2012 tax year for zip code 20850, filed in 2013:
Average Adjusted Gross Income (AGI) in 2012: $112,624 (Individual Income Tax Returns)
Here:
$112,624
State:
$72,703
Salary/wage: $92,563 (reported on 82.5% of returns)
Here:
$92,563
State:
$62,228
(% of AGI for various income ranges: 74.4% for AGIs below $25k, 81.4% for AGIs $25k-50k, 78.2% for AGIs $50k-75k, 75.6% for AGIs $75k-100k, 76.5% for AGIs $100k-200k, 58.2% for AGIs over 200k)
Taxable interest for individuals: $1,846 (reported on 54.5% of returns)
This zip code:
$1,846
Maryland:
$1,413
(% of AGI for various income ranges: 1.5% for AGIs below $25k, 0.8% for AGIs $25k-50k, 0.9% for AGIs $50k-75k, 0.8% for AGIs $75k-100k, 0.7% for AGIs $100k-200k, 1.0% for AGIs over 200k)
Ordinary dividends: $8,835 (reported on 36.5% of returns)
Here:
$8,835
State:
$6,933
(% of AGI for various income ranges: 3.9% for AGIs below $25k, 1.8% for AGIs $25k-50k, 2.0% for AGIs $50k-75k, 2.1% for AGIs $75k-100k, 2.1% for AGIs $100k-200k, 3.6% for AGIs over 200k)
Net capital gain/loss in AGI: +$14,074 (reported on 31.7% of returns)
Here:
+$14,074
State:
+$14,830
(% of AGI for various income ranges: 0.2% for AGIs below $25k, 0.2% for AGIs $25k-50k, 0.4% for AGIs $50k-75k, 0.6% for AGIs $75k-100k, 1.2% for AGIs $100k-200k, 7.3% for AGIs over 200k)
Profit/loss from business: +$24,467 (reported on 19.8% of returns)
Here:
+$24,467
State:
+$12,606
(% of AGI for various income ranges: 13.1% for AGIs below $25k, 4.9% for AGIs $25k-50k, 3.3% for AGIs $50k-75k, 3.0% for AGIs $75k-100k, 4.0% for AGIs $100k-200k, 4.3% for AGIs over 200k)
Taxable individual retirement arrangement distribution: $21,525 (reported on 11.2% of returns)
20850:
$21,525
Maryland:
$17,065
(% of AGI for various income ranges: 2.7% for AGIs below $25k, 1.9% for AGIs $25k-50k, 2.1% for AGIs $50k-75k, 2.4% for AGIs $75k-100k, 2.6% for AGIs $100k-200k, 1.9% for AGIs over 200k)
Self-employment retirement plans: $25,594 (reported on 2.5% of returns)
20850:
$25,594
Maryland:
$24,439
(% of AGI for various income ranges: 0.3% for AGIs below $25k, 0.2% for AGIs $50k-75k, 0.2% for AGIs $75k-100k, 0.4% for AGIs $100k-200k, 0.9% for AGIs over 200k)
Total itemized deductions: $34,160 (20% of AGI, reported on 55.6% of returns)
Here:
$34,160
State:
$27,886
Here:
19.9% of AGI
State:
22.8% of AGI
(% of AGI for various income ranges: 18.1% for AGIs below $25k, 14.6% for AGIs $25k-50k, 17.6% for AGIs $50k-75k, 19.8% for AGIs $75k-100k, 19.7% for AGIs $100k-200k, 14.8% for AGIs over 200k)
Charity contributions: $4,317 (reported on 45.8% of returns)
Here:
$4,317
State:
$4,452
(% of AGI for various income ranges: 0.9% for AGIs below $25k, 1.3% for AGIs $25k-50k, 1.6% for AGIs $50k-75k, 1.8% for AGIs $75k-100k, 1.9% for AGIs $100k-200k, 1.8% for AGIs over 200k)
Taxes paid: $16,784 (reported on 55.2% of returns)
20850:
$16,784
State:
$11,690
(% of AGI for various income ranges: 3.8% for AGIs below $25k, 4.0% for AGIs $25k-50k, 5.9% for AGIs $50k-75k, 7.9% for AGIs $75k-100k, 9.3% for AGIs $100k-200k, 8.7% for AGIs over 200k)
Earned income credit: $1,860 (reported on 8.1% of returns)
Here:
$1,860
State:
$2,199
(% of AGI for various income ranges: 4.1% for AGIs below $25k, 0.6% for AGIs $25k-50k)
Percentage of individuals using paid preparers for their 2012 taxes: 49.1%
Here:
49%
State:
52%
(% for various income ranges: 48.8% for AGIs below $25k, 47.6% for AGIs $25k-50k, 46.4% for AGIs $50k-75k, 48.4% for AGIs $75k-100k, 46.6% for AGIs $100k-200k, 59.4% for AGIs over 200k)
Averages for the 2004 tax year for zip code 20850, filed in 2005:
Average Adjusted Gross Income (AGI) in 2004: $83,906 (Individual Income Tax Returns)
Here:
$83,906
State:
$60,339
Salary/wage: $71,551 (reported on 83.5% of returns)
Here:
$71,551
State:
$52,211
(% of AGI for various income ranges: 265.0% for AGIs below $10k, 77.6% for AGIs $10k-25k, 82.3% for AGIs $25k-50k, 78.0% for AGIs $50k-75k, 79.2% for AGIs $75k-100k, 66.3% for AGIs over 100k)
Taxable interest for individuals: $1,841 (reported on 61.9% of returns)
This zip code:
$1,841
Maryland:
$1,701
(% of AGI for various income ranges: 15.8% for AGIs below $10k, 2.2% for AGIs $10k-25k, 1.4% for AGIs $25k-50k, 1.3% for AGIs $50k-75k, 1.3% for AGIs $75k-100k, 1.3% for AGIs over 100k)
Taxable dividends: $4,111 (reported on 39.5% of returns)
Here:
$4,111
State:
$4,235
(% of AGI for various income ranges: 18.7% for AGIs below $10k, 2.1% for AGIs $10k-25k, 1.3% for AGIs $25k-50k, 1.8% for AGIs $50k-75k, 1.6% for AGIs $75k-100k, 2.0% for AGIs over 100k)
Net capital gain/loss: +$10,648 (reported on 35.0% of returns)
Here:
+$10,648
State:
+$15,888
(% of AGI for various income ranges: -3.9% for AGIs below $10k, 0.2% for AGIs $10k-25k, 0.6% for AGIs $25k-50k, 0.7% for AGIs $50k-75k, 1.2% for AGIs $75k-100k, 6.2% for AGIs over 100k)
Profit/loss from business: +$21,320 (reported on 17.9% of returns)
Here:
+$21,320
State:
+$12,221
(% of AGI for various income ranges: 19.3% for AGIs below $10k, 6.7% for AGIs $10k-25k, 3.6% for AGIs $25k-50k, 3.3% for AGIs $50k-75k, 4.2% for AGIs $75k-100k, 4.7% for AGIs over 100k)
IRA payment deduction: $3,249 (reported on 3.6% of returns)
20850:
$3,249
Maryland:
$2,968
(% of AGI for various income ranges: 1.4% for AGIs below $10k, 0.4% for AGIs $10k-25k, 0.4% for AGIs $25k-50k, 0.2% for AGIs $50k-75k, 0.2% for AGIs $75k-100k, 0.1% for AGIs over 100k)
Self-employed pension: $17,405 (reported on 2.9% of returns)
Here:
$17,405
Maryland:
$17,155
(% of AGI for various income ranges: 1.0% for AGIs below $10k, 0.1% for AGIs $25k-50k, 0.3% for AGIs $50k-75k, 0.4% for AGIs $75k-100k, 0.8% for AGIs over 100k)
Total itemized deductions: $27,800 (21% of AGI, reported on 56.2% of returns)
Here:
$27,800
State:
$22,960
Here:
21.5% of AGI
State:
23.3% of AGI
(% of AGI for various income ranges: 67.3% for AGIs below $10k, 18.9% for AGIs $10k-25k, 19.1% for AGIs $25k-50k, 21.9% for AGIs $50k-75k, 22.2% for AGIs $75k-100k, 17.3% for AGIs over 100k)
Charity contributions deductions: $3,743 (3% of AGI, reported on 48.9% of returns)
Here:
$3,743
State:
$4,031
Here:
2.7% of AGI
State:
3.9% of AGI
(% of AGI for various income ranges: 1.5% for AGIs below $10k, 1.6% for AGIs $10k-25k, 2.1% for AGIs $25k-50k, 2.3% for AGIs $50k-75k, 2.2% for AGIs $75k-100k, 2.2% for AGIs over 100k)
Total tax: $16,429 (reported on 82.8% of returns)
20850:
$16,429
State:
$10,167
(% of AGI for various income ranges: 10.0% for AGIs below $10k, 4.6% for AGIs $10k-25k, 7.8% for AGIs $25k-50k, 10.2% for AGIs $50k-75k, 11.3% for AGIs $75k-100k, 19.5% for AGIs over 100k)
Earned income credit: $1,520 (reported on 7.1% of returns)
Here:
$1,520
State:
$1,700
Percentage of individuals using paid preparers for their 2004 taxes: 50.3%
Here:
50%
State:
55%
(% for various income ranges: 47.2% for AGIs below $10k, 53.8% for AGIs $10k-25k, 49.2% for AGIs $25k-50k, 49.8% for AGIs $50k-75k, 47.4% for AGIs $75k-100k, 52.5% for AGIs over 100k)
Likely homosexual households (counted as self-reported same-sex unmarried-partner households)
Lesbian couples: 0.2% of all households
Gay men: 0.3% of all households
Household received Food Stamps/SNAP in the past 12 months: 1,725 Household did not receive Food Stamps/SNAP in the past 12 months: 19,648
Women who had a birth in the past 12 months: 576 (354 now married, 221 unmarried) Women who did not have a birth in the past 12 months: 12,282 (5,330 now married, 6,953 unmarried)
Housing units in zip code 20850 with a mortgage: 7,932 (1,118 second mortgage, 158 home equity loan, 907 both second mortgage and home equity loan) Houses without a mortgage: 123
Median monthly owner costs for units with a mortgage: $2,974 Median monthly owner costs for units without a mortgage: $1,020
Residents with income below the poverty level in 2022:
This zip code:
7.8%
Whole state:
9.6%
Residents with income below 50% of the poverty level in 2022:
This zip code:
4.5%
Whole state:
4.7%
Median number of rooms in houses and condos:
Here:
7.2
State:
7.3
Median number of rooms in apartments:
Here:
3.6
State:
4.2
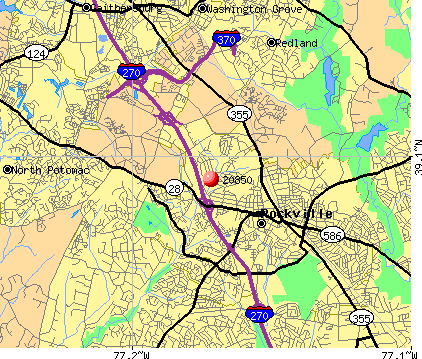
Notable locations in this zip code not listed on our city pages
Notable locations in zip code 20850: Decoverly Industrial Park (A), Lakewood Country Club (B), Red Gate Golf Course (C), Danac Technical Industrial Park (D), Washington National Pike Industrial Park (E), 270 Industrial Park (F), Dicovery Industrial Park (G), Key West Corporation Industrial Center Park (H), Key West Research Center Industrial Park (I), Shady Grove Executive Center (J), Shady Grove Complex Industrial Center (K), Research West Industrial Park (L), Research Office Center (M), Shady Grove Life Sciences Center (N), Shady Grove Medical Village (O), Redgate Industrial Park (P), Colter Industrial Park (Q), Rockville Metro Station (R), Derwood Industrial Park (S), Shady Grove Music Fair Theater (T). Display/hide their locations on the map
Shopping Centers: One Stop Shopping Center (1), Woodley Gardens Park Shopping Center (2), Rockshire Shopping Center (3), College Plaza Shopping Center (4), Travilah Square Shopping Center (5). Display/hide their locations on the map
Churches in zip code 20850 include: Rockville Free Methodist Church (A), Saint Marys Church (B), Assembly of God Church (C), Mount Calvary Baptist Church (D), First Baptist Church (E), Latvian Lutheran Church (F), Rockville Church of Christ (G), Unitarian of Rockville Church (H), Temple Beth Ami Synagogue (I). Display/hide their locations on the map
Parks in zip code 20850 include: Northeast Park (1), Monument Park (2), Maryvale Park (3), Lincoln Terrace Park (4), Glenora Park (5), David Scul Park (6), College Garden Park (7), Bullards Park (8), Anderson Park (9). Display/hide their locations on the map
7,314 married couples with children.
2,232 single-parent households (572 men, 1,660 women).
57.1% of residents of 20850 zip code speak English at home.
8.8% of residents speak Spanish at home (62% very well, 20% well, 11% not well, 8% not at all).
13.0% of residents speak other Indo-European language at home (73% very well, 19% well, 7% not well, 2% not at all).
19.2% of residents speak Asian or Pacific Island language at home (55% very well, 26% well, 15% not well, 4% not at all).
2.8% of residents speak other language at home (72% very well, 26% well, 1% not well).
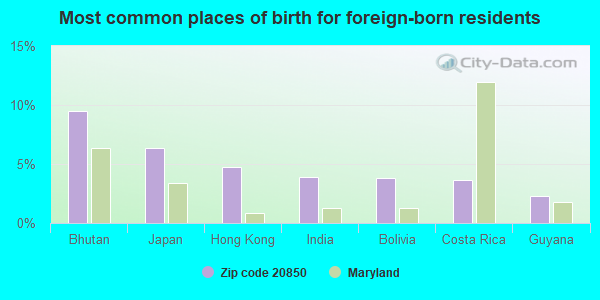
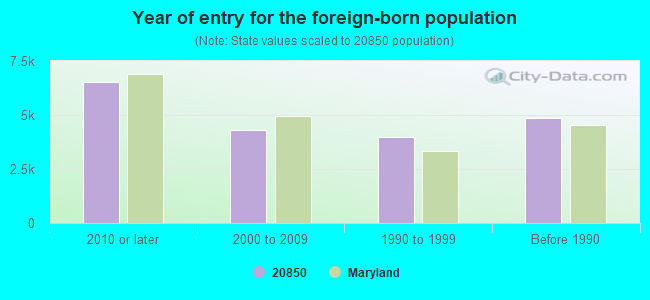
Foreign born population: 18,950 (37.1%) (62.1% of them are naturalized citizens)
Major facilities with environmental interests located in this zip code:
PACIFIC ENERGY (600 EAST GUDE DRIVE in ROCKVILLE, MD)
STATE MASTER (Maryland Permits tracking) - NPDES STORMWATER PERMIT STATE MASTER (Maryland Air Emissions Database) - AIR MAJOR STATE MASTER (Maryland Air Emissions Database) - AIR MINOR CRITERIA AND HAZARDOUS AIR POLLUTANT INVENTORY (Inventory of air pollution sources) (Resource Conservation and Recovery Act (tracking hazardous waste)) Business SIC classification: REFUSE SYSTEMS Business NAICS classification: OTHER NONHAZARDOUS WASTE TREATMENT AND DISPOSAL. Alternative names: GUDE LANDFILL / PACIFIC ENERGY, OGDEN POWER PACIFIC, PACIFIC ENERGY/GUDE
REDLAND GENSTAR - ROCKVILLE (14824 SOUTHLAWN LANE in ROCKVILLE, MD)
AIR MINOR (AIRS/AFS) STATE MASTER (Maryland Permits tracking) - National Pollutant Discharge Elimination System Permit STATE MASTER (Maryland Air Emissions Database) - AIR MINOR Conditionally Exempt Small Quantity Generators, less than 100 kg/month of hazardous waste (Resource Conservation and Recovery Act (tracking hazardous waste)) - notification Business SIC classification: ASPHALT PAVING MIXTURES AND BLOCKS; READY-MIXED CONCRETE Business NAICS classification: CONSTRUCTION SAND AND GRAVEL MINING. Organizations: LAFARGE MID ATLANTIC (CONTACT/OPERATOR)
, GENSTAR STONE PRODUCTS COMPANY (CONTACT/OWNER)
Alternative names: GENSTAR STONE PRODUCTS, LAFARGE - ROCKVILLE READY MIX, REDLAND GENSTAR INC-ROCKVILLE READY MIX, REDLAND GENSTAR - SOUTHLAWN, SMITH, A.H. ASPHALT
F O DAY BITUMINOUS COMPANY (13900 PINEY MEETINGHOUSE ROAD in ROCKVILLE, MD)
AIR SYNTHETIC MINOR (AIRS/AFS) (Integrated Compliance Information System) - ICIS-03-1986-0138, FORMAL ENFORCEMENT ACTION STATE MASTER (Maryland Permits tracking) - OIL CONTROL COMPLIANCE ACTIVITY (Tracking inspections of insecticide, fungicide, and rodenticide, and toxic substances) CRITERIA AND HAZARDOUS AIR POLLUTANT INVENTORY (Inventory of air pollution sources) (Resource Conservation and Recovery Act (tracking hazardous waste)) Business SIC classification: ASPHALT PAVING MIXTURES AND BLOCKS; READY-MIXED CONCRETE Business NAICS classification: ASPHALT PAVING MIXTURE AND BLOCK MANUFACTURING. Organizations: OPERNAME (CONTACT/OPERATOR)
, DAY, F O BITUMINOUS CO (CONTACT/OWNER)
Alternative names: DAY, F O BITUMINOUS CO, F.O. DAY BITUMINOUS CO. - PINEY MEETING HOUSE RD., F.O. DAY-PINEY MEETINGHOUSE
MONTGOMERY COUNTY PUBLIC SCHOOLS (850 HUNGERFORD DRIVE in ROCKVILLE, MD)
ENFORCEMENT/COMPLIANCE ACTIVITY (Integrated Compliance Information System) - ICIS-03-1986-0247, FORMAL ENFORCEMENT ACTION (Integrated Compliance Information System) - ICIS-03-1986-0247, FORMAL ENFORCEMENT ACTION ENFORCEMENT/COMPLIANCE ACTIVITY (Integrated Compliance Information System) STATE MASTER (Maryland Permits tracking) - OIL CONTROL COMPLIANCE ACTIVITY (Tracking inspections of insecticide, fungicide, and rodenticide, and toxic substances) Business SIC classification: ELEMENTARY AND SECONDARY SCHOOLS Business NAICS classification: ALL OTHER MISCELLANEOUS SCHOOLS AND INSTRUCTION. Alternative names: MONTGOMERY COUNTY SCHOOL DISTRICT
LAFARGE SOUTHLAWN (14811 SOUTHLAWN LANE in ROCKVILLE, MD)
AIR SYNTHETIC MINOR (AIRS/AFS) STATE MASTER (Maryland Permits tracking) - National Pollutant Discharge Elimination System Permit, OIL CONTROL STATE MASTER (Maryland Air Emissions Database) - AIR MAJOR CRITERIA AND HAZARDOUS AIR POLLUTANT INVENTORY (Inventory of air pollution sources) Small Quantity Generators, between 100 kg and 1000 kg of hazardous waste/month (Resource Conservation and Recovery Act (tracking hazardous waste)) - notification Business SIC classification: ASPHALT PAVING MIXTURES AND BLOCKS Business NAICS classification: OTHER CRUSHED AND BROKEN STONE MINING AND QUARRYING.; ASPHALT PAVING MIXTURE AND BLOCK MANUFACTURING. Organizations: OPERNAME (CONTACT/OPERATOR)
, GENSTAR STONE PRODUCTS COMPANY (CONTACT/OWNER)
, LAFARGE MID ATLANTIC (CONTACT/OWNER)
Alternative names: LAFARGE - SOUTHLAWN BLACKTOP PLANT, REDLAND GENSTAR, REDLAND GENSTAR INC-ROCKVILLE
MONTGOMERY COM. COLLEGE-ROCKVILLE (51 MANNAKEE STREET in ROCKVILLE, MD)
STATE MASTER (Maryland Permits tracking) - National Pollutant Discharge Elimination System Permit, NPDES STORMWATER PERMIT STATE MASTER (Maryland Air Emissions Database) - AIR MINOR National Pollutant Discharge Elimination System NON-MAJOR (Tracking pollutant discharge elimination systems) - permit Conditionally Exempt Small Quantity Generators, less than 100 kg/month of hazardous waste (Resource Conservation and Recovery Act (tracking hazardous waste)) - notification Business SIC classification: AMUSEMENT AND RECREATION SERVICES; JUNIOR COLLEGES AND TECHNICAL INSTITUTES Organizations: OPERNAME (CONTACT/OPERATOR)
, BOARD OF TRUSTEES, MONTGOMERY COLLEGE (CONTACT/OWNER)
Alternative names: MONTGOMERY COLLEGE, MONTGOMERY COLLEGE - ROCKVILLE, ROCKVILLE CAMPUS POOL
AUTO BODY CRAFTSMAN (801 EAST GUDE DRIVE in ROCKVILLE, MD)
AIR MINOR (AIRS/AFS) STATE MASTER (Maryland Air Emissions Database) - AIR MINOR STATE MASTER (Maryland tracking) - HAZARDOUS WASTE PROGRAM Small Quantity Generators, between 100 kg and 1000 kg of hazardous waste/month (Resource Conservation and Recovery Act (tracking hazardous waste)) - notification Business SIC classification: TOP, BODY, AND UPHOLSTERY REPAIR SHOPS AND PAINT SHOPS Organizations: OPERNAME (CONTACT/OPERATOR)
, FF&S CORP (CONTACT/OWNER)
Alternative names: AUTO BODY CRAFTSMEN
MONTGOMERY SCRAP (15000 SOUTHLAWN LANE in ROCKVILLE, MD)
AIR MINOR (AIRS/AFS) STATE MASTER (Maryland Permits tracking) - NPDES STORMWATER PERMIT STATE MASTER (Maryland Air Emissions Database) - AIR MAJOR Small Quantity Generators, between 100 kg and 1000 kg of hazardous waste/month (Resource Conservation and Recovery Act (tracking hazardous waste)) - notification Business SIC classification: SCRAP AND WASTE MATERIALS Organizations: MONTGOMERY SCRAP CO (CONTACT/OWNER)
REGIONAL INSTITUTE FOR CHILDREN & ADOLESCENTS (15000 BROSCHART ROAD in ROCKVILLE, MD)
(Geographic Names Information System) STATE MASTER (Maryland Permits tracking) - National Pollutant Discharge Elimination System Permit (National Center for Education Statistics) - STATE ID-150965 National Pollutant Discharge Elimination System NON-MAJOR (Tracking pollutant discharge elimination systems) - permit Business SIC classification: SPECIALTY HOSPITALS, EXCEPT PSYCHIATRIC Organizations: MONTGOMERY COUNTY PUBLIC SCHOOLS (SCHOOL DISTRICT)
Alternative names: R.I.C.A.
BIORELIANCE CORP BLDG 7 (9920 MEDICAL CENTER DR in ROCKVILLE, MD)
AIR MINOR (AIRS/AFS) STATE MASTER (Maryland Air Emissions Database) - AIR MINOR Small Quantity Generators, between 100 kg and 1000 kg of hazardous waste/month (Resource Conservation and Recovery Act (tracking hazardous waste)) - notification - ICIS-, ENFORCEMENT/COMPLIANCE ACTIVITY Business SIC classification: PHARMACEUTICAL PREPARATIONS; BIOLOGICAL PRODUCTS, EXCEPT DIAGNOSTIC SUBSTANCES Organizations: BUCCINI POLLIN GROUP (CONTACT/OWNER)
MA BIOSERVICES (9900 BLACKWELL ROAD in ROCKVILLE, MD)
AIR MINOR (AIRS/AFS) ENFORCEMENT/COMPLIANCE ACTIVITY (Integrated Compliance Information System) STATE MASTER (Maryland Air Emissions Database) - AIR MINOR HAZARDOUS WASTE BIENNIAL REPORTER (Resource Conservation and Recovery Act (tracking hazardous waste)) Large Quantity Generators, more that 1000 kg of hazardous waste/month (Resource Conservation and Recovery Act (tracking hazardous waste)) - notification Business SIC classification: BIOLOGICAL PRODUCTS, EXCEPT DIAGNOSTIC SUBSTANCES Organizations: OPERNAME (CONTACT/OPERATOR)
, MICROBIOLOGICAL ASSOCS INC (CONTACT/OWNER)
Alternative names: BIORELIANCE
KIRLIN ENTERPRISES INC T/A COMBUSTIONEER (645 A LOFSTRAND LANE in ROCKVILLE, MD)
(Integrated Compliance Information System) - ICIS-03-1986-0634, FORMAL ENFORCEMENT ACTION (Integrated Compliance Information System) - ICIS-03-2003-0243, FORMAL ENFORCEMENT ACTION TRANSPORTER (Resource Conservation and Recovery Act (tracking hazardous waste)) Business SIC classification: PLUMBING, HEATING AND AIR-CONDITIONING Organizations: OPERNAME (CONTACT/OPERATOR)
, KIRLIN, JOHN J (CONTACT/OWNER)
Alternative names: COMBUSTIONEER WATER TREATMENT DIV
REDLAND GENSTAR BOYDS (11350 MCCORMICK ROAD in ROCKVILLE, MD)
AIR MINOR (AIRS/AFS) (Integrated Compliance Information System) - ICIS-03-1997-0342, FORMAL ENFORCEMENT ACTION STATE MASTER (Maryland Air Emissions Database) - AIR MINOR Business SIC classification: CRUSHED AND BROKEN LIMESTONE; HIGHWAY AND STREET CONSTRUCTION, EXCEPT ELEVATED HIGHWAYS; READY-MIXED CONCRETE Alternative names: GENSTAR STONE PRODUCTS BOYDS
Housing units lacking complete plumbing facilities: 0.5% Housing units lacking complete kitchen facilities: 0.7%
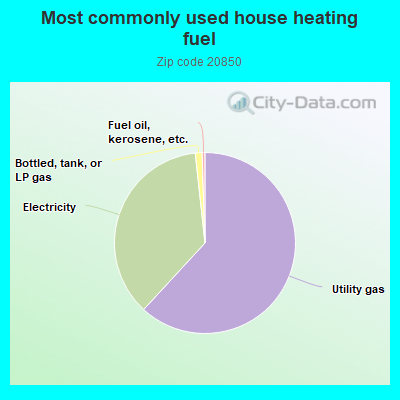
61.3%Utility gas
36.1%Electricity
1.2%Bottled, tank, or LP gas
0.5%Fuel oil, kerosene, etc.
Population in 1990: 24,215. Population change in the 1990s: +9,342 (+38.6%).
Place of birth for U.S.-born residents:
This state: 11,918
Northeast: 6,288
Midwest: 3,414
South: 8,513
West: 1,757
47% of the 20850 zip code residents lived in the same house 5 years ago. Out of people who lived in different houses, 65% lived in this county. Out of people who lived in different counties, 50% lived in Maryland.
84% of the 20850 zip code residents lived in the same house 1 year ago. Out of people who lived in different houses, 48% moved from this county. Out of people who lived in different houses, 12% moved from different county within same state. Out of people who lived in different houses, 24% moved from different state. Out of people who lived in different houses, 12% moved from abroad.
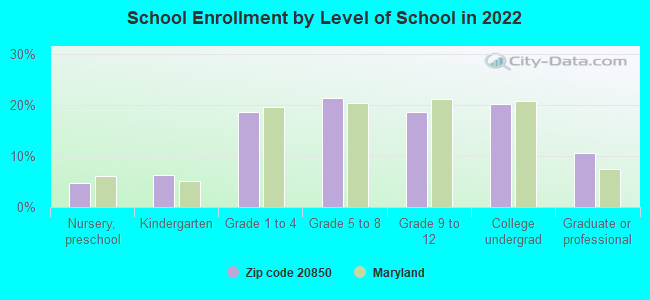
Private vs. public school enrollment:
Students in private schools in grades 1 to 8 (elementary and middle school): 639
Here:
14.1%
Maryland:
15.2%
Students in private schools in grades 9 to 12 (high school): 324
Here:
15.4%
Maryland:
14.4%
Students in private undergraduate colleges: 486
Here:
21.1%
Maryland:
20.2%
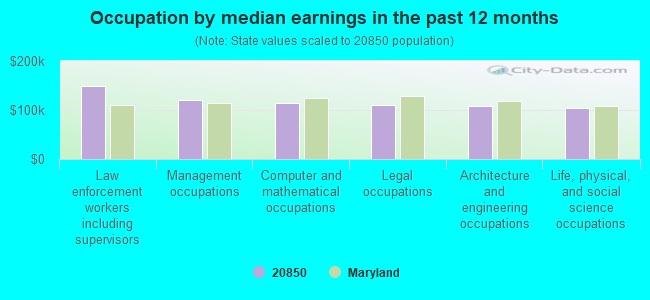
Occupation by median earnings in the past 12 months ($)
149,192Law enforcement workers including supervisors
120,445Management occupations
114,037Computer and mathematical occupations
109,936Legal occupations
107,308Architecture and engineering occupations
104,006Life, physical, and social science occupations
Companies with biggest federal contracts located in this zip code (ROCKVILLE, MD):
BAE SYSTEMS APPLIED TECHNOLOGI (1601 RESEARCH BLVD) : $2,586,610,626 in 5273 contractsfrom 1999 to 2006
Contracts for Other Professional Services, Technical Representation Services -- Miscellaneous, Quality Control Services -- Ships, Small Craft, Pontoons, and Floating Docks, Maintenance, Repair and Rebuilding of Equipment -- Miscellaneous, and moreby Navy, Federal Technology Service, Immediate Office of the Secretary of Transportation, Offices, Boards and Divisions (includes Attorney General, Deputy Attorney General, etc.), and others Signed by year:2000: $318,549,943; 2001: $359,266,835; 2002: $384,233,958; 2003: $400,024,533; 2004: $466,656,017; 2005: $416,620,792; 2006: $137,795,200.
Biggest contracts:
$47,828,745 with Navy for Other Professional Services. Taking place in DC. Signed on 2005-08-03. Completion date: 2005-08-03.
$47,120,754 with Navy for Technical Representation Services -- Miscellaneous. Signed on 2004-12-15. Completion date: 2005-09-30.
$43,712,418, same as above.Signed on 2005-11-17. Completion date: 2006-09-30.
$43,454,799 with Navy for Other Professional Services. Taking place in DC. Signed on 2004-09-16. Completion date: 2006-08-31.
JOHN J KIRLIN, INC (515 DOVER ROAD STE 2400) : $324,274,228 in 706 contractsfrom 2000 to 2006
Contracts for Engineering and Technical Services, Maintenance, Repair or Alteration of Real Property -- Hospitals and Infirmaries, Construction of Structures and Facilities -- Laboratories and Clinics, Construction of Structures and Facilities -- Other Hospital Buildings, and moreby Army, Public Buildings Service, Air Force Signed by year:2000: $31,818,939; 2001: $41,969,947; 2002: $97,824,602; 2003: $61,703,862; 2004: $45,842,783; 2005: $43,046,737; 2006: $2,067,358.
Biggest contracts:
$13,400,000 with Army for Engineering and Technical Services. Taking place in DC. Signed on 2002-09-30. Completion date: 2004-07-31.
$12,765,295 with Army for Maintenance, Repair or Alteration of Real Property -- Hospitals and Infirmaries. Taking place in MO. Signed on 2003-09-17. Completion date: 2005-09-30.
$10,700,000 with Army for Engineering and Technical Services. Signed on 2002-09-30. Completion date: 2002-09-30.
$9,093,318 with Army for Maintenance, Repair or Alteration of Real Property -- Hospitals and Infirmaries. Taking place in MO. Signed on 2005-09-16. Completion date: 2008-12-31.
NCR GOVERNMENT SYSTEMS CORPORA (2 CHOKE CHERRY RD) : $276,235,697 in 2231 contractsfrom 1999 to 2006
Contracts for ADPE System Configuration, Other ADP and Telecommunications Services (includes data storage on tapes, compact disks, etc.), ADP Facility Operation and Maintenance Services, ADP Components, and moreby Department of Defense, Offices, Boards and Divisions (includes Attorney General, Deputy Attorney General, etc.), Air Force, Centers for Medicare & Medicaid Services, and others Signed by year:2000: $54,819,512; 2001: $24,183,089; 2002: $63,812,779; 2003: $31,831,292; 2004: $40,053,109; 2005: $34,171,838; 2006: $20,790,664.
Biggest contracts:
$17,894,722 with Department of Defense for ADPE System Configuration. Signed on 2000-08-01. Completion date: 2001-09-30.
$8,067,306 with Department of Defense for Other ADP and Telecommunications Services (includes data storage on tapes, compact disks, etc.). Signed on 2002-05-13. Completion date: 2002-08-11.
$8,067,306, same as above.Signed on 2002-09-04. Completion date: 2003-09-30.
$5,857,864 with Offices, Boards and Divisions (includes Attorney General, Deputy Attorney General, etc.) for ADPE System Configuration. Signed on 2002-11-15. Completion date: 2003-10-15.
DYNAMAC CORP (2275 RES BLVD STE 300) : $216,398,632 in 734 contractsfrom 1999 to 2006
Contracts for Engineering and Technical Services, Fueling and Other Petroleum Services - Excluding Storage, Operation of Government-Owned Facilities -- Laboratories and Clinics, Other Quality Control, Testing and Inspection Services -- Miscellaneous, and moreby NASA, Army, EPA, National Institutes of Health, and others Signed by year:2000: $24,528,248; 2001: $60,772,730; 2002: $20,855,158; 2003: $27,848,375; 2004: $24,652,513; 2005: $25,580,924; 2006: $24,519,154.
Biggest contracts:
$41,995,405 with NASA for Engineering and Technical Services. Taking place in FL. Signed on 2001-12-13. Completion date: 2005-09-30.
$16,181,524, same as above.Signed on 2003-09-23. Completion date: 2005-09-30.
$4,310,411, same as above.Signed on 2003-01-15. Completion date: 2005-09-15.
$4,144,472, same as above.Signed on 2005-04-22. Completion date: 2005-09-30.
ALLIED TECHNOLOGY GROUP INC (1803 RES BLVD STE 601) 500 employees, $45092345 revenue: $182,899,220 in 1656 contractsfrom 1999 to 2006
Contracts for ADP Systems Analysis Services, Maintenance, Repair and Rebuilding of Equipment -- Communication, Detection, and Coherent Radiation Equipment, Other ADP and Telecommunications Services (includes data storage on tapes, compact disks, etc.), Engineering and Technical Services, and moreby Federal Technology Service, U.S. Coast Guard, Department of State, Navy, and others Signed by year:2000: $43,251,055; 2001: $29,012,983; 2002: $30,884,035; 2003: $30,642,909; 2004: $19,531,377; 2005: $11,225,998; 2006: $8,187,876.
Biggest contracts:
$3,109,000 with Federal Technology Service for ADP Systems Analysis Services. Signed on 2002-02-15. Completion date: 2002-12-15.
$2,608,000 with U.S. Coast Guard for Maintenance, Repair and Rebuilding of Equipment -- Communication, Detection, and Coherent Radiation Equipment. Taking place in VA. Signed on 2003-08-07. Completion date: 2004-02-29.
$2,251,481 with Department of State for Other ADP and Telecommunications Services (includes data storage on tapes, compact disks, etc.). Taking place in DC. Signed on 2000-09-13. Completion date: 2001-10-31.
$2,144,893 with U.S. Coast Guard for Engineering and Technical Services. Taking place in VA. Signed on 2005-03-09. Completion date: 2006-02-28.
BIOQUAL, INC. (9600 MED CTR DR STE 200; small business) 86 employees, $11016481 revenue. : $89,184,564 in 112 contractsfrom 1999 to 2006
Contracts for Biomedical -- Applied Research and Exploratory Development (R&D), Lease or Rental of Equipment -- Live Animals, Biomedical -- Management and Support (R&D), Veterinary/Animal Care Services, and moreby National Institutes of Health, Food and Drug Administration, Army Signed by year:2000: $8,171,000; 2001: $11,234,000; 2002: $12,399,285; 2003: $17,314,278; 2004: $11,090,713; 2005: $15,894,898; 2006: $9,228,390.
Biggest contracts:
$4,364,617 with National Institutes of Health for Biomedical -- Applied Research and Exploratory Development (R&D). Signed on 2005-06-07. Effective on 2005-06-01. Completion date: 2007-01-18.
$4,115,677, same as above.Signed on 2003-03-15. Completion date: 2007-01-15.
$3,989,000, same as above.Signed on 2002-01-15. Completion date: 2007-01-15.
$3,196,650, same as above.Signed on 2003-09-15. Completion date: 2007-01-15.
ROW SCIENCES, INC. (1700 RES BLVD STE 400; small business) : $87,288,708 in 206 contractsfrom 1999 to 2006
Contracts for Other Administrative Support Services, Other Social Services, Other Research and Development -- Basic Research (R&D), Other Medical -- Basic Research (R&D), and moreby Substance Abuse and Mental Health Services Administration, National Institutes of Health, Centers for Disease Control and Prevention, Office of Assistant Secretary for Management and Budget, and others Signed by year:2000: $18,347,695; 2001: $25,366,000; 2002: $18,439,000; 2003: $13,345,393; 2004: $7,053,807; 2005: $1,643,568; 2006: $1,986,245.
Biggest contracts:
$5,206,000 with Substance Abuse and Mental Health Services Administration for Other Administrative Support Services. Signed on 2001-09-15. Completion date: 2003-09-15.
$3,659,000, same as above.Signed on 2000-07-15. Completion date: 2001-09-15.
$3,221,000 with Substance Abuse and Mental Health Services Administration for Other Social Services. Signed on 2001-09-15. Completion date: 2002-09-15.
$2,584,449, same as above.Signed on 2003-04-15. Completion date: 2004-09-15.
MELE ASSOCIATES, INC (14660 ROTHGEB DR STE 102; small business) : $67,752,280 in 231 contractsfrom 1999 to 2006
Contracts for Programming Services, Program Management/Support Services, Engineering and Technical Services, Other ADP and Telecommunications Services (includes data storage on tapes, compact disks, etc.), and moreby Department of Veterans Affairs, ENERGY, Department of, Federal Technology Service, Federal Transit Administration, and others Signed by year:2000: $6,029,000; 2001: $3,635,076; 2002: $13,050,481; 2003: $14,252,399; 2004: $15,698,139; 2005: $10,184,142; 2006: $1,228,043.
Biggest contracts:
$6,026,572 with Department of Veterans Affairs for Programming Services. Taking place in HI. Signed on 2004-04-01. Completion date: 2005-03-31.
$6,026,572, same as above.Signed on 2004-04-01. Completion date: 2005-03-31.
$5,361,818 with Department of Veterans Affairs for Program Management/Support Services. Taking place in HI. Signed on 2005-09-28. Completion date: 2006-03-31.
$3,978,265 with Department of Veterans Affairs for Programming Services. Signed on 2003-07-15. Completion date: 2004-02-15.
APPLIED HYDRO-ACOUSTICS RESEAR (15825 SHADY GROVE ROAD; small business) : $66,422,538 in 416 contractsfrom 1999 to 2006
Contracts for Non-nuclear Ship Repair (West) Ship repair (including overhauls and conversions) performed on. non-nuclear propelled and nonpropelled ships west of the 108th meridian, Radar Equipment, Except Airborne, Systems Engineering Services, Defense Electronics and Communication Equipment -- Basic Research (R&D), and moreby Navy Signed by year:2000: $2,023,753; 2001: $2,584,589; 2002: $7,718,153; 2003: $4,938,379; 2004: $9,121,996; 2005: $19,789,626; 2006: $18,316,115.
Biggest contracts:
$5,074,660 with Navy for Non-nuclear Ship Repair (West) Ship repair (including overhauls and conversions) performed on. non-nuclear propelled and nonpropelled ships west of the 108th meridian. Taking place in CA. Signed on 2005-06-17. Completion date: 2005-10-12.
$4,083,644, same as above.Signed on 2006-02-02. Completion date: 2006-04-26.
$3,939,459, same as above.Signed on 2006-03-20. Completion date: 2006-06-26.
$3,808,077, same as above.Signed on 2006-02-15. Completion date: 2006-05-17.
ADVANCED BROADBAND SOLUTIONS, (9210 CORP BLVD STE 150; small business) 30 employees, $3300000 revenue. 8A Firm, Small Disadvantaged Business: $64,998,824 in 94 contractsfrom 2000 to 2006
Contracts for ADP Data Entry Services, ADP Systems Analysis Services, Other ADP and Telecommunications Services (includes data storage on tapes, compact disks, etc.), Engineering and Technical Services, and moreby Department of Veterans Affairs, Federal Technology Service, Navy, Minerals Management Service, and others Signed by year:2000: $4,275,178; 2001: $6,476,080; 2002: $8,920,482; 2003: $17,669,290; 2004: $11,606,614; 2005: $13,449,748; 2006: $2,601,432.
Biggest contracts:
$6,473,122 with Department of Veterans Affairs for ADP Data Entry Services. Signed on 2005-10-01. Completion date: 2006-09-30.
$6,122,772 with Federal Technology Service for ADP Systems Analysis Services. Taking place in CO. Signed on 2005-12-07. Effective on 2005-12-06. Completion date: 2006-12-05.
$5,194,858 with Department of Veterans Affairs for Other ADP and Telecommunications Services (includes data storage on tapes, compact disks, etc.). Signed on 2004-10-01. Completion date: 2005-09-30.
$5,033,777, same as above.Signed on 2003-10-01. Completion date: 2004-09-30.
Top industries in this zip code by the number of employees in 2005:
Professional, Scientific, and Technical Services: Research and Development in the Physical, Engineering, and Life Sciences (500-999 employees: 1 establishment, 250-499 employees: 3 establishments, 100-249 employees: 3 establishments, 50-99 employees: 5 establishments, 20-49 employees: 9 establishments, 10-19 employees: 13 establishments, 5-9 employees: 5 establishments, 1-4 employees: 16 establishments)
2004 - 2018 National Fire Incident Reporting System (NFIRS) incidents
Based on the data from the years 2004 - 2018 the average number of fire incidents per year is 89. The highest number of reported fires - 178 took place in 2007, and the least - 28 in 2004. The data has a growing trend.
When looking into fire subcategories, the most reports belonged to: Outside Fires (46.5%), and Structure Fires (26.9%).
Fire incident types reported to NFIRS in Zip Code 20850


 Nearest zip codes: 20877, 20880, 20851, 20899, 20855, 20854.


 Based on the data from the years 2004 - 2018 the average number of fire incidents per year is 89. The highest number of reported fires - 178 took place in 2007, and the least - 28 in 2004. The data has a growing trend.
 When looking into fire subcategories, the most reports belonged to: Outside Fires (46.5%), and Structure Fires (26.9%).