Estimated zip code population in 2022: 30,361 Zip code population in 2010: 28,550 Zip code population in 2000: 28,236
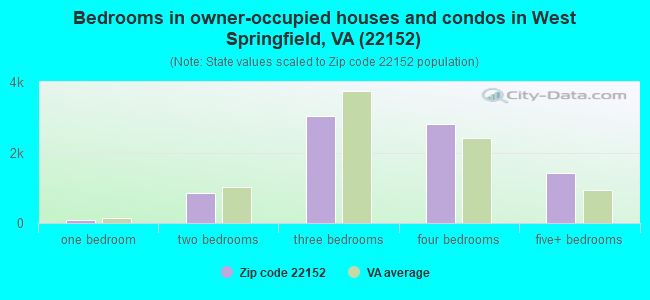
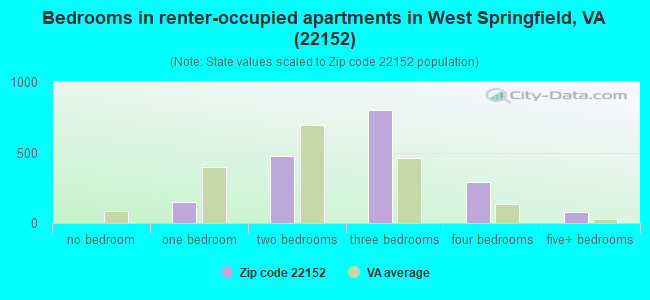
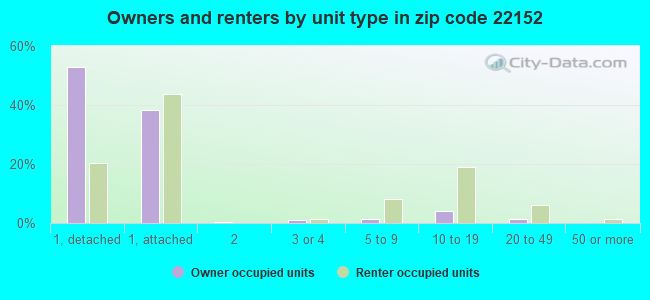
Houses and condos: 10,169 Renter-occupied apartments: 1,818
% of renters here:
18%
State:
33%
March 2022 cost of living index in zip code 22152: 165.8 (very high, U.S. average is 100)
Land area: 5.9 sq. mi. Water area: 0.0 sq. mi.
Population density: 5,104 people per square mile
(average).
OSM Map
General Map
Google Map
MSN Map
OSM Map
General Map
Google Map
MSN Map
OSM Map
General Map
Google Map
MSN Map
OSM Map
General Map
Google Map
MSN Map
Please wait while loading the map...
Real estate property taxes paid for housing units in 2022:
This zip code:
0.9% ($6,022)
Virginia:
0.7% ($2,617)
Median real estate property taxes paid for housing units with mortgages in 2022: $5,997 (0.9%) Median real estate property taxes paid for housing units with no mortgage in 2022: $6,222 (1.0%)
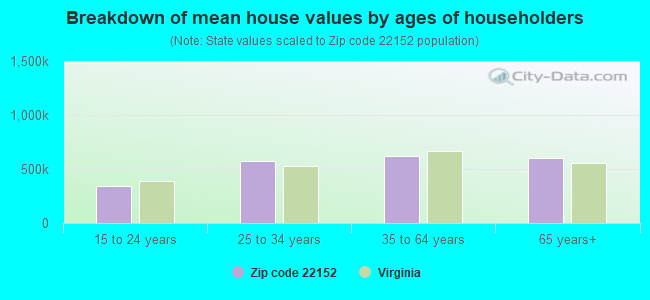
Estimated median house/condo value in 2022: $639,491
22152:
$639,491
Virginia:
$365,700
According to our research of Virginia and other state lists, there were 14 registered sex offenders living in 22152 zip code as of April 27, 2024. The ratio of all residents to sex offenders in zip code 22152 is 2,125 to 1. The ratio of registered sex offenders to all residents in this zip code is much lower than the state average.
Median resident age:
This zip code:
38.9 years
Virginia median age:
39.0 years
Average household size:
This zip code:
3.0 people
Virginia:
2.5 people
Averages for the 2020 tax year for zip code 22152, filed in 2021:
Average Adjusted Gross Income (AGI) in 2020: $106,998 (Individual Income Tax Returns)
Here:
$106,998
State:
$86,446
Salary/wage: $94,686 (reported on 82.4% of returns)
Here:
$94,686
State:
$71,185
(% of AGI for various income ranges: 1079.9% for AGIs below $25k, 3738.3% for AGIs $25k-50k, 6791.9% for AGIs $50k-75k, 9730.7% for AGIs $75k-100k, 18828.4% for AGIs $100k-200k, 56916.0% for AGIs over 200k)
Taxable interest for individuals: $1,447 (reported on 44.4% of returns)
This zip code:
$1,447
Virginia:
$1,805
(% of AGI for various income ranges: 13.4% for AGIs below $25k, 33.5% for AGIs $25k-50k, 48.5% for AGIs $50k-75k, 77.4% for AGIs $75k-100k, 150.7% for AGIs $100k-200k, 479.2% for AGIs over 200k)
Ordinary dividends: $5,573 (reported on 32.2% of returns)
Here:
$5,573
State:
$8,327
(% of AGI for various income ranges: 24.4% for AGIs below $25k, 48.3% for AGIs $25k-50k, 85.9% for AGIs $50k-75k, 165.9% for AGIs $75k-100k, 394.2% for AGIs $100k-200k, 1684.3% for AGIs over 200k)
Net capital gain/loss in AGI: +$14,062 (reported on 29.6% of returns)
Here:
+$14,062
State:
+$24,644
(% of AGI for various income ranges: 19.7% for AGIs below $25k, 51.6% for AGIs $25k-50k, 70.3% for AGIs $50k-75k, 163.3% for AGIs $75k-100k, 478.4% for AGIs $100k-200k, 5952.8% for AGIs over 200k)
Profit/loss from business: +$12,297 (reported on 20.5% of returns)
Here:
+$12,297
State:
+$12,836
(% of AGI for various income ranges: 214.7% for AGIs below $25k, 236.7% for AGIs $25k-50k, 310.1% for AGIs $50k-75k, 191.8% for AGIs $75k-100k, 417.3% for AGIs $100k-200k, 1713.3% for AGIs over 200k)
Taxable individual retirement arrangement distribution: $22,199 (reported on 8.7% of returns)
22152:
$22,199
Virginia:
$21,535
(% of AGI for various income ranges: 26.3% for AGIs below $25k, 82.3% for AGIs $25k-50k, 150.8% for AGIs $50k-75k, 208.5% for AGIs $75k-100k, 483.4% for AGIs $100k-200k, 1466.3% for AGIs over 200k)
Self-employed (Keogh) retirement plans: $20,492 (reported on 0.9% of returns)
22152:
$20,492
Virginia:
$31,172
(% of AGI for various income ranges: 31.1% for AGIs $100k-200k, 262.0% for AGIs over 200k)
Total itemized deductions: $30,280 (reported on 26.7% of returns)
Here:
$30,280
State:
$33,287
(% of AGI for various income ranges: 68.3% for AGIs below $25k, 292.8% for AGIs $25k-50k, 687.0% for AGIs $50k-75k, 1182.4% for AGIs $75k-100k, 2092.5% for AGIs $100k-200k, 5541.5% for AGIs over 200k)
Charity contributions: $7,150 (reported on 21.9% of returns)
Here:
$7,150
State:
$10,381
(% of AGI for various income ranges: 5.3% for AGIs below $25k, 35.2% for AGIs $25k-50k, 78.1% for AGIs $50k-75k, 142.3% for AGIs $75k-100k, 351.9% for AGIs $100k-200k, 1510.3% for AGIs over 200k)
Taxes paid: $9,047 (reported on 26.5% of returns)
22152:
$9,047
State:
$8,284
(% of AGI for various income ranges: 12.8% for AGIs below $25k, 72.5% for AGIs $25k-50k, 205.9% for AGIs $50k-75k, 393.3% for AGIs $75k-100k, 681.9% for AGIs $100k-200k, 1456.9% for AGIs over 200k)
Earned income credit: $1,874 (reported on 8.0% of returns)
Here:
$1,874
State:
$2,214
(% of AGI for various income ranges: 60.4% for AGIs below $25k, 57.9% for AGIs $25k-50k, 0.8% for AGIs $50k-75k)
Percentage of individuals using paid preparers for their 2020 taxes: 90.8%
Here:
91%
State:
92%
(% for various income ranges: 89.2% for AGIs below $25k, 91.1% for AGIs $25k-50k, 91.7% for AGIs $50k-75k, 90.1% for AGIs $75k-100k, 91.8% for AGIs $100k-200k, 91.0% for AGIs over 200k)
Averages for the 2012 tax year for zip code 22152, filed in 2013:
Average Adjusted Gross Income (AGI) in 2012: $87,543 (Individual Income Tax Returns)
Here:
$87,543
State:
$71,192
Salary/wage: $77,201 (reported on 85.0% of returns)
Here:
$77,201
State:
$59,229
(% of AGI for various income ranges: 75.7% for AGIs below $25k, 82.3% for AGIs $25k-50k, 78.1% for AGIs $50k-75k, 75.6% for AGIs $75k-100k, 76.3% for AGIs $100k-200k, 69.3% for AGIs over 200k)
Taxable interest for individuals: $1,224 (reported on 49.4% of returns)
This zip code:
$1,224
Virginia:
$1,600
(% of AGI for various income ranges: 0.9% for AGIs below $25k, 0.5% for AGIs $25k-50k, 0.8% for AGIs $50k-75k, 0.6% for AGIs $75k-100k, 0.7% for AGIs $100k-200k, 0.7% for AGIs over 200k)
Ordinary dividends: $4,762 (reported on 31.7% of returns)
Here:
$4,762
State:
$6,959
(% of AGI for various income ranges: 1.9% for AGIs below $25k, 0.9% for AGIs $25k-50k, 1.2% for AGIs $50k-75k, 1.5% for AGIs $75k-100k, 1.6% for AGIs $100k-200k, 2.4% for AGIs over 200k)
Net capital gain/loss in AGI: +$3,574 (reported on 24.2% of returns)
Here:
+$3,574
State:
+$16,672
(% of AGI for various income ranges: 0.3% for AGIs $50k-75k, 0.7% for AGIs $100k-200k, 2.5% for AGIs over 200k)
Profit/loss from business: +$15,004 (reported on 17.3% of returns)
Here:
+$15,004
State:
+$14,116
(% of AGI for various income ranges: 14.1% for AGIs below $25k, 5.1% for AGIs $25k-50k, 2.7% for AGIs $50k-75k, 1.9% for AGIs $75k-100k, 1.9% for AGIs $100k-200k, 3.3% for AGIs over 200k)
Taxable individual retirement arrangement distribution: $15,641 (reported on 10.6% of returns)
22152:
$15,641
Virginia:
$16,667
(% of AGI for various income ranges: 1.9% for AGIs below $25k, 1.5% for AGIs $25k-50k, 1.6% for AGIs $50k-75k, 1.9% for AGIs $75k-100k, 2.0% for AGIs $100k-200k, 2.0% for AGIs over 200k)
Self-employment retirement plans: $18,587 (reported on 1.1% of returns)
22152:
$18,587
Virginia:
$25,373
(% of AGI for various income ranges: 0.2% for AGIs $50k-75k, 0.1% for AGIs $100k-200k, 0.6% for AGIs over 200k)
Total itemized deductions: $26,884 (21% of AGI, reported on 55.4% of returns)
Here:
$26,884
State:
$26,596
Here:
21.0% of AGI
State:
20.1% of AGI
(% of AGI for various income ranges: 14.6% for AGIs below $25k, 15.6% for AGIs $25k-50k, 18.0% for AGIs $50k-75k, 18.4% for AGIs $75k-100k, 17.8% for AGIs $100k-200k, 15.5% for AGIs over 200k)
Charity contributions: $3,823 (reported on 46.2% of returns)
Here:
$3,823
State:
$4,443
(% of AGI for various income ranges: 0.7% for AGIs below $25k, 1.1% for AGIs $25k-50k, 1.7% for AGIs $50k-75k, 2.0% for AGIs $75k-100k, 2.2% for AGIs $100k-200k, 2.3% for AGIs over 200k)
Taxes paid: $10,269 (reported on 55.3% of returns)
22152:
$10,269
State:
$9,951
(% of AGI for various income ranges: 2.6% for AGIs below $25k, 3.6% for AGIs $25k-50k, 5.4% for AGIs $50k-75k, 6.2% for AGIs $75k-100k, 7.1% for AGIs $100k-200k, 7.2% for AGIs over 200k)
Earned income credit: $1,921 (reported on 8.3% of returns)
Here:
$1,921
State:
$2,211
(% of AGI for various income ranges: 4.2% for AGIs below $25k, 0.8% for AGIs $25k-50k)
Percentage of individuals using paid preparers for their 2012 taxes: 44.6%
Here:
45%
State:
46%
(% for various income ranges: 44.8% for AGIs below $25k, 48.7% for AGIs $25k-50k, 47.9% for AGIs $50k-75k, 44.4% for AGIs $75k-100k, 39.3% for AGIs $100k-200k, 47.4% for AGIs over 200k)
Averages for the 2004 tax year for zip code 22152, filed in 2005:
Average Adjusted Gross Income (AGI) in 2004: $71,281 (Individual Income Tax Returns)
Here:
$71,281
State:
$56,704
Salary/wage: $62,413 (reported on 86.3% of returns)
Here:
$62,413
State:
$48,441
(% of AGI for various income ranges: 95.3% for AGIs below $10k, 76.5% for AGIs $10k-25k, 82.6% for AGIs $25k-50k, 77.6% for AGIs $50k-75k, 78.7% for AGIs $75k-100k, 72.7% for AGIs over 100k)
Taxable interest for individuals: $1,305 (reported on 60.4% of returns)
This zip code:
$1,305
Virginia:
$1,688
(% of AGI for various income ranges: 3.7% for AGIs below $10k, 2.0% for AGIs $10k-25k, 1.0% for AGIs $25k-50k, 1.2% for AGIs $50k-75k, 1.2% for AGIs $75k-100k, 1.0% for AGIs over 100k)
Taxable dividends: $3,079 (reported on 36.8% of returns)
Here:
$3,079
State:
$4,028
(% of AGI for various income ranges: 3.3% for AGIs below $10k, 1.6% for AGIs $10k-25k, 0.9% for AGIs $25k-50k, 1.3% for AGIs $50k-75k, 1.1% for AGIs $75k-100k, 1.9% for AGIs over 100k)
Net capital gain/loss: +$6,834 (reported on 29.6% of returns)
Here:
+$6,834
State:
+$14,375
(% of AGI for various income ranges: -1.4% for AGIs below $10k, 0.1% for AGIs $10k-25k, 0.1% for AGIs $25k-50k, 0.3% for AGIs $50k-75k, 0.8% for AGIs $75k-100k, 4.7% for AGIs over 100k)
Profit/loss from business: +$16,990 (reported on 16.4% of returns)
Here:
+$16,990
State:
+$13,342
(% of AGI for various income ranges: 14.3% for AGIs below $10k, 11.8% for AGIs $10k-25k, 5.2% for AGIs $25k-50k, 2.8% for AGIs $50k-75k, 2.2% for AGIs $75k-100k, 3.8% for AGIs over 100k)
Profit/loss from farming: +$2,263 (reported on 0.1% of returns)
Here:
+$2,263
State:
-$5,267
IRA payment deduction: $3,144 (reported on 3.5% of returns)
22152:
$3,144
Virginia:
$2,943
(% of AGI for various income ranges: 0.5% for AGIs below $10k, 0.4% for AGIs $10k-25k, 0.2% for AGIs $25k-50k, 0.2% for AGIs $50k-75k, 0.1% for AGIs $75k-100k, 0.1% for AGIs over 100k)
Self-employed pension: $16,659 (reported on 1.6% of returns)
Here:
$16,659
Virginia:
$17,430
(% of AGI for various income ranges: 0.1% for AGIs $25k-50k, 0.2% for AGIs $50k-75k, 0.2% for AGIs $75k-100k, 0.6% for AGIs over 100k)
Total itemized deductions: $21,852 (22% of AGI, reported on 58.4% of returns)
Here:
$21,852
State:
$21,492
Here:
21.6% of AGI
State:
21.0% of AGI
(% of AGI for various income ranges: 15.2% for AGIs below $10k, 19.1% for AGIs $10k-25k, 20.2% for AGIs $25k-50k, 21.3% for AGIs $50k-75k, 20.3% for AGIs $75k-100k, 16.0% for AGIs over 100k)
Charity contributions deductions: $3,164 (3% of AGI, reported on 51.9% of returns)
Here:
$3,164
State:
$3,794
Here:
3.0% of AGI
State:
3.5% of AGI
(% of AGI for various income ranges: 0.4% for AGIs below $10k, 1.2% for AGIs $10k-25k, 1.9% for AGIs $25k-50k, 2.2% for AGIs $50k-75k, 2.6% for AGIs $75k-100k, 2.4% for AGIs over 100k)
Total tax: $11,225 (reported on 85.1% of returns)
22152:
$11,225
State:
$9,537
(% of AGI for various income ranges: 3.7% for AGIs below $10k, 5.4% for AGIs $10k-25k, 7.7% for AGIs $25k-50k, 9.6% for AGIs $50k-75k, 10.7% for AGIs $75k-100k, 16.7% for AGIs over 100k)
Earned income credit: $1,456 (reported on 6.2% of returns)
Here:
$1,456
State:
$1,734
Percentage of individuals using paid preparers for their 2004 taxes: 44.5%
Here:
44%
State:
52%
(% for various income ranges: 38.1% for AGIs below $10k, 54.7% for AGIs $10k-25k, 50.0% for AGIs $25k-50k, 45.9% for AGIs $50k-75k, 41.1% for AGIs $75k-100k, 39.8% for AGIs over 100k)
Likely homosexual households (counted as self-reported same-sex unmarried-partner households)
Lesbian couples: 0.1% of all households
Gay men: 0.0% of all households
Household received Food Stamps/SNAP in the past 12 months: 341 Household did not receive Food Stamps/SNAP in the past 12 months: 9,559
Women who had a birth in the past 12 months: 436 (384 now married, 58 unmarried) Women who did not have a birth in the past 12 months: 7,071 (3,509 now married, 3,542 unmarried)
Housing units in zip code 22152 with a mortgage: 5,904 (567 second mortgage, 13 home equity loan, 504 both second mortgage and home equity loan) Houses without a mortgage: 92
Median monthly owner costs for units with a mortgage: $2,686 Median monthly owner costs for units without a mortgage: $854
Residents with income below the poverty level in 2022:
This zip code:
3.5%
Whole state:
10.6%
Residents with income below 50% of the poverty level in 2022:
This zip code:
2.6%
Whole state:
5.2%
Median number of rooms in houses and condos:
Here:
7.5
State:
7.0
Median number of rooms in apartments:
Here:
5.7
State:
4.3
Notable locations in this zip code not listed on our city pages
Notable locations in zip code 22152: Springfield Country Club (A), Fairfax County Fire and Rescue Department Station 27 West Springfield (B), Fairfax County Police Station Number 7 (C). Display/hide their locations on the map
Churches in zip code 22152 include: Fellowship Baptist Church of West Springfield (A), Grace Ethiopian Church (B), Messiah Methodist Church (C), Kirkwood Presbyterian Church (D), Prince of Peace Church (E), Westwood Baptist Church (F). Display/hide their locations on the map
Parks in zip code 22152 include: Hunter Village Park (1), Royal Ridge Park (2), Pohick Creek Stream Valley Park (3), Orange Hunt Estates Park (4), Rolling Forest Park (5), Hidden Pond Park (6), Cardinal Forest Park (7), West Springfield Park (8), West Springfield Village Park (9). Display/hide their locations on the map
5,733 married couples with children.
1,115 single-parent households (199 men, 916 women).
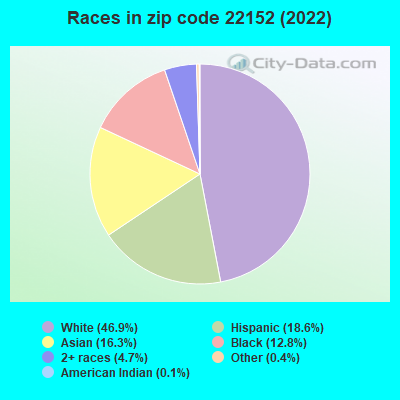
59.3% of residents of 22152 zip code speak English at home.
16.1% of residents speak Spanish at home (72% very well, 16% well, 9% not well, 4% not at all).
9.9% of residents speak other Indo-European language at home (70% very well, 18% well, 10% not well, 3% not at all).
9.0% of residents speak Asian or Pacific Island language at home (52% very well, 25% well, 21% not well, 2% not at all).
6.6% of residents speak other language at home (68% very well, 26% well, 7% not well).
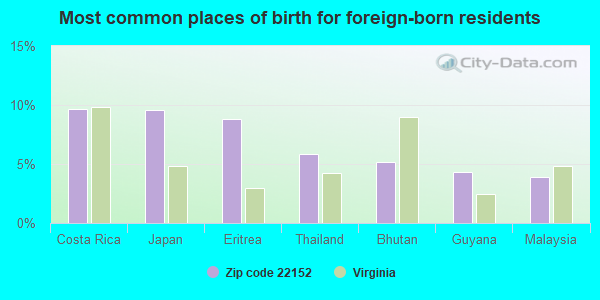
Foreign born population: 8,363 (27.5%) (66.8% of them are naturalized citizens)
This zip code:
27.5%
Whole state:
12.7%
10%Costa Rica
10%Japan
9%Eritrea
6%Thailand
5%Bhutan
4%Guyana
4%Malaysia
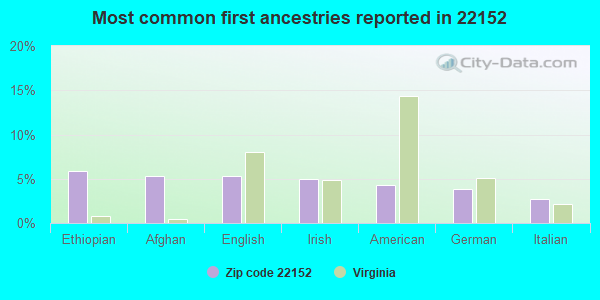
6%Ethiopian
5%Afghan
5%English
5%Irish
4%American
4%German
3%Italian
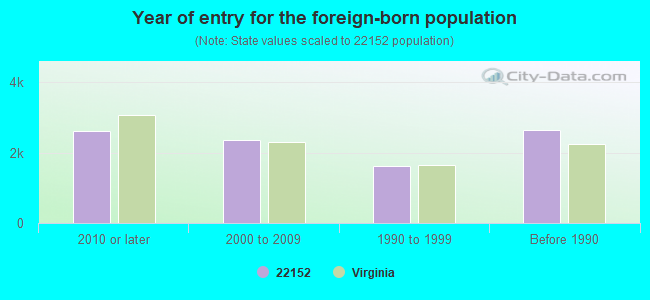
Year of entry for the foreign-born population
2,6122010 or later
2,3612000 to 2009
1,6301990 to 1999
2,653Before 1990
Facilities with environmental interests located in this zip code:
CARDINAL FOREST ELEMENTARY SCHOOL (8600 FORRESTER BOULEVARD in SPRINGFIELD, VA)
AIR MINOR (AIRS/AFS) STATE MASTER (Virginia pollutants databases) - CEDS-70476, AIR PROGRAM (National Center for Education Statistics) - STATE ID-0291690 Conditionally Exempt Small Quantity Generators, less than 100 kg/month of hazardous waste (Resource Conservation and Recovery Act (tracking hazardous waste)) - notification Business SIC and NAICS classification: ELEMENTARY AND SECONDARY SCHOOLS Organizations: FAIRFAX CNTY SCH BOARD (CONTACT/OWNER)
, FAIRFAX COUNTY PUBLIC SCHOOLS (SCHOOL DISTRICT)
Alternative names: CARDINAL FOREST ELEM SCHOOL
CHESAPEAKE & POTOMAC TELEPHONE CO (8130 OLD KEENE MILL ROAD in SPRINGFIELD, VA)
(Resource Conservation and Recovery Act (tracking hazardous waste)) Organizations: OPERNAME (CONTACT/OPERATOR)
, CHESAPEAKE & POTOMAC TELEPHONE COMPANY (CONTACT/OWNER)
7-ELEVEN #30479 (6221 ROLLING RD in SPRINGFIELD, VA)
Small Quantity Generators, between 100 kg and 1000 kg of hazardous waste/month (Resource Conservation and Recovery Act (tracking hazardous waste)) - notification Organizations: OPERNAME (CONTACT/OPERATOR)
, SOUTHLAND CORPORATION THE (CONTACT/OWNER)
Housing units lacking complete kitchen facilities: 0.2%
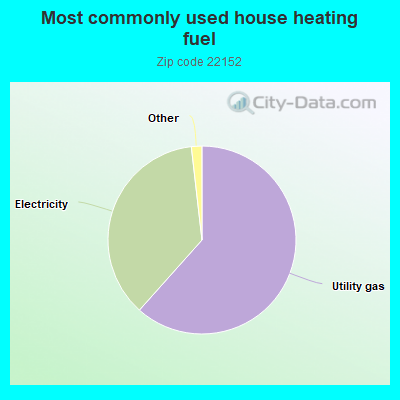
61.6%Utility gas
36.6%Electricity
0.6%Fuel oil, kerosene, etc.
0.6%No fuel used
Population in 1990: 26,803. Population change in the 1990s: +1,433 (+5.3%).
Place of birth for U.S.-born residents:
This state: 8,637
Northeast: 3,417
Midwest: 2,405
South: 4,602
West: 2,114
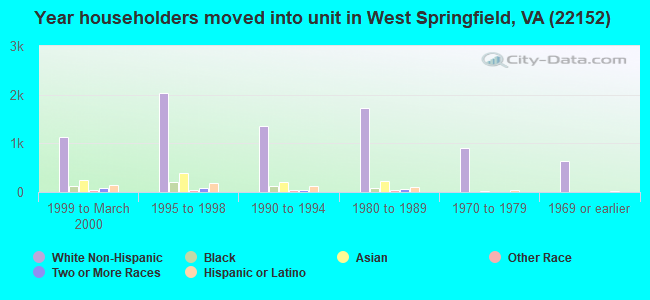
56% of the 22152 zip code residents lived in the same house 5 years ago. Out of people who lived in different houses, 48% lived in this county. Out of people who lived in different counties, 50% lived in Virginia.
87% of the 22152 zip code residents lived in the same house 1 year ago. Out of people who lived in different houses, 36% moved from this county. Out of people who lived in different houses, 23% moved from different county within same state. Out of people who lived in different houses, 25% moved from different state. Out of people who lived in different houses, 16% moved from abroad.
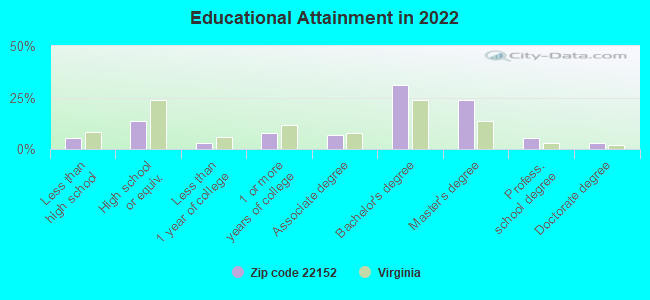
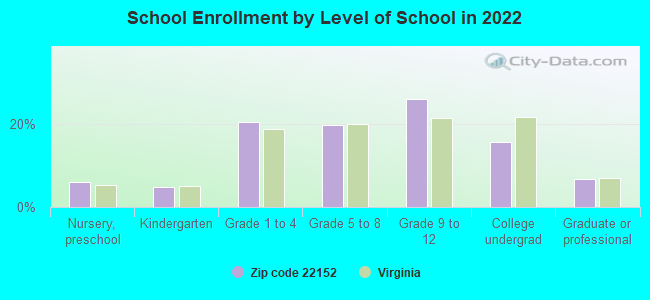
Private vs. public school enrollment:
Students in private schools in grades 1 to 8 (elementary and middle school): 290
Here:
8.3%
Virginia:
13.2%
Students in private schools in grades 9 to 12 (high school): 30
Here:
1.3%
Virginia:
10.2%
Students in private undergraduate colleges: 149
Here:
10.9%
Virginia:
18.7%
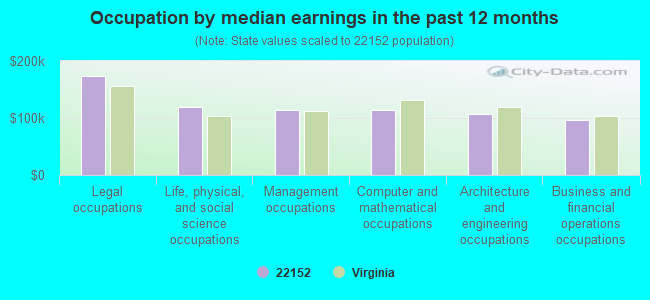
Occupation by median earnings in the past 12 months ($)
174,332Legal occupations
118,724Life, physical, and social science occupations
113,871Management occupations
113,406Computer and mathematical occupations
107,005Architecture and engineering occupations
96,844Business and financial operations occupations
Companies with biggest federal contracts located in this zip code (SPRINGFIELD, VA):
PERMUTA TECHNOLOGIES INC (6335 CAMILLA ST; small business) : $2,130,842 in 2 contractsfrom 2005 to 2006
$1,103,930 with Defense Information Systems Agency for Other ADP and Telecommunications Services (includes data storage on tapes, compact disks, etc.). Taking place in DC. Signed on 2006-03-01. Completion date: 2007-01-31.
$1,026,912 with Department of Defense for Other ADP and Telecommunications Services (includes data storage on tapes, compact disks, etc.). Signed on 2005-01-28. Completion date: 2006-01-31.
ECOPULSE, INC (7844 VERVAIN CT; small business) : $658,845 in 7 contractsfrom 2000 to 2005
Contracts for Defense Electronics and Communication Equipment -- Basic Research (R&D), Other Defense -- Applied Research and Exploratory Development (R&D), Other Defense -- Management and Support (R&D), Physical Sciences -- Basic Research (R&D), and moreby Navy, Department of Defense, Army Signed by year:2000: $99,960; 2001: $64,944; 2002: $419,008; 2003: $0; 2004: $69,933; 2005: $5,000; 2006: $0.
Biggest contracts:
$249,346 with Navy for Defense Electronics and Communication Equipment -- Basic Research (R&D). Signed on 2002-09-30. Completion date: 2003-09-30.
$99,960 with Department of Defense for Other Defense -- Applied Research and Exploratory Development (R&D). Signed on 2000-05-04. Completion date: 2000-10-31.
$99,734, same as above.Signed on 2002-08-09. Completion date: 2002-08-09.
$69,933 with Army for Other Defense -- Management and Support (R&D). Signed on 2004-12-21. Completion date: 2005-06-20.
SONIX INC. (8700 MORRISSETTE DRIVE; small business) : $599,683 in 5 contractsfrom 2000 to 2005
Contracts for Physical Properties Testing and Inspection, Laboratory Equipment and Supplies, Liquid and Gas Flow, Liquid Level, and Mechanical Motion Measuring Instruments by Navy, Army, NASA Signed by year:2000: $123,520; 2001: $0; 2002: $44,000; 2003: $0; 2004: $299,163; 2005: $133,000; 2006: $0.
Biggest contracts:
$299,163 with Navy for Physical Properties Testing and Inspection. Signed on 2004-09-28. Completion date: 2005-01-27.
$133,000 with Army for Laboratory Equipment and Supplies. Signed on 2005-09-22. Completion date: 2005-11-09.
$93,420, same as above.Signed on 2000-07-12. Completion date: 2000-09-08.
$44,000 with NASA for Liquid and Gas Flow, Liquid Level, and Mechanical Motion Measuring Instruments. Signed on 2002-05-15. Completion date: 2002-07-15.
TCS COMPUTER INC (6343-B ROLLING ROAD; small business) : $416,736 in 7 contractsfrom 2003 to 2005
Contracts for ADPE System Configuration, Other Education and Training Services, ADP Components by Minerals Management Service, Department of State, Federal Bureau of Investigation, ENERGY, Department of, and others Signed by year:2000: $0; 2001: $0; 2002: $0; 2003: $7,103; 2004: $0; 2005: $409,633; 2006: $0.
Biggest contracts:
$203,892 with Minerals Management Service for ADPE System Configuration. Signed on 2005-03-02. Completion date: 2005-04-04.
$148,376 with Department of State for ADPE System Configuration. Taking place in FL. Signed on 2005-01-28. Completion date: 2005-02-25.
$51,250 with Federal Bureau of Investigation for Other Education and Training Services. Signed on 2005-03-08. Completion date: 2005-03-31.
$6,115 with ENERGY, Department of for ADP Components. Signed on 2005-09-22. Completion date: 2005-09-30.
JOHN A SHAUD (6110 GREENLAWN CT; small business) : $205,625 in 12 contractsfrom 2002 to 2006
Contracts for Education Services, Other Administrative Support Services, Other Professional Services by Army, Air Force Signed by year:2000: $0; 2001: $0; 2002: $18,650; 2003: $84,175; 2004: $56,000; 2005: $60,600; 2006: -$13,800.
Biggest contracts:
$40,500 with Army for Education Services. Signed on 2004-12-14. Completion date: 2005-09-30.
$34,350 with Air Force for Other Administrative Support Services. Taking place in AL. Signed on 2003-06-16. Completion date: 2004-06-30.
$32,575 with Army for Education Services. Signed on 2003-01-24. Completion date: 2003-08-31.
$27,000, same as above.Signed on 2005-10-20. Completion date: 2005-12-31.
STACY S AZAMA (6184 FOREST CREEK CT; small business) : $165,900 in 3 contractsin 2002
$126,000 with Army for Other Management Support Services. Signed on 2002-01-23. Completion date: 2002-09-30.
$39,900, same as above.Signed on 2002-09-16. Completion date: 2002-09-30.
$0, same as above.Signed on 2002-01-23. Completion date: 2002-09-30.
CARBON NITER SULFUR (CNS) TECH (7201 HIDDEN RIDGE COURT; small business) : $140,000 in 3 contractsfrom 2004 to 2006
$70,000 with Army for Defense Studies. Signed on 2006-02-03. Completion date: 2007-02-05.
$50,000, same as above.Signed on 2004-12-07. Completion date: 2005-12-07.
$20,000, same as above.Signed on 2005-11-10. Completion date: 2005-12-07.
PARKER, PAUL (7906 JANSEN CT; small business) : $110,800 in 4 contractsfrom 2005 to 2006
$55,400 with Army for Laundry and Dry Cleaning Equipment. Signed on 2006-03-09. Completion date: 2006-09-30.
$27,700, same as above.Signed on 2006-01-27. Completion date: 2006-09-30.
$18,467, same as above.Signed on 2005-12-14. Completion date: 2006-09-30.
$9,233, same as above.Signed on 2005-11-22. Completion date: 2006-09-30.
INTERSTATE VAN LINES, INC (5801 ROLLING ROAD) : $101,513 in 3 contractsfrom 2000 to 2001
$75,843 with Army for Relocation Services. Signed on 2001-10-01. Completion date: 2002-09-30.
$25,670 with Air Force for Packing/Crating Services. Signed on 2000-09-21. Completion date: 2001-09-12.
$0 with Army for Relocation Services. Signed on 2001-10-01. Completion date: 2002-09-30.
PIETRAS PHD, MARIANNE E (8738 CENTER RD; small business)
$100,000 with Department of Defense for Other Special Studies and Analyses. Signed on 2002-05-23. Completion date: 2002-09-30.
Top industries in this zip code by the number of employees in 2005:
Real Estate and Rental and Leasing: Other Commercial and Industrial Machinery and Equipment Rental and Leasing (250-499 employees: 1 establishment)
Professional, Scientific, and Technical Services: Payroll Services (250-499: 1)
Health Care and Social Assistance: Residential Mental Retardation Facilities (100-249: 1, 5-9: 1)
Other Services (except Public Administration): Other Similar Organizations (except Business, Professional, Labor, and Political Organizations) (50-99: 2, 5-9: 1, 1-4: 4)
Health Care and Social Assistance: Offices of Physicians (except Mental Health Specialists) (20-49: 1, 10-19: 5, 5-9: 5, 1-4: 8)
Health Care and Social Assistance: Offices of Dentists (20-49: 1, 10-19: 3, 5-9: 6, 1-4: 9)
2004 - 2018 National Fire Incident Reporting System (NFIRS) incidents
Based on the data from the years 2004 - 2018 the average number of fire incidents per year is 31. The highest number of fire incidents - 52 took place in 2010, and the least - 2 in 2004. The data has a growing trend.
When looking into fire subcategories, the most reports belonged to: Structure Fires (45.1%), and Outside Fires (38.1%).
Fire incident types reported to NFIRS in Zip Code 22152


+$2,263
-$5,267
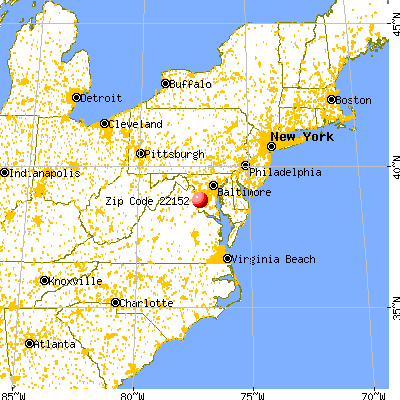
 Nearest zip codes: 22153, 22151, 22150, 22015, 22003, 22032.
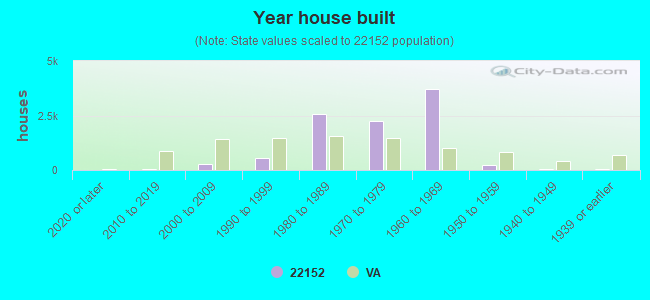


 Based on the data from the years 2004 - 2018 the average number of fire incidents per year is 31. The highest number of fire incidents - 52 took place in 2010, and the least - 2 in 2004. The data has a growing trend.
 When looking into fire subcategories, the most reports belonged to: Structure Fires (45.1%), and Outside Fires (38.1%).