Estimated zip code population in 2022: 5,704 Zip code population in 2010: 5,753 Zip code population in 2000: 5,543
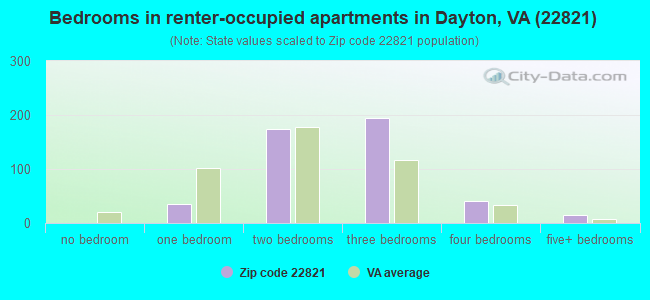
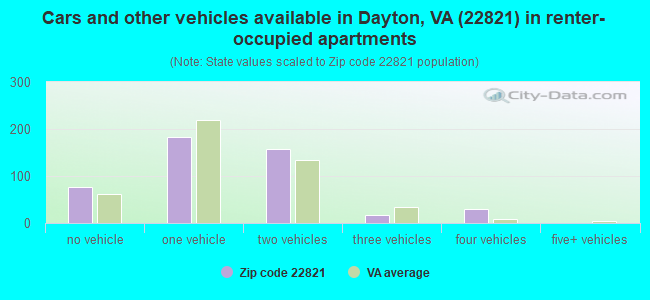
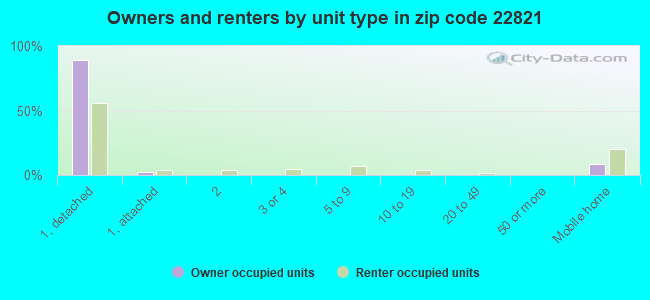
Houses and condos: 2,347 Renter-occupied apartments: 465
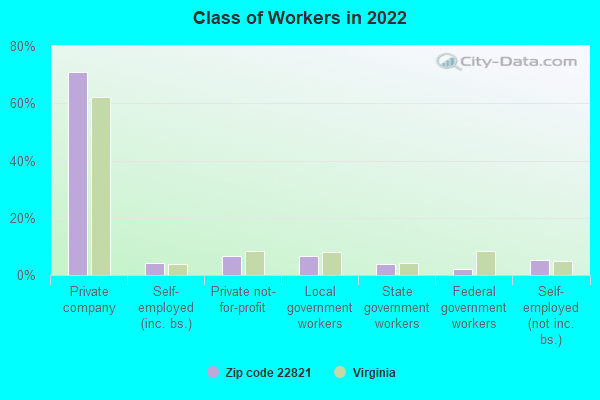
% of renters here:
21%
State:
33%
March 2022 cost of living index in zip code 22821: 84.9 (less than average, U.S. average is 100)
Land area: 81.8 sq. mi. Water area: 0.3 sq. mi.
Population density: 70 people per square mile
(very low).
OSM Map
General Map
Google Map
MSN Map
OSM Map
General Map
Google Map
MSN Map
OSM Map
General Map
Google Map
MSN Map
OSM Map
General Map
Google Map
MSN Map
Please wait while loading the map...
Real estate property taxes paid for housing units in 2022:
This zip code:
0.5% ($1,313)
Virginia:
0.7% ($2,617)
Median real estate property taxes paid for housing units with mortgages in 2022: $1,286 (0.5%) Median real estate property taxes paid for housing units with no mortgage in 2022: $1,369 (0.6%)
Business Search- 14 Million verified businesses
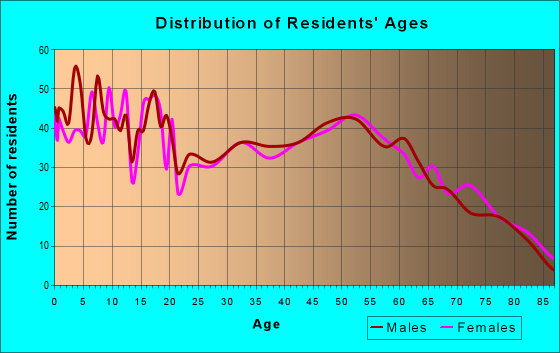
Males: 2,898
(50.8%)
Females: 2,806
(49.2%)
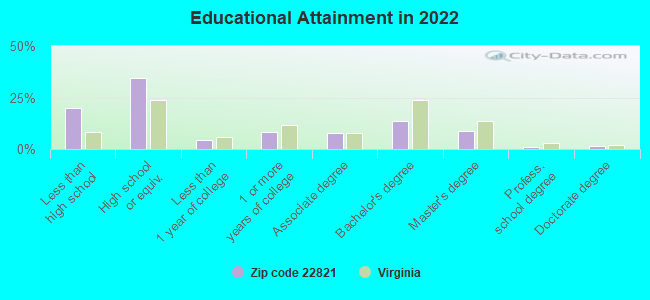
For population 25 years and over in 22821:
High school or higher: 78.8%
Bachelor's degree or higher: 24.5%
Graduate or professional degree: 11.2%
Unemployed: 1.8%
Mean travel time to work (commute): 21.0 minutes
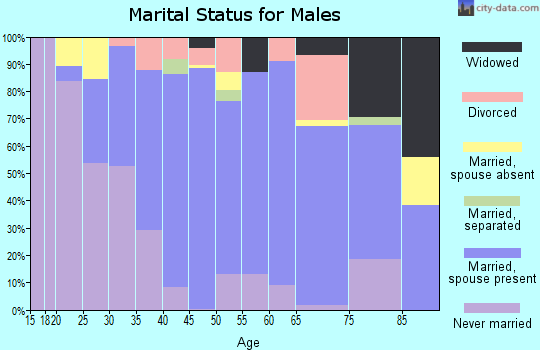
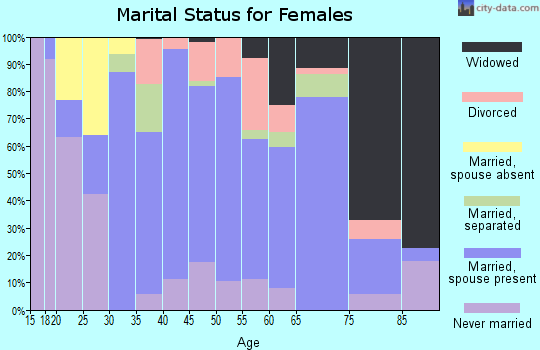
For population 15 years and over in 22821:
Never married: 27.2%
Now married: 60.4%
Separated: 0.6%
Widowed: 5.2%
Divorced: 6.6%
Zip code 22821 compared to state average:
Unemployed percentage below state average.
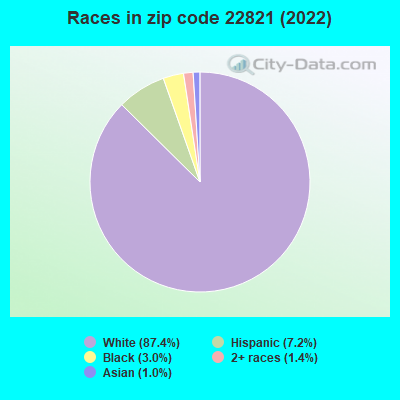
Black race population percentage significantly below state average.
Foreign-born population percentage significantly below state average.
Renting percentage below state average.
Length of stay since moving in significantly above state average.
Number of college students below state average.
Percentage of population with a bachelor's degree or higher below state average.
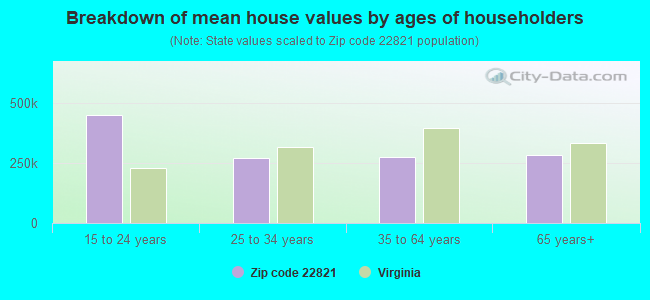
Estimated median house/condo value in 2022: $264,750
22821:
$264,750
Virginia:
$365,700
According to our research of Virginia and other state lists, there were 11 registered sex offenders living in 22821 zip code as of April 27, 2024. The ratio of all residents to sex offenders in zip code 22821 is 506 to 1. The ratio of registered sex offenders to all residents in this zip code is lower than the state average.
Median resident age:
This zip code:
39.9 years
Virginia median age:
39.0 years
Average household size:
This zip code:
2.6 people
Virginia:
2.5 people
Averages for the 2020 tax year for zip code 22821, filed in 2021:
Average Adjusted Gross Income (AGI) in 2020: $60,643 (Individual Income Tax Returns)
Here:
$60,643
State:
$86,446
Salary/wage: $49,291 (reported on 77.9% of returns)
Here:
$49,291
State:
$71,185
(% of AGI for various income ranges: 1466.2% for AGIs below $25k, 3892.1% for AGIs $25k-50k, 7601.7% for AGIs $50k-75k, 10021.9% for AGIs $75k-100k, 16318.4% for AGIs $100k-200k)
Taxable interest for individuals: $2,380 (reported on 37.1% of returns)
This zip code:
$2,380
Virginia:
$1,805
(% of AGI for various income ranges: 82.7% for AGIs below $25k, 95.8% for AGIs $25k-50k, 187.1% for AGIs $50k-75k, 152.5% for AGIs $75k-100k, 266.3% for AGIs $100k-200k)
Ordinary dividends: $4,273 (reported on 19.1% of returns)
Here:
$4,273
State:
$8,327
(% of AGI for various income ranges: 39.0% for AGIs below $25k, 51.0% for AGIs $25k-50k, 135.4% for AGIs $50k-75k, 163.1% for AGIs $75k-100k, 368.9% for AGIs $100k-200k)
Net capital gain/loss in AGI: +$12,867 (reported on 22.1% of returns)
Here:
+$12,867
State:
+$24,644
(% of AGI for various income ranges: 54.8% for AGIs below $25k, 105.8% for AGIs $25k-50k, 427.5% for AGIs $50k-75k, 420.6% for AGIs $75k-100k, 1139.5% for AGIs $100k-200k)
Profit/loss from business: +$14,968 (reported on 18.4% of returns)
Here:
+$14,968
State:
+$12,836
(% of AGI for various income ranges: 227.7% for AGIs below $25k, 287.3% for AGIs $25k-50k, 528.8% for AGIs $50k-75k, 596.2% for AGIs $75k-100k, 1407.4% for AGIs $100k-200k)
Taxable individual retirement arrangement distribution: $15,382 (reported on 8.1% of returns)
22821:
$15,382
Virginia:
$21,535
(% of AGI for various income ranges: 50.2% for AGIs below $25k, 93.8% for AGIs $25k-50k, 186.2% for AGIs $50k-75k, 316.2% for AGIs $75k-100k, 895.8% for AGIs $100k-200k)
Total itemized deductions: $31,783 (reported on 6.6% of returns)
Here:
$31,783
State:
$33,287
(% of AGI for various income ranges: 172.9% for AGIs $25k-50k, 456.2% for AGIs $50k-75k, 512.5% for AGIs $75k-100k, 804.2% for AGIs $100k-200k)
Charity contributions: $14,294 (reported on 5.9% of returns)
Here:
$14,294
State:
$10,381
(% of AGI for various income ranges: 47.7% for AGIs $25k-50k, 108.7% for AGIs $50k-75k, 211.9% for AGIs $75k-100k, 315.3% for AGIs $100k-200k)
Taxes paid: $6,072 (reported on 6.6% of returns)
22821:
$6,072
State:
$8,284
(% of AGI for various income ranges: 18.8% for AGIs $25k-50k, 72.9% for AGIs $50k-75k, 85.0% for AGIs $75k-100k, 213.7% for AGIs $100k-200k)
Earned income credit: $1,931 (reported on 11.8% of returns)
Here:
$1,931
State:
$2,214
(% of AGI for various income ranges: 72.7% for AGIs below $25k, 51.7% for AGIs $25k-50k)
Percentage of individuals using paid preparers for their 2020 taxes: 93.8%
Here:
94%
State:
92%
(% for various income ranges: 92.8% for AGIs below $25k, 93.3% for AGIs $25k-50k, 93.2% for AGIs $50k-75k, 96.3% for AGIs $75k-100k, 94.4% for AGIs $100k-200k, 100.0% for AGIs over 200k)
Averages for the 2012 tax year for zip code 22821, filed in 2013:
Average Adjusted Gross Income (AGI) in 2012: $46,305 (Individual Income Tax Returns)
Here:
$46,305
State:
$71,192
Salary/wage: $38,372 (reported on 77.9% of returns)
Here:
$38,372
State:
$59,229
(% of AGI for various income ranges: 70.6% for AGIs below $25k, 75.0% for AGIs $25k-50k, 69.0% for AGIs $50k-75k, 70.2% for AGIs $75k-100k, 58.0% for AGIs $100k-200k, 34.5% for AGIs over 200k)
Taxable interest for individuals: $2,436 (reported on 40.1% of returns)
This zip code:
$2,436
Virginia:
$1,600
(% of AGI for various income ranges: 3.4% for AGIs below $25k, 2.1% for AGIs $25k-50k, 1.9% for AGIs $50k-75k, 1.4% for AGIs $75k-100k, 2.3% for AGIs $100k-200k, 1.6% for AGIs over 200k)
Ordinary dividends: $3,349 (reported on 19.5% of returns)
Here:
$3,349
State:
$6,959
(% of AGI for various income ranges: 1.3% for AGIs below $25k, 1.0% for AGIs $25k-50k, 0.9% for AGIs $50k-75k, 1.0% for AGIs $75k-100k, 1.8% for AGIs $100k-200k, 3.0% for AGIs over 200k)
Net capital gain/loss in AGI: +$12,973 (reported on 18.3% of returns)
Here:
+$12,973
State:
+$16,672
(% of AGI for various income ranges: 1.6% for AGIs below $25k, 2.4% for AGIs $25k-50k, 3.2% for AGIs $50k-75k, 3.6% for AGIs $75k-100k, 6.4% for AGIs $100k-200k, 17.3% for AGIs over 200k)
Profit/loss from business: +$11,483 (reported on 19.8% of returns)
Here:
+$11,483
State:
+$14,116
(% of AGI for various income ranges: 11.7% for AGIs below $25k, 6.0% for AGIs $25k-50k, 3.9% for AGIs $50k-75k, 3.0% for AGIs $75k-100k, 5.1% for AGIs $100k-200k)
Taxable individual retirement arrangement distribution: $9,955 (reported on 8.4% of returns)
22821:
$9,955
Virginia:
$16,667
(% of AGI for various income ranges: 2.9% for AGIs below $25k, 2.0% for AGIs $25k-50k, 1.6% for AGIs $50k-75k, 1.4% for AGIs $75k-100k, 2.4% for AGIs $100k-200k)
Total itemized deductions: $19,280 (22% of AGI, reported on 26.3% of returns)
Here:
$19,280
State:
$26,596
Here:
22.4% of AGI
State:
20.1% of AGI
(% of AGI for various income ranges: 7.9% for AGIs below $25k, 9.3% for AGIs $25k-50k, 10.8% for AGIs $50k-75k, 11.0% for AGIs $75k-100k, 13.5% for AGIs $100k-200k, 13.0% for AGIs over 200k)
Charity contributions: $5,687 (reported on 19.8% of returns)
Here:
$5,687
State:
$4,443
(% of AGI for various income ranges: 1.1% for AGIs below $25k, 1.4% for AGIs $25k-50k, 1.9% for AGIs $50k-75k, 2.0% for AGIs $75k-100k, 4.1% for AGIs $100k-200k, 4.1% for AGIs over 200k)
Taxes paid: $5,436 (reported on 26.3% of returns)
22821:
$5,436
State:
$9,951
(% of AGI for various income ranges: 1.3% for AGIs below $25k, 1.6% for AGIs $25k-50k, 2.6% for AGIs $50k-75k, 3.3% for AGIs $75k-100k, 5.0% for AGIs $100k-200k, 4.9% for AGIs over 200k)
Earned income credit: $2,229 (reported on 15.6% of returns)
Here:
$2,229
State:
$2,211
(% of AGI for various income ranges: 5.1% for AGIs below $25k, 0.8% for AGIs $25k-50k)
Percentage of individuals using paid preparers for their 2012 taxes: 64.5%
Here:
65%
State:
46%
(% for various income ranges: 60.6% for AGIs below $25k, 64.4% for AGIs $25k-50k, 70.7% for AGIs $50k-75k, 70.0% for AGIs $75k-100k, 65.0% for AGIs $100k-200k, 75.0% for AGIs over 200k)
Averages for the 2004 tax year for zip code 22821, filed in 2005:
Average Adjusted Gross Income (AGI) in 2004: $37,474 (Individual Income Tax Returns)
Here:
$37,474
State:
$56,704
Salary/wage: $30,183 (reported on 80.0% of returns)
Here:
$30,183
State:
$48,441
(% of AGI for various income ranges: 105.4% for AGIs below $10k, 74.9% for AGIs $10k-25k, 74.9% for AGIs $25k-50k, 69.9% for AGIs $50k-75k, 67.8% for AGIs $75k-100k, 33.0% for AGIs over 100k)
Taxable interest for individuals: $2,500 (reported on 45.4% of returns)
This zip code:
$2,500
Virginia:
$1,688
(% of AGI for various income ranges: 9.7% for AGIs below $10k, 4.2% for AGIs $10k-25k, 2.3% for AGIs $25k-50k, 2.5% for AGIs $50k-75k, 4.5% for AGIs $75k-100k, 2.2% for AGIs over 100k)
Taxable dividends: $1,667 (reported on 20.9% of returns)
Here:
$1,667
State:
$4,028
(% of AGI for various income ranges: 4.0% for AGIs below $10k, 0.8% for AGIs $10k-25k, 0.8% for AGIs $25k-50k, 0.6% for AGIs $50k-75k, 1.1% for AGIs $75k-100k, 1.2% for AGIs over 100k)
Net capital gain/loss: +$10,627 (reported on 20.7% of returns)
Here:
+$10,627
State:
+$14,375
(% of AGI for various income ranges: 4.4% for AGIs below $10k, 1.7% for AGIs $10k-25k, 1.9% for AGIs $25k-50k, 3.2% for AGIs $50k-75k, 5.2% for AGIs $75k-100k, 17.0% for AGIs over 100k)
Profit/loss from business: +$7,398 (reported on 16.5% of returns)
Here:
+$7,398
State:
+$13,342
(% of AGI for various income ranges: 6.5% for AGIs below $10k, 6.1% for AGIs $10k-25k, 4.1% for AGIs $25k-50k, 3.8% for AGIs $50k-75k, 2.7% for AGIs $75k-100k, -0.2% for AGIs over 100k)
Profit/loss from farming: +$14,406 (reported on 12.3% of returns)
Here:
+$14,406
State:
-$5,267
(% of AGI for various income ranges: -16.3% for AGIs below $10k, 2.0% for AGIs $10k-25k, 5.9% for AGIs $25k-50k, 5.4% for AGIs $50k-75k, 6.4% for AGIs $75k-100k, 4.9% for AGIs over 100k)
IRA payment deduction: $3,717 (reported on 2.1% of returns)
22821:
$3,717
Virginia:
$2,943
Total itemized deductions: $15,555 (21% of AGI, reported on 22.6% of returns)
Here:
$15,555
State:
$21,492
Here:
21.2% of AGI
State:
21.0% of AGI
(% of AGI for various income ranges: 6.9% for AGIs $10k-25k, 9.1% for AGIs $25k-50k, 10.0% for AGIs $50k-75k, 12.3% for AGIs $75k-100k, 9.6% for AGIs over 100k)
Charity contributions deductions: $4,780 (6% of AGI, reported on 19.1% of returns)
Here:
$4,780
State:
$3,794
Here:
6.1% of AGI
State:
3.5% of AGI
(% of AGI for various income ranges: 1.2% for AGIs $10k-25k, 1.7% for AGIs $25k-50k, 2.4% for AGIs $50k-75k, 3.6% for AGIs $75k-100k, 3.6% for AGIs over 100k)
Total tax: $4,657 (reported on 75.2% of returns)
22821:
$4,657
State:
$9,537
(% of AGI for various income ranges: 4.4% for AGIs below $10k, 4.3% for AGIs $10k-25k, 6.5% for AGIs $25k-50k, 7.9% for AGIs $50k-75k, 9.3% for AGIs $75k-100k, 18.3% for AGIs over 100k)
Earned income credit: $1,603 (reported on 14.0% of returns)
Here:
$1,603
State:
$1,734
Percentage of individuals using paid preparers for their 2004 taxes: 68.8%
Here:
69%
State:
52%
(% for various income ranges: 63.6% for AGIs below $10k, 68.6% for AGIs $10k-25k, 70.1% for AGIs $25k-50k, 69.1% for AGIs $50k-75k, 76.1% for AGIs $75k-100k, 73.0% for AGIs over 100k)
Household received Food Stamps/SNAP in the past 12 months: 147 Household did not receive Food Stamps/SNAP in the past 12 months: 2,069
Women who had a birth in the past 12 months: 62 (46 now married, 16 unmarried) Women who did not have a birth in the past 12 months: 1,177 (566 now married, 608 unmarried)
Housing units in zip code 22821 with a mortgage: 939 (94 second mortgage, 87 both second mortgage and home equity loan) Houses without a mortgage: 107
Median monthly owner costs for units with a mortgage: $1,328 Median monthly owner costs for units without a mortgage: $434
Residents with income below the poverty level in 2022:
This zip code:
6.3%
Whole state:
10.6%
Residents with income below 50% of the poverty level in 2022:
This zip code:
4.3%
Whole state:
5.2%
Median number of rooms in houses and condos:
Here:
6.7
State:
7.0
Median number of rooms in apartments:
Here:
5.7
State:
4.3
Notable locations in this zip code not listed on our city pages
Notable locations in zip code 22821: Flint Rock Farm (A), Riverland Dairy (B), Green Hills Farm (C), Home Place Dairy (D), Union Springs Dairy (E), Hone Quarry Recreation Site (F), Buttermilk Run Poultry Farm (G), Ottobine Dairy Number 1 (H), Willow Spring Dairy (I), Clover Hill Volunteer Fire Company (J). Display/hide their locations on the map
Churches in zip code 22821 include: Pleasant View Church (A), Bank Church (B), Mount Bethel Church (C), Mount Horeb Church (D). Display/hide their locations on the map
Lakes and reservoirs: Mud Pond (A), Silver Lake (B), Hone Quarry Reservoir (C), Briery Branch Reservoir (D), Union Spring Hollow Lake (E). Display/hide their locations on the map
Streams, rivers, and creeks: Beaver Creek (A), Wolf Run (B), Union Springs Run (C), Rocky Run (D), Redbanks Run (E), Muddy Creek (F), Mines Run (G), Honey Run (H), Hone Quarry Run (I). Display/hide their locations on the map
Parks in zip code 22821 include: Skidmore Fork Scenic Area (1), Dayton Historic District (2), Skidmore Fork Scenic Area (3). Display/hide their locations on the map
In group quarters: 2 (-1 institutionalized population)
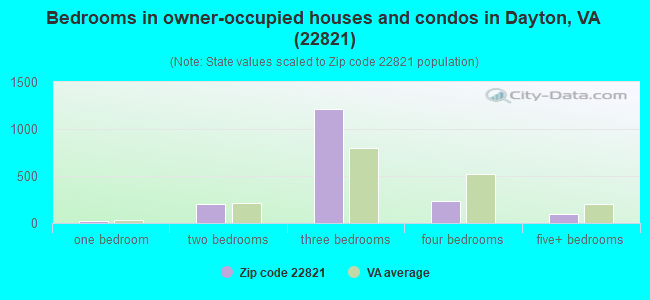
Size of family households: 638 2-persons, 661 3-persons, 260 4-persons, 68 5-persons, 4 6-persons, 68 7-or-more-persons
Size of nonfamily households: 497 1-person, 20 2-persons
925 married couples with children.
263 single-parent households (155 men, 108 women).
92.8% of residents of 22821 zip code speak English at home.
4.7% of residents speak Spanish at home (40% very well, 19% well, 42% not well).
1.0% of residents speak other Indo-European language at home (82% very well, 18% well).
1.2% of residents speak other language at home (81% well, 19% not well).
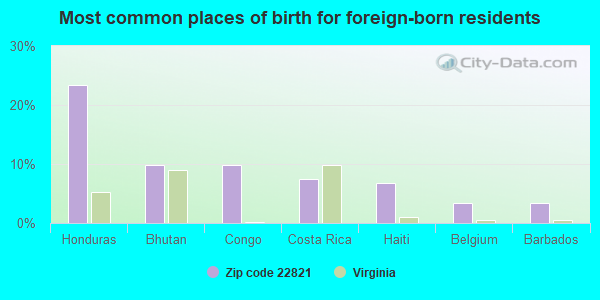
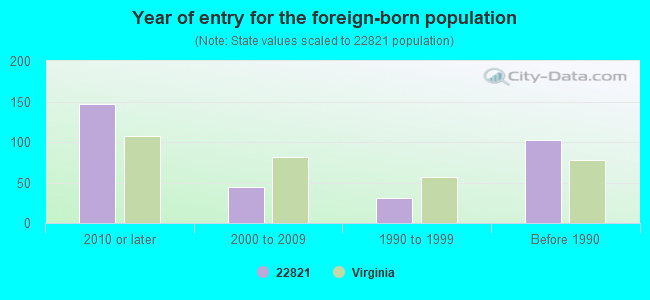
Foreign born population: 265 (4.6%) (52.9% of them are naturalized citizens)
This zip code:
4.6%
Whole state:
12.7%
23%Honduras
10%Bhutan
10%Congo
8%Costa Rica
7%Haiti
3%Belgium
3%Barbados
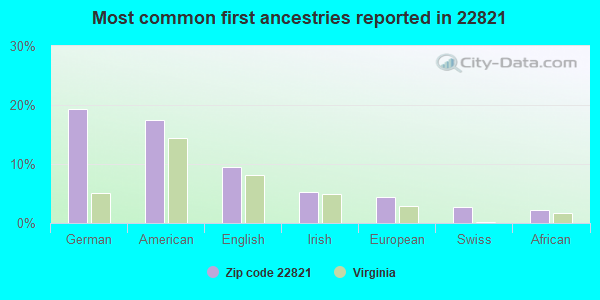
19%German
17%American
10%English
5%Irish
4%European
3%Swiss
2%African
Year of entry for the foreign-born population
1472010 or later
442000 to 2009
311990 to 1999
102Before 1990
Facilities with environmental interests located in this zip code:
DAYTON LEARNING CENTER (MAIN ST in DAYTON, VA)
AIR MINOR (AIRS/AFS) STATE MASTER (Virginia pollutants databases) - CEDS-80172, AIR PROGRAM Business SIC and NAICS classification: ELEMENTARY AND SECONDARY SCHOOLS
DAYTON LEARNING CENTER (290 MILL ST in DAYTON, VA)
(National Center for Education Statistics) - STATE ID-0821072 Organizations: ROCKINGHAM COUNTY PUBLIC SCHOOLS (SCHOOL DISTRICT)
EDGEWOOD (RT 3 in DAYTON, VA)
(Integrated Compliance Information System) - ICIS-03-1989-0275, FORMAL ENFORCEMENT ACTION COMPLIANCE ACTIVITY (Tracking inspections of insecticide, fungicide, and rodenticide, and toxic substances)
DAYTON TRANSPORT CORP (RTE 42 & ROAD 713 in DAYTON, VA)
(Resource Conservation and Recovery Act (tracking hazardous waste))
ARSENAL OF VIRGINIA INC (111 MEIGS LANE in DAYTON, VA)
AIR SYNTHETIC MINOR (AIRS/AFS) CRITERIA AND HAZARDOUS AIR POLLUTANT INVENTORY (Inventory of air pollution sources) Conditionally Exempt Small Quantity Generators, less than 100 kg/month of hazardous waste (Resource Conservation and Recovery Act (tracking hazardous waste)) Business SIC classification: TRANSPORTATION EQUIPMENT Alternative names: MID-ATLANTIC TRAILER MFG INC, MIDATLANTIC TRAILER MFG
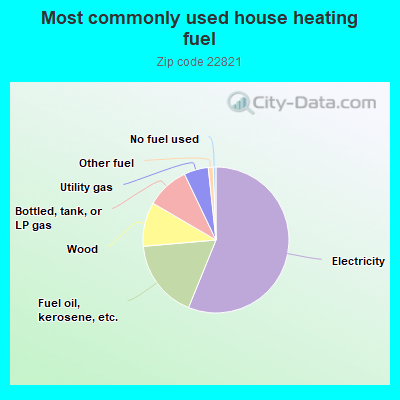
Housing units lacking complete plumbing facilities: 1.4% Housing units lacking complete kitchen facilities: 0.7%
56.2%Electricity
17.5%Fuel oil, kerosene, etc.
9.8%Wood
9.5%Bottled, tank, or LP gas
5.4%Utility gas
1.1%Other fuel
0.6%No fuel used
Population in 1990: 4,777. Population change in the 1990s: +766 (+16.0%).
Place of birth for U.S.-born residents:
This state: 4,156
Northeast: 370
Midwest: 148
South: 611
West: 66
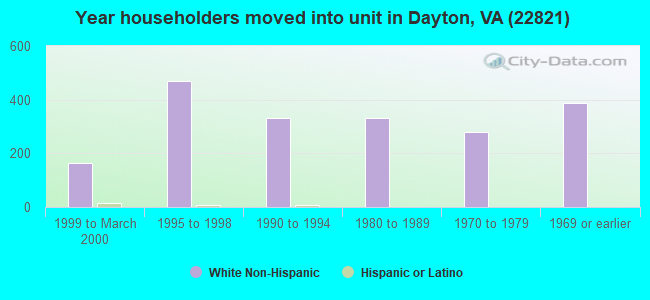
71% of the 22821 zip code residents lived in the same house 5 years ago. Out of people who lived in different houses, 67% lived in this county. Out of people who lived in different counties, 50% lived in Virginia.
95% of the 22821 zip code residents lived in the same house 1 year ago. Out of people who lived in different houses, 37% moved from this county. Out of people who lived in different houses, 54% moved from different county within same state. Out of people who lived in different houses, 10% moved from different state. Out of people who lived in different houses, 4% moved from abroad.
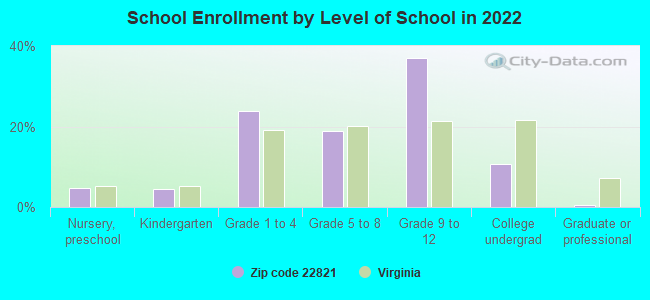
Private vs. public school enrollment:
Students in private schools in grades 1 to 8 (elementary and middle school): 179
Here:
39.1%
Virginia:
13.2%
Students in private schools in grades 9 to 12 (high school): 22
Here:
5.7%
Virginia:
10.2%
Students in private undergraduate colleges: 27
Here:
23.9%
Virginia:
18.7%
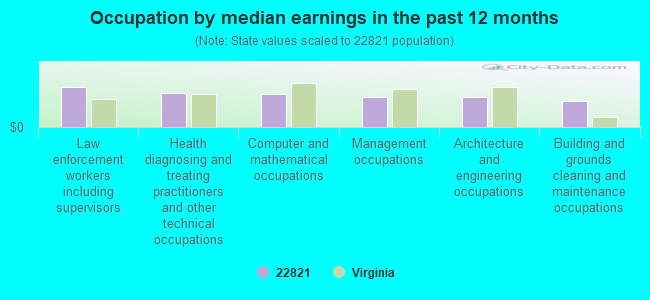
Occupation by median earnings in the past 12 months ($)
101,259Law enforcement workers including supervisors
85,830Health diagnosing and treating practitioners and other technical occupations
84,989Computer and mathematical occupations
77,292Management occupations
75,240Architecture and engineering occupations
67,194Building and grounds cleaning and maintenance occupations
Top industries in this zip code by the number of employees in 2005:
2002 - 2018 National Fire Incident Reporting System (NFIRS) incidents
Based on the data from the years 2002 - 2018 the average number of fire incidents per year is 29. The highest number of reported fires - 43 took place in 2013, and the least - 12 in 2017. The data has a dropping trend.
When looking into fire subcategories, the most reports belonged to: Structure Fires (58.1%), and Outside Fires (22.7%).
Fire incident types reported to NFIRS in Zip Code 22821


+$14,406
-$5,267
(% of AGI for various income ranges: -16.3% for AGIs below $10k, 2.0% for AGIs $10k-25k, 5.9% for AGIs $25k-50k, 5.4% for AGIs $50k-75k, 6.4% for AGIs $75k-100k, 4.9% for AGIs over 100k) Nearest zip codes: 22843, 22831, 22812, 26802, 22850, 26815.
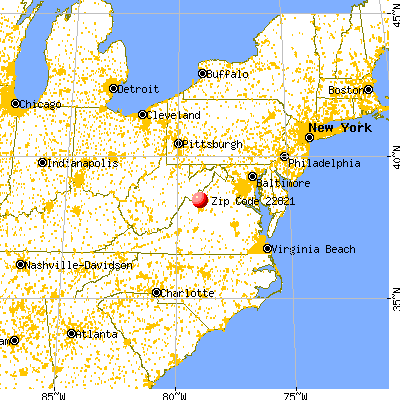
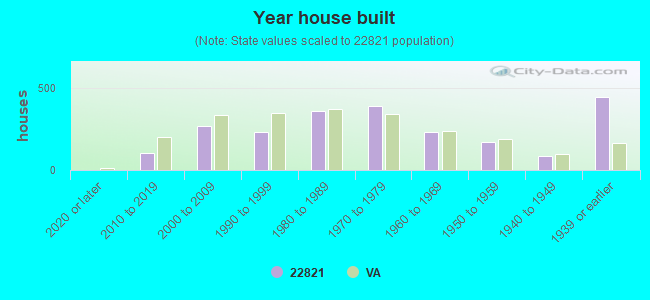


 Based on the data from the years 2002 - 2018 the average number of fire incidents per year is 29. The highest number of reported fires - 43 took place in 2013, and the least - 12 in 2017. The data has a dropping trend.
 When looking into fire subcategories, the most reports belonged to: Structure Fires (58.1%), and Outside Fires (22.7%).