Estimated zip code population in 2022: 4,915 Zip code population in 2010: 4,354 Zip code population in 2000: 3,554
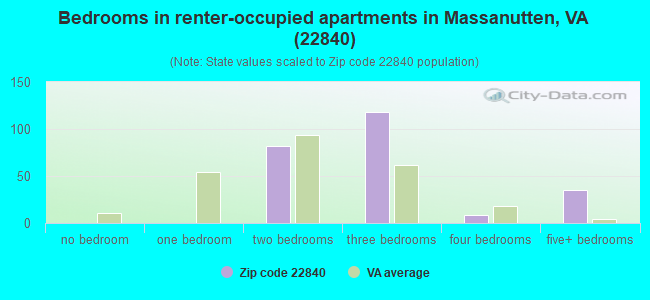
Houses and condos: 3,651 Renter-occupied apartments: 245
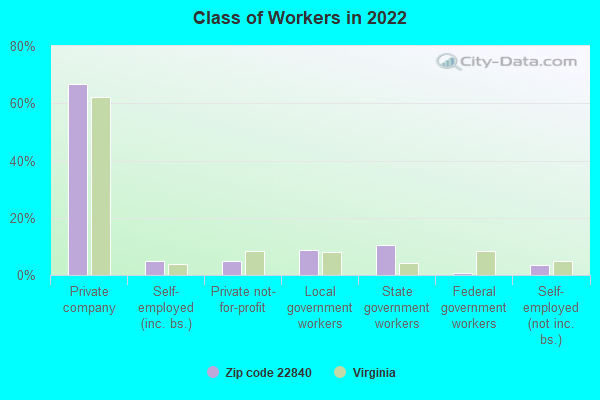
% of renters here:
12%
State:
33%
March 2022 cost of living index in zip code 22840: 87.0 (less than average, U.S. average is 100)
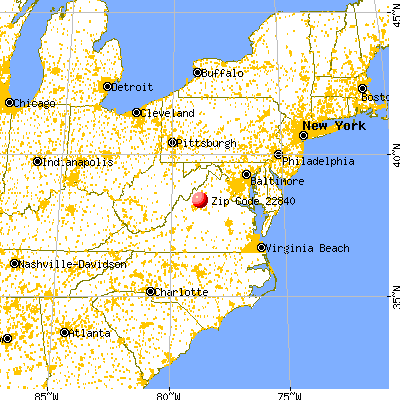
Land area: 26.4 sq. mi. Water area: 0.2 sq. mi.
Population density: 186 people per square mile
(very low).
OSM Map
General Map
Google Map
MSN Map
OSM Map
General Map
Google Map
MSN Map
OSM Map
General Map
Google Map
MSN Map
OSM Map
General Map
Google Map
MSN Map
Please wait while loading the map...
Real estate property taxes paid for housing units in 2022:
This zip code:
0.5% ($1,952)
Virginia:
0.7% ($2,617)
Median real estate property taxes paid for housing units with mortgages in 2022: $1,882 (0.5%) Median real estate property taxes paid for housing units with no mortgage in 2022: $2,219 (0.6%)
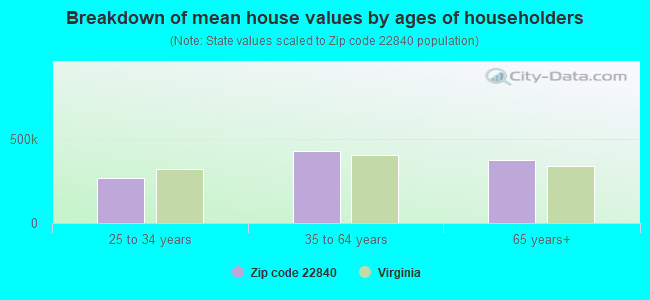
Estimated median house/condo value in 2022: $368,821
22840:
$368,821
Virginia:
$365,700
According to our research of Virginia and other state lists, there were 10 registered sex offenders living in 22840 zip code as of April 27, 2024. The ratio of all residents to sex offenders in zip code 22840 is 463 to 1. The ratio of registered sex offenders to all residents in this zip code is lower than the state average.
Median resident age:
This zip code:
48.8 years
Virginia median age:
39.0 years
Average household size:
This zip code:
2.5 people
Virginia:
2.5 people
Averages for the 2020 tax year for zip code 22840, filed in 2021:
Average Adjusted Gross Income (AGI) in 2020: $77,110 (Individual Income Tax Returns)
Here:
$77,110
State:
$86,446
Salary/wage: $62,042 (reported on 82.5% of returns)
Here:
$62,042
State:
$71,185
(% of AGI for various income ranges: 1176.5% for AGIs below $25k, 3483.3% for AGIs $25k-50k, 6526.4% for AGIs $50k-75k, 9363.2% for AGIs $75k-100k, 16152.2% for AGIs $100k-200k, 49980.0% for AGIs over 200k)
Taxable interest for individuals: $1,167 (reported on 35.9% of returns)
This zip code:
$1,167
Virginia:
$1,805
(% of AGI for various income ranges: 11.6% for AGIs below $25k, 23.2% for AGIs $25k-50k, 59.1% for AGIs $50k-75k, 52.6% for AGIs $75k-100k, 133.3% for AGIs $100k-200k, 494.0% for AGIs over 200k)
Ordinary dividends: $4,996 (reported on 23.5% of returns)
Here:
$4,996
State:
$8,327
(% of AGI for various income ranges: 34.7% for AGIs below $25k, 57.8% for AGIs $25k-50k, 163.2% for AGIs $50k-75k, 160.5% for AGIs $75k-100k, 333.0% for AGIs $100k-200k, 1610.0% for AGIs over 200k)
Net capital gain/loss in AGI: +$18,583 (reported on 19.7% of returns)
Here:
+$18,583
State:
+$24,644
(% of AGI for various income ranges: 9.5% for AGIs below $25k, 13.2% for AGIs $25k-50k, 232.7% for AGIs $50k-75k, 246.8% for AGIs $75k-100k, 478.9% for AGIs $100k-200k, 12360.0% for AGIs over 200k)
Profit/loss from business: +$11,695 (reported on 16.2% of returns)
Here:
+$11,695
State:
+$12,836
(% of AGI for various income ranges: 84.9% for AGIs below $25k, 146.2% for AGIs $25k-50k, 463.2% for AGIs $50k-75k, 278.4% for AGIs $75k-100k, 720.7% for AGIs $100k-200k)
Taxable individual retirement arrangement distribution: $19,817 (reported on 12.4% of returns)
22840:
$19,817
Virginia:
$21,535
(% of AGI for various income ranges: 70.5% for AGIs below $25k, 130.8% for AGIs $25k-50k, 278.2% for AGIs $50k-75k, 457.4% for AGIs $75k-100k, 1274.1% for AGIs $100k-200k)
Total itemized deductions: $28,579 (reported on 10.3% of returns)
Here:
$28,579
State:
$33,287
(% of AGI for various income ranges: 122.1% for AGIs below $25k, 370.5% for AGIs $50k-75k, 573.7% for AGIs $75k-100k, 939.3% for AGIs $100k-200k, 3786.0% for AGIs over 200k)
Charity contributions: $9,947 (reported on 8.1% of returns)
Here:
$9,947
State:
$10,381
(% of AGI for various income ranges: 127.3% for AGIs $50k-75k, 120.0% for AGIs $75k-100k, 294.4% for AGIs $100k-200k, 1174.0% for AGIs over 200k)
Taxes paid: $6,854 (reported on 10.3% of returns)
22840:
$6,854
State:
$8,284
(% of AGI for various income ranges: 13.7% for AGIs below $25k, 77.3% for AGIs $50k-75k, 128.4% for AGIs $75k-100k, 272.6% for AGIs $100k-200k, 872.0% for AGIs over 200k)
Earned income credit: $2,195 (reported on 9.4% of returns)
Here:
$2,195
State:
$2,214
(% of AGI for various income ranges: 59.5% for AGIs below $25k, 56.8% for AGIs $25k-50k)
Percentage of individuals using paid preparers for their 2020 taxes: 93.2%
Here:
93%
State:
92%
(% for various income ranges: 91.8% for AGIs below $25k, 94.1% for AGIs $25k-50k, 91.2% for AGIs $50k-75k, 93.1% for AGIs $75k-100k, 93.6% for AGIs $100k-200k, 100.0% for AGIs over 200k)
Averages for the 2012 tax year for zip code 22840, filed in 2013:
Average Adjusted Gross Income (AGI) in 2012: $60,151 (Individual Income Tax Returns)
Here:
$60,151
State:
$71,192
Salary/wage: $49,867 (reported on 86.4% of returns)
Here:
$49,867
State:
$59,229
(% of AGI for various income ranges: 78.0% for AGIs below $25k, 79.5% for AGIs $25k-50k, 76.4% for AGIs $50k-75k, 72.7% for AGIs $75k-100k, 73.1% for AGIs $100k-200k, 53.4% for AGIs over 200k)
Taxable interest for individuals: $1,229 (reported on 38.5% of returns)
This zip code:
$1,229
Virginia:
$1,600
(% of AGI for various income ranges: 1.6% for AGIs below $25k, 0.9% for AGIs $25k-50k, 0.8% for AGIs $50k-75k, 1.2% for AGIs $75k-100k, 0.5% for AGIs $100k-200k, 0.3% for AGIs over 200k)
Ordinary dividends: $3,822 (reported on 23.5% of returns)
Here:
$3,822
State:
$6,959
(% of AGI for various income ranges: 1.8% for AGIs below $25k, 1.5% for AGIs $25k-50k, 1.3% for AGIs $50k-75k, 1.4% for AGIs $75k-100k, 1.8% for AGIs $100k-200k, 1.1% for AGIs over 200k)
Net capital gain/loss in AGI: +$6,397 (reported on 18.3% of returns)
Here:
+$6,397
State:
+$16,672
(% of AGI for various income ranges: 1.2% for AGIs below $25k, 0.2% for AGIs $25k-50k, 0.7% for AGIs $50k-75k, 1.2% for AGIs $75k-100k, 2.0% for AGIs $100k-200k, 5.8% for AGIs over 200k)
Profit/loss from business: +$9,669 (reported on 15.0% of returns)
Here:
+$9,669
State:
+$14,116
(% of AGI for various income ranges: 5.9% for AGIs below $25k, 2.8% for AGIs $25k-50k, 3.0% for AGIs $50k-75k, 2.1% for AGIs $75k-100k, 2.7% for AGIs $100k-200k)
Taxable individual retirement arrangement distribution: $13,592 (reported on 11.7% of returns)
22840:
$13,592
Virginia:
$16,667
(% of AGI for various income ranges: 3.4% for AGIs below $25k, 3.5% for AGIs $25k-50k, 2.5% for AGIs $50k-75k, 3.1% for AGIs $75k-100k, 3.3% for AGIs $100k-200k)
Total itemized deductions: $21,093 (21% of AGI, reported on 39.0% of returns)
Here:
$21,093
State:
$26,596
Here:
20.7% of AGI
State:
20.1% of AGI
(% of AGI for various income ranges: 6.9% for AGIs below $25k, 10.9% for AGIs $25k-50k, 14.2% for AGIs $50k-75k, 14.9% for AGIs $75k-100k, 15.9% for AGIs $100k-200k, 12.7% for AGIs over 200k)
Charity contributions: $4,434 (reported on 30.0% of returns)
Here:
$4,434
State:
$4,443
(% of AGI for various income ranges: 0.7% for AGIs below $25k, 1.2% for AGIs $25k-50k, 2.1% for AGIs $50k-75k, 2.2% for AGIs $75k-100k, 3.2% for AGIs $100k-200k, 2.1% for AGIs over 200k)
Taxes paid: $6,512 (reported on 39.0% of returns)
22840:
$6,512
State:
$9,951
(% of AGI for various income ranges: 0.9% for AGIs below $25k, 2.0% for AGIs $25k-50k, 3.4% for AGIs $50k-75k, 4.4% for AGIs $75k-100k, 5.5% for AGIs $100k-200k, 5.7% for AGIs over 200k)
Earned income credit: $1,957 (reported on 13.1% of returns)
Here:
$1,957
State:
$2,211
(% of AGI for various income ranges: 4.7% for AGIs below $25k, 0.9% for AGIs $25k-50k)
Percentage of individuals using paid preparers for their 2012 taxes: 50.7%
Here:
51%
State:
46%
(% for various income ranges: 46.4% for AGIs below $25k, 51.0% for AGIs $25k-50k, 52.9% for AGIs $50k-75k, 51.9% for AGIs $75k-100k, 51.7% for AGIs $100k-200k, 80.0% for AGIs over 200k)
Averages for the 2004 tax year for zip code 22840, filed in 2005:
Average Adjusted Gross Income (AGI) in 2004: $53,298 (Individual Income Tax Returns)
Here:
$53,298
State:
$56,704
Salary/wage: $44,492 (reported on 87.8% of returns)
Here:
$44,492
State:
$48,441
(% of AGI for various income ranges: 133.2% for AGIs below $10k, 78.5% for AGIs $10k-25k, 79.8% for AGIs $25k-50k, 81.7% for AGIs $50k-75k, 83.7% for AGIs $75k-100k, 55.8% for AGIs over 100k)
Taxable interest for individuals: $1,173 (reported on 46.4% of returns)
This zip code:
$1,173
Virginia:
$1,688
(% of AGI for various income ranges: 4.7% for AGIs below $10k, 2.1% for AGIs $10k-25k, 1.6% for AGIs $25k-50k, 0.8% for AGIs $50k-75k, 0.8% for AGIs $75k-100k, 0.7% for AGIs over 100k)
Taxable dividends: $2,556 (reported on 29.1% of returns)
Here:
$2,556
State:
$4,028
(% of AGI for various income ranges: 5.8% for AGIs below $10k, 2.1% for AGIs $10k-25k, 1.3% for AGIs $25k-50k, 1.6% for AGIs $50k-75k, 0.5% for AGIs $75k-100k, 1.5% for AGIs over 100k)
Net capital gain/loss: +$10,549 (reported on 24.2% of returns)
Here:
+$10,549
State:
+$14,375
(% of AGI for various income ranges: 2.3% for AGIs below $10k, 0.4% for AGIs $10k-25k, 0.9% for AGIs $25k-50k, 1.6% for AGIs $50k-75k, 1.5% for AGIs $75k-100k, 11.7% for AGIs over 100k)
Profit/loss from business: +$11,451 (reported on 14.7% of returns)
Here:
+$11,451
State:
+$13,342
(% of AGI for various income ranges: -9.8% for AGIs below $10k, 3.4% for AGIs $10k-25k, 4.1% for AGIs $25k-50k, 1.9% for AGIs $50k-75k, 2.5% for AGIs $75k-100k, 4.2% for AGIs over 100k)
Profit/loss from farming: +$465 (reported on 2.2% of returns)
Here:
+$465
State:
-$5,267
IRA payment deduction: $2,893 (reported on 2.9% of returns)
22840:
$2,893
Virginia:
$2,943
(% of AGI for various income ranges: 0.3% for AGIs $10k-25k, 0.3% for AGIs $25k-50k, 0.2% for AGIs $50k-75k, 0.1% for AGIs $75k-100k)
Self-employed pension: $11,115 (reported on 1.3% of returns)
Here:
$11,115
Virginia:
$17,430
Total itemized deductions: $16,019 (19% of AGI, reported on 43.7% of returns)
Here:
$16,019
State:
$21,492
Here:
19.1% of AGI
State:
21.0% of AGI
(% of AGI for various income ranges: 10.7% for AGIs below $10k, 8.6% for AGIs $10k-25k, 13.8% for AGIs $25k-50k, 15.4% for AGIs $50k-75k, 15.0% for AGIs $75k-100k, 11.2% for AGIs over 100k)
Charity contributions deductions: $2,828 (3% of AGI, reported on 36.2% of returns)
Here:
$2,828
State:
$3,794
Here:
3.2% of AGI
State:
3.5% of AGI
(% of AGI for various income ranges: 1.1% for AGIs $10k-25k, 1.5% for AGIs $25k-50k, 1.8% for AGIs $50k-75k, 2.4% for AGIs $75k-100k, 2.2% for AGIs over 100k)
Total tax: $7,345 (reported on 81.8% of returns)
22840:
$7,345
State:
$9,537
(% of AGI for various income ranges: 3.0% for AGIs below $10k, 4.3% for AGIs $10k-25k, 7.0% for AGIs $25k-50k, 8.3% for AGIs $50k-75k, 10.4% for AGIs $75k-100k, 17.5% for AGIs over 100k)
Earned income credit: $1,663 (reported on 9.7% of returns)
Here:
$1,663
State:
$1,734
Percentage of individuals using paid preparers for their 2004 taxes: 53.4%
Here:
53%
State:
52%
(% for various income ranges: 45.1% for AGIs below $10k, 50.6% for AGIs $10k-25k, 56.1% for AGIs $25k-50k, 54.8% for AGIs $50k-75k, 54.2% for AGIs $75k-100k, 61.3% for AGIs over 100k)
Household received Food Stamps/SNAP in the past 12 months: 212 Household did not receive Food Stamps/SNAP in the past 12 months: 1,790
Women who had a birth in the past 12 months: 81 (53 now married, 27 unmarried) Women who did not have a birth in the past 12 months: 970 (527 now married, 439 unmarried)
Housing units in zip code 22840 with a mortgage: 1,130 (91 second mortgage, 89 both second mortgage and home equity loan) Houses without a mortgage: 90
Median monthly owner costs for units with a mortgage: $1,663 Median monthly owner costs for units without a mortgage: $598
Residents with income below the poverty level in 2022:
This zip code:
6.9%
Whole state:
10.6%
Residents with income below 50% of the poverty level in 2022:
This zip code:
2.6%
Whole state:
5.2%
Median number of rooms in houses and condos:
Here:
6.8
State:
7.0
Median number of rooms in apartments:
Here:
4.6
State:
4.3
Notable locations in this zip code not listed on our city pages
Size of family households: 928 2-persons, 317 3-persons, 164 4-persons, 77 5-persons, 57 6-persons
Size of nonfamily households: 305 1-person, 155 2-persons
648 married couples with children.
183 single-parent households (42 men, 141 women).
84.0% of residents of 22840 zip code speak English at home.
10.9% of residents speak Spanish at home (89% very well, 4% well, 7% not well).
5.1% of residents speak other Indo-European language at home (76% very well, 12% well, 11% not well).
0.4% of residents speak other language at home (100% very well).
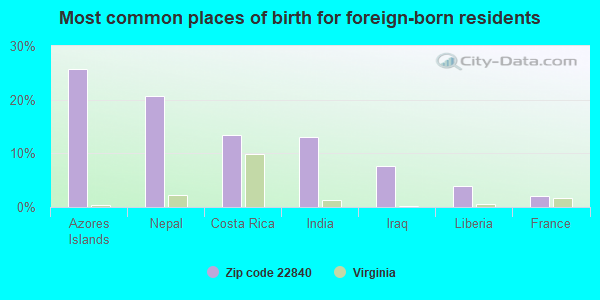
Foreign born population: 462 (9.4%) (44.1% of them are naturalized citizens)
This zip code:
9.4%
Whole state:
12.7%
26%Azores Islands
21%Nepal
13%Costa Rica
13%India
8%Iraq
4%Liberia
2%France
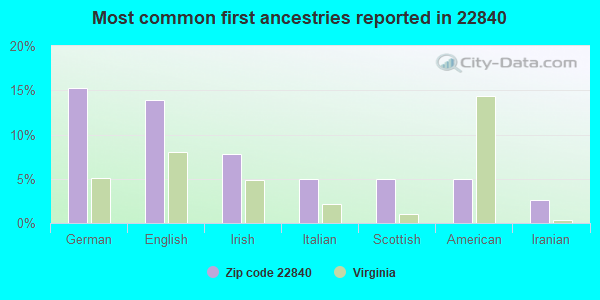
15%German
14%English
8%Irish
5%Italian
5%Scottish
5%American
3%Iranian
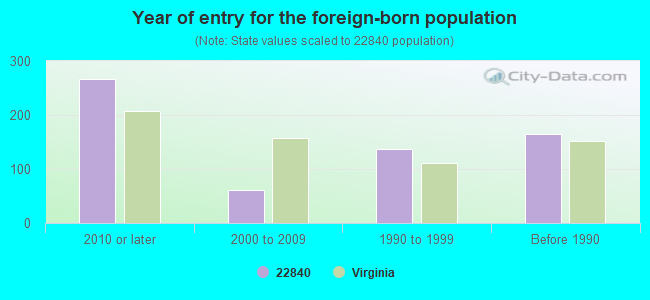
Year of entry for the foreign-born population
2672010 or later
612000 to 2009
1371990 to 1999
164Before 1990
Public elementary/middle school in in zip code 22840 not listed on the city page:
Housing units lacking complete plumbing facilities: 0.2% Housing units lacking complete kitchen facilities: 0.2%
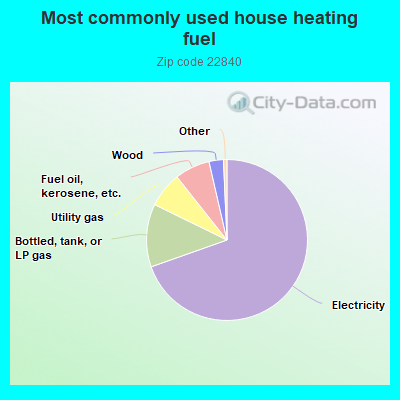
69.8%Electricity
12.7%Bottled, tank, or LP gas
7.1%Utility gas
7.1%Fuel oil, kerosene, etc.
2.9%Wood
Population in 1990: 2,100. Population change in the 1990s: +1,454 (+69.2%).
Place of birth for U.S.-born residents:
This state: 2,319
Northeast: 918
Midwest: 173
South: 691
West: 194
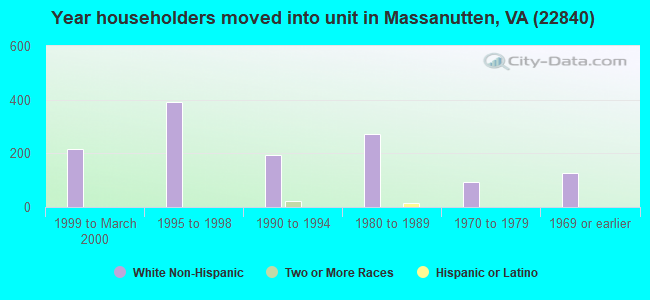
54% of the 22840 zip code residents lived in the same house 5 years ago. Out of people who lived in different houses, 51% lived in this county. Out of people who lived in different counties, 50% lived in Virginia.
87% of the 22840 zip code residents lived in the same house 1 year ago. Out of people who lived in different houses, 27% moved from this county. Out of people who lived in different houses, 64% moved from different county within same state. Out of people who lived in different houses, 6% moved from different state. Out of people who lived in different houses, 2% moved from abroad.
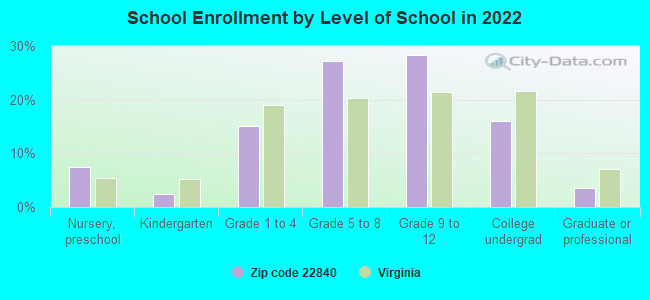
Private vs. public school enrollment:
Students in private schools in grades 1 to 8 (elementary and middle school): 186
Here:
42.9%
Virginia:
13.2%
Students in private schools in grades 9 to 12 (high school): 28
Here:
10.2%
Virginia:
10.2%
Students in private undergraduate colleges:
Here:
0.0%
Virginia:
18.7%
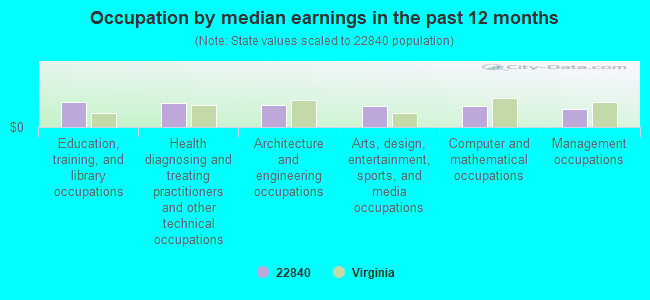
Occupation by median earnings in the past 12 months ($)
88,365Education, training, and library occupations
85,080Health diagnosing and treating practitioners and other technical occupations
77,404Architecture and engineering occupations
75,987Arts, design, entertainment, sports, and media occupations
75,802Computer and mathematical occupations
65,900Management occupations
Top industries in this zip code by the number of employees in 2005:
Real Estate and Rental and Leasing: Offices of Real Estate Agents and Brokers (500-999 employees: 1 establishment, 1-4 employees: 1 establishment)
Accommodation and Food Services: Hotels (except Casino Hotels) and Motels (500-999: 1)
Other Services (except Public Administration): Other Similar Organizations (except Business, Professional, Labor, and Political Organizations) (50-99: 1, 20-49: 1)
Accommodation and Food Services: Full-Service Restaurants (50-99: 1, 1-4: 2)
Accommodation and Food Services: Cafeterias (20-49: 1)
Accommodation and Food Services: Limited-Service Restaurants (20-49: 1)
Construction: Water and Sewer Line and Related Structures Construction (20-49: 1)
Construction: New Housing Operative Builders (20-49: 1)
Other Services (except Public Administration): Religious Organizations (10-19: 1, 1-4: 2)
Fatal accident statistics in 2014:
Fatal accident count: 1
Vehicles involved in fatal accidents: 1
Fatal accidents caused by drunken drivers: 1
Fatalities: 1
Persons involved in fatal accidents: 1
Pedestrians involved in fatal accidents: 0
Fatal accident statistics in 2010:
Fatal accident count: 1
Vehicles involved in fatal accidents: 2
Fatal accidents caused by drunken drivers: 0
Fatalities: 1
Persons involved in fatal accidents: 3
Pedestrians involved in fatal accidents: 0
Home Mortgage Disclosure Act Aggregated Statistics For Year 2009 (Based on 6 partial tracts)
A) FHA, FSA/RHS & VA Home Purchase Loans
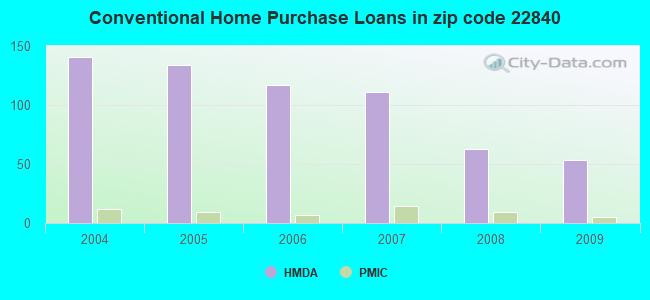
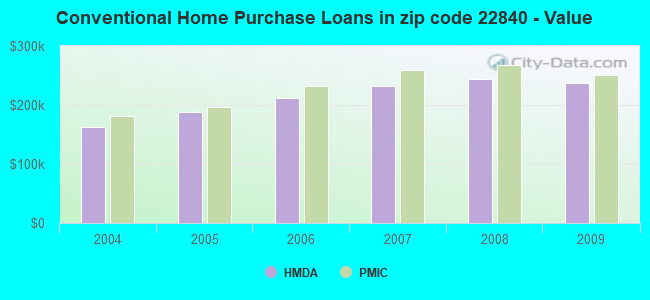
B) Conventional Home Purchase Loans
C) Refinancings
D) Home Improvement Loans
F) Non-occupant Loans on < 5 Family Dwellings (A B C & D)
G) Loans On Manufactured Home Dwelling (A B C & D)
Number
Average Value
Number
Average Value
Number
Average Value
Number
Average Value
Number
Average Value
Number
Average Value
LOANS ORIGINATED
13
$223,279
53
$236,718
226
$217,406
9
$154,032
17
$204,619
4
$122,418
APPLICATIONS APPROVED, NOT ACCEPTED
0
$0
1
$202,350
7
$179,927
2
$28,520
1
$128,500
0
$0
APPLICATIONS DENIED
3
$149,620
5
$275,036
47
$231,348
4
$100,165
4
$178,098
3
$83,067
APPLICATIONS WITHDRAWN
1
$321,150
8
$173,921
36
$255,846
1
$107,250
2
$103,845
0
$0
FILES CLOSED FOR INCOMPLETENESS
0
$0
1
$92,960
7
$221,207
0
$0
1
$214,630
0
$0
Aggregated Statistics For Year 2008 (Based on 6 partial tracts)
A) FHA, FSA/RHS & VA Home Purchase Loans
B) Conventional Home Purchase Loans
C) Refinancings
D) Home Improvement Loans
F) Non-occupant Loans on < 5 Family Dwellings (A B C & D)
G) Loans On Manufactured Home Dwelling (A B C & D)
Number
Average Value
Number
Average Value
Number
Average Value
Number
Average Value
Number
Average Value
Number
Average Value
LOANS ORIGINATED
11
$178,025
63
$244,543
111
$208,928
16
$154,174
19
$215,158
4
$117,408
APPLICATIONS APPROVED, NOT ACCEPTED
1
$85,510
9
$222,051
15
$196,935
2
$42,335
3
$152,613
1
$137,880
APPLICATIONS DENIED
2
$232,855
10
$180,688
59
$217,296
5
$162,152
5
$178,180
5
$109,234
APPLICATIONS WITHDRAWN
4
$163,930
9
$179,102
29
$221,414
1
$119,130
2
$137,515
1
$109,860
FILES CLOSED FOR INCOMPLETENESS
0
$0
3
$209,283
7
$278,621
0
$0
1
$237,910
0
$0
Aggregated Statistics For Year 2007 (Based on 6 partial tracts)
A) FHA, FSA/RHS & VA Home Purchase Loans
B) Conventional Home Purchase Loans
C) Refinancings
D) Home Improvement Loans
F) Non-occupant Loans on < 5 Family Dwellings (A B C & D)
G) Loans On Manufactured Home Dwelling (A B C & D)
Number
Average Value
Number
Average Value
Number
Average Value
Number
Average Value
Number
Average Value
Number
Average Value
LOANS ORIGINATED
3
$183,840
111
$232,745
115
$191,492
14
$86,089
23
$224,078
4
$112,338
APPLICATIONS APPROVED, NOT ACCEPTED
0
$0
13
$222,188
20
$168,747
4
$57,202
2
$350,740
0
$0
APPLICATIONS DENIED
0
$0
10
$234,770
57
$219,499
5
$36,050
4
$213,325
4
$61,638
APPLICATIONS WITHDRAWN
0
$0
8
$183,655
33
$174,997
1
$154,780
2
$269,050
0
$0
FILES CLOSED FOR INCOMPLETENESS
0
$0
3
$184,277
9
$222,764
0
$0
1
$121,180
0
$0
Aggregated Statistics For Year 2006 (Based on 6 partial tracts)
A) FHA, FSA/RHS & VA Home Purchase Loans
B) Conventional Home Purchase Loans
C) Refinancings
D) Home Improvement Loans
F) Non-occupant Loans on < 5 Family Dwellings (A B C & D)
G) Loans On Manufactured Home Dwelling (A B C & D)
Number
Average Value
Number
Average Value
Number
Average Value
Number
Average Value
Number
Average Value
Number
Average Value
LOANS ORIGINATED
3
$193,307
117
$211,077
131
$181,737
13
$75,788
39
$183,974
5
$106,448
APPLICATIONS APPROVED, NOT ACCEPTED
0
$0
12
$166,007
17
$195,763
1
$56,780
4
$214,342
1
$91,980
APPLICATIONS DENIED
1
$138,140
17
$168,164
62
$180,205
6
$52,008
6
$170,752
6
$68,398
APPLICATIONS WITHDRAWN
0
$0
13
$212,132
40
$171,452
1
$51,180
4
$205,008
0
$0
FILES CLOSED FOR INCOMPLETENESS
0
$0
1
$498,980
10
$257,143
0
$0
0
$0
0
$0
Aggregated Statistics For Year 2005 (Based on 6 partial tracts)
A) FHA, FSA/RHS & VA Home Purchase Loans
B) Conventional Home Purchase Loans
C) Refinancings
D) Home Improvement Loans
F) Non-occupant Loans on < 5 Family Dwellings (A B C & D)
G) Loans On Manufactured Home Dwelling (A B C & D)
Number
Average Value
Number
Average Value
Number
Average Value
Number
Average Value
Number
Average Value
Number
Average Value
LOANS ORIGINATED
7
$180,313
134
$187,747
141
$166,658
17
$91,502
34
$160,429
6
$76,997
APPLICATIONS APPROVED, NOT ACCEPTED
0
$0
11
$186,335
18
$140,061
4
$60,288
2
$205,180
1
$40,940
APPLICATIONS DENIED
0
$0
14
$158,638
73
$125,761
9
$79,933
7
$122,509
9
$84,667
APPLICATIONS WITHDRAWN
0
$0
13
$223,907
43
$170,898
4
$75,745
3
$205,670
1
$147,460
FILES CLOSED FOR INCOMPLETENESS
0
$0
2
$425,305
8
$135,695
0
$0
0
$0
0
$0
Aggregated Statistics For Year 2004 (Based on 6 partial tracts)
A) FHA, FSA/RHS & VA Home Purchase Loans
B) Conventional Home Purchase Loans
C) Refinancings
D) Home Improvement Loans
F) Non-occupant Loans on < 5 Family Dwellings (A B C & D)
G) Loans On Manufactured Home Dwelling (A B C & D)
2002 - 2018 National Fire Incident Reporting System (NFIRS) incidents
Based on the data from the years 2002 - 2018 the average number of fires per year is 31. The highest number of reported fires - 58 took place in 2006, and the least - 1 in 2003. The data has an increasing trend.
When looking into fire subcategories, the most incidents belonged to: Structure Fires (52.8%), and Outside Fires (26.8%).
Fire incident types reported to NFIRS in Zip Code 22840


+$465
-$5,267
 Nearest zip codes: 22832, 22846, 22827, 24471, 22849, 22807.


 (Students: 453, Location: 9508 SPOTSWOOD TRAIL, Grades: PK-5)

 Based on the data from the years 2002 - 2018 the average number of fires per year is 31. The highest number of reported fires - 58 took place in 2006, and the least - 1 in 2003. The data has an increasing trend.
 When looking into fire subcategories, the most incidents belonged to: Structure Fires (52.8%), and Outside Fires (26.8%).