Estimated zip code population in 2022: 5,257 Zip code population in 2010: 5,044 Zip code population in 2000: 4,552
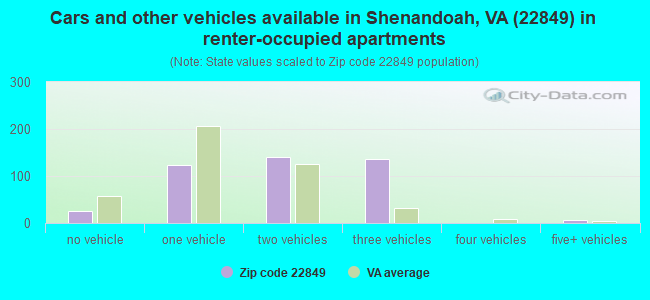
Houses and condos: 2,373 Renter-occupied apartments: 441
% of renters here:
22%
State:
33%
March 2022 cost of living index in zip code 22849: 84.1 (less than average, U.S. average is 100)
Land area: 47.0 sq. mi. Water area: 0.7 sq. mi.
Population density: 112 people per square mile
(very low).
OSM Map
General Map
Google Map
MSN Map
OSM Map
General Map
Google Map
MSN Map
OSM Map
General Map
Google Map
MSN Map
OSM Map
General Map
Google Map
MSN Map
Please wait while loading the map...
Real estate property taxes paid for housing units in 2022:
This zip code:
0.7% ($1,268)
Virginia:
0.7% ($2,617)
Median real estate property taxes paid for housing units with mortgages in 2022: $1,267 (0.6%) Median real estate property taxes paid for housing units with no mortgage in 2022: $1,301 (0.8%)
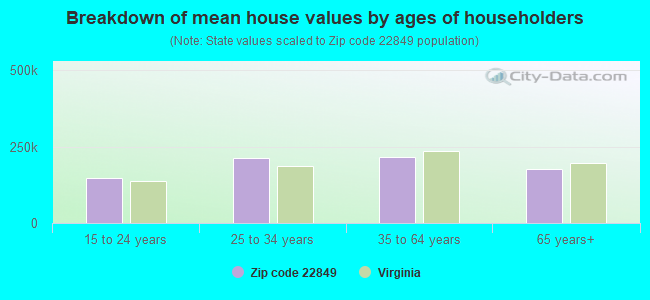
Estimated median house/condo value in 2022: $181,559
22849:
$181,559
Virginia:
$365,700
According to our research of Virginia and other state lists, there were 10 registered sex offenders living in 22849 zip code as of April 27, 2024. The ratio of all residents to sex offenders in zip code 22849 is 479 to 1. The ratio of registered sex offenders to all residents in this zip code is lower than the state average.
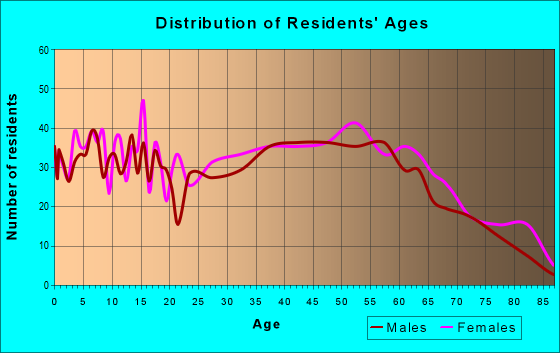
Median resident age:
This zip code:
40.8 years
Virginia median age:
39.0 years
Average household size:
This zip code:
2.7 people
Virginia:
2.5 people
Averages for the 2020 tax year for zip code 22849, filed in 2021:
Average Adjusted Gross Income (AGI) in 2020: $49,917 (Individual Income Tax Returns)
Here:
$49,917
State:
$86,446
Salary/wage: $44,602 (reported on 84.6% of returns)
Here:
$44,602
State:
$71,185
(% of AGI for various income ranges: 1178.4% for AGIs below $25k, 3546.7% for AGIs $25k-50k, 5999.7% for AGIs $50k-75k, 8166.5% for AGIs $75k-100k, 16476.2% for AGIs $100k-200k)
Taxable interest for individuals: $1,484 (reported on 21.9% of returns)
This zip code:
$1,484
Virginia:
$1,805
(% of AGI for various income ranges: 11.8% for AGIs below $25k, 10.9% for AGIs $25k-50k, 50.3% for AGIs $50k-75k, 45.0% for AGIs $75k-100k, 238.1% for AGIs $100k-200k)
Ordinary dividends: $3,093 (reported on 12.3% of returns)
Here:
$3,093
State:
$8,327
(% of AGI for various income ranges: 11.5% for AGIs below $25k, 15.1% for AGIs $25k-50k, 96.9% for AGIs $50k-75k, 39.5% for AGIs $75k-100k, 225.0% for AGIs $100k-200k)
Net capital gain/loss in AGI: +$8,714 (reported on 9.2% of returns)
Here:
+$8,714
State:
+$24,644
(% of AGI for various income ranges: 0.7% for AGIs below $25k, 22.5% for AGIs $25k-50k, 45.2% for AGIs $50k-75k, 109.0% for AGIs $75k-100k, 845.6% for AGIs $100k-200k)
Profit/loss from business: +$8,232 (reported on 9.6% of returns)
Here:
+$8,232
State:
+$12,836
(% of AGI for various income ranges: 72.0% for AGIs below $25k, 106.7% for AGIs $25k-50k, 162.1% for AGIs $50k-75k, 137.0% for AGIs $75k-100k, 52.5% for AGIs $100k-200k)
Taxable individual retirement arrangement distribution: $16,883 (reported on 10.1% of returns)
22849:
$16,883
Virginia:
$21,535
(% of AGI for various income ranges: 52.7% for AGIs below $25k, 130.4% for AGIs $25k-50k, 305.9% for AGIs $50k-75k, 423.0% for AGIs $75k-100k, 714.4% for AGIs $100k-200k)
Total itemized deductions: $22,071 (reported on 3.1% of returns)
Here:
$22,071
State:
$33,287
(% of AGI for various income ranges: 302.8% for AGIs $50k-75k, 416.9% for AGIs $100k-200k)
Charity contributions: $5,425 (reported on 1.8% of returns)
Here:
$5,425
State:
$10,381
(% of AGI for various income ranges: 135.6% for AGIs $100k-200k)
Taxes paid: $6,414 (reported on 3.1% of returns)
22849:
$6,414
State:
$8,284
(% of AGI for various income ranges: 66.9% for AGIs $50k-75k, 159.4% for AGIs $100k-200k)
Earned income credit: $2,085 (reported on 18.0% of returns)
Here:
$2,085
State:
$2,214
(% of AGI for various income ranges: 91.5% for AGIs below $25k, 64.0% for AGIs $25k-50k)
Percentage of individuals using paid preparers for their 2020 taxes: 93.4%
Here:
93%
State:
92%
(% for various income ranges: 93.2% for AGIs below $25k, 93.9% for AGIs $25k-50k, 94.6% for AGIs $50k-75k, 92.0% for AGIs $75k-100k, 92.3% for AGIs $100k-200k)
Averages for the 2012 tax year for zip code 22849, filed in 2013:
Average Adjusted Gross Income (AGI) in 2012: $41,791 (Individual Income Tax Returns)
Here:
$41,791
State:
$71,192
Salary/wage: $36,851 (reported on 86.6% of returns)
Here:
$36,851
State:
$59,229
(% of AGI for various income ranges: 76.0% for AGIs below $25k, 82.7% for AGIs $25k-50k, 79.8% for AGIs $50k-75k, 77.9% for AGIs $75k-100k, 65.7% for AGIs $100k-200k)
Taxable interest for individuals: $1,513 (reported on 25.3% of returns)
This zip code:
$1,513
Virginia:
$1,600
(% of AGI for various income ranges: 0.9% for AGIs below $25k, 0.7% for AGIs $25k-50k, 0.8% for AGIs $50k-75k, 0.7% for AGIs $75k-100k, 1.4% for AGIs $100k-200k)
Ordinary dividends: $2,703 (reported on 13.8% of returns)
Here:
$2,703
State:
$6,959
(% of AGI for various income ranges: 0.9% for AGIs below $25k, 0.4% for AGIs $25k-50k, 1.0% for AGIs $50k-75k, 0.9% for AGIs $75k-100k, 1.3% for AGIs $100k-200k)
Net capital gain/loss in AGI: +$4,311 (reported on 8.3% of returns)
Here:
+$4,311
State:
+$16,672
(% of AGI for various income ranges: 0.2% for AGIs $25k-50k, 0.8% for AGIs $50k-75k, 1.2% for AGIs $75k-100k, 1.8% for AGIs $100k-200k)
Profit/loss from business: +$6,458 (reported on 11.1% of returns)
Here:
+$6,458
State:
+$14,116
(% of AGI for various income ranges: 6.0% for AGIs below $25k, 1.2% for AGIs $25k-50k, 1.4% for AGIs $50k-75k, 0.4% for AGIs $75k-100k, 1.1% for AGIs $100k-200k)
Taxable individual retirement arrangement distribution: $14,127 (reported on 10.1% of returns)
22849:
$14,127
Virginia:
$16,667
(% of AGI for various income ranges: 2.5% for AGIs below $25k, 2.4% for AGIs $25k-50k, 3.1% for AGIs $50k-75k, 3.8% for AGIs $75k-100k, 5.1% for AGIs $100k-200k)
Total itemized deductions: $17,471 (23% of AGI, reported on 22.6% of returns)
Here:
$17,471
State:
$26,596
Here:
23.0% of AGI
State:
20.1% of AGI
(% of AGI for various income ranges: 5.1% for AGIs below $25k, 8.4% for AGIs $25k-50k, 9.3% for AGIs $50k-75k, 11.7% for AGIs $75k-100k, 11.2% for AGIs $100k-200k)
Charity contributions: $3,084 (reported on 14.7% of returns)
Here:
$3,084
State:
$4,443
(% of AGI for various income ranges: 0.5% for AGIs below $25k, 0.8% for AGIs $25k-50k, 1.1% for AGIs $50k-75k, 1.5% for AGIs $75k-100k, 1.4% for AGIs $100k-200k)
Taxes paid: $5,424 (reported on 22.6% of returns)
22849:
$5,424
State:
$9,951
(% of AGI for various income ranges: 1.0% for AGIs below $25k, 1.7% for AGIs $25k-50k, 2.6% for AGIs $50k-75k, 3.7% for AGIs $75k-100k, 5.0% for AGIs $100k-200k)
Earned income credit: $2,070 (reported on 21.7% of returns)
Here:
$2,070
State:
$2,211
(% of AGI for various income ranges: 6.3% for AGIs below $25k, 1.2% for AGIs $25k-50k)
Percentage of individuals using paid preparers for their 2012 taxes: 59.4%
Here:
59%
State:
46%
(% for various income ranges: 54.4% for AGIs below $25k, 56.9% for AGIs $25k-50k, 66.7% for AGIs $50k-75k, 66.7% for AGIs $75k-100k, 73.3% for AGIs $100k-200k)
Averages for the 2004 tax year for zip code 22849, filed in 2005:
Average Adjusted Gross Income (AGI) in 2004: $34,667 (Individual Income Tax Returns)
Here:
$34,667
State:
$56,704
Salary/wage: $32,028 (reported on 87.7% of returns)
Here:
$32,028
State:
$48,441
(% of AGI for various income ranges: 82.7% for AGIs below $10k, 80.0% for AGIs $10k-25k, 84.5% for AGIs $25k-50k, 86.9% for AGIs $50k-75k, 78.8% for AGIs $75k-100k, 62.0% for AGIs over 100k)
Taxable interest for individuals: $1,268 (reported on 35.1% of returns)
This zip code:
$1,268
Virginia:
$1,688
(% of AGI for various income ranges: 3.8% for AGIs below $10k, 2.0% for AGIs $10k-25k, 0.9% for AGIs $25k-50k, 0.9% for AGIs $50k-75k, 1.3% for AGIs $75k-100k, 1.4% for AGIs over 100k)
Taxable dividends: $1,898 (reported on 15.8% of returns)
Here:
$1,898
State:
$4,028
(% of AGI for various income ranges: 2.2% for AGIs below $10k, 1.1% for AGIs $10k-25k, 0.7% for AGIs $25k-50k, 0.7% for AGIs $50k-75k, 0.9% for AGIs $75k-100k, 0.9% for AGIs over 100k)
Net capital gain/loss: +$5,850 (reported on 10.7% of returns)
Here:
+$5,850
State:
+$14,375
(% of AGI for various income ranges: -1.0% for AGIs below $10k, 0.4% for AGIs $10k-25k, 1.9% for AGIs $25k-50k, 0.8% for AGIs $50k-75k, 1.8% for AGIs $75k-100k, 6.4% for AGIs over 100k)
Profit/loss from business: +$8,478 (reported on 10.8% of returns)
Here:
+$8,478
State:
+$13,342
(% of AGI for various income ranges: 3.5% for AGIs below $10k, 3.6% for AGIs $10k-25k, 2.1% for AGIs $25k-50k, 1.3% for AGIs $50k-75k, 3.3% for AGIs $75k-100k, 5.1% for AGIs over 100k)
IRA payment deduction: $2,850 (reported on 1.9% of returns)
22849:
$2,850
Virginia:
$2,943
Total itemized deductions: $13,821 (22% of AGI, reported on 21.2% of returns)
Here:
$13,821
State:
$21,492
Here:
22.3% of AGI
State:
21.0% of AGI
(% of AGI for various income ranges: 6.1% for AGIs $10k-25k, 7.2% for AGIs $25k-50k, 10.1% for AGIs $50k-75k, 11.3% for AGIs $75k-100k, 10.0% for AGIs over 100k)
Charity contributions deductions: $2,615 (4% of AGI, reported on 15.5% of returns)
Here:
$2,615
State:
$3,794
Here:
3.9% of AGI
State:
3.5% of AGI
(% of AGI for various income ranges: 0.5% for AGIs $10k-25k, 0.7% for AGIs $25k-50k, 1.6% for AGIs $50k-75k, 1.7% for AGIs $75k-100k, 1.9% for AGIs over 100k)
Total tax: $3,895 (reported on 75.9% of returns)
22849:
$3,895
State:
$9,537
(% of AGI for various income ranges: 2.6% for AGIs below $10k, 4.5% for AGIs $10k-25k, 6.6% for AGIs $25k-50k, 8.7% for AGIs $50k-75k, 11.2% for AGIs $75k-100k, 16.8% for AGIs over 100k)
Earned income credit: $1,578 (reported on 18.3% of returns)
Here:
$1,578
State:
$1,734
Percentage of individuals using paid preparers for their 2004 taxes: 64.7%
Here:
65%
State:
52%
(% for various income ranges: 54.4% for AGIs below $10k, 63.5% for AGIs $10k-25k, 65.7% for AGIs $25k-50k, 71.6% for AGIs $50k-75k, 72.6% for AGIs $75k-100k, 78.0% for AGIs over 100k)
Household received Food Stamps/SNAP in the past 12 months: 264 Household did not receive Food Stamps/SNAP in the past 12 months: 1,709
Women who had a birth in the past 12 months: 20 (15 now married, 5 unmarried) Women who did not have a birth in the past 12 months: 1,197 (497 now married, 700 unmarried)
Housing units in zip code 22849 with a mortgage: 714 (75 second mortgage, 20 home equity loan, 24 both second mortgage and home equity loan) Houses without a mortgage: 13
Median monthly owner costs for units with a mortgage: $1,241 Median monthly owner costs for units without a mortgage: $344
Residents with income below the poverty level in 2022:
This zip code:
14.5%
Whole state:
10.6%
Residents with income below 50% of the poverty level in 2022:
This zip code:
13.2%
Whole state:
5.2%
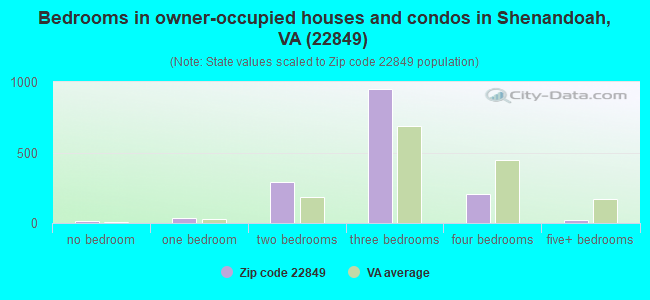
Median number of rooms in houses and condos:
Here:
5.7
State:
7.0
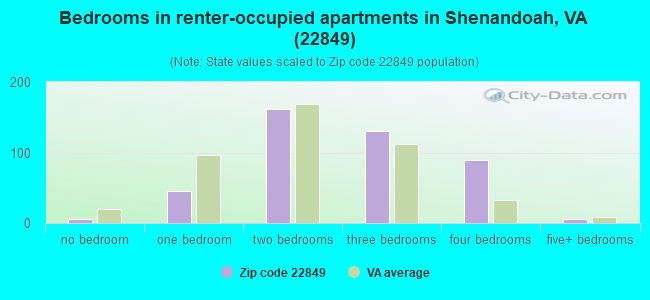
Median number of rooms in apartments:
Here:
5.4
State:
4.3
Notable locations in this zip code not listed on our city pages
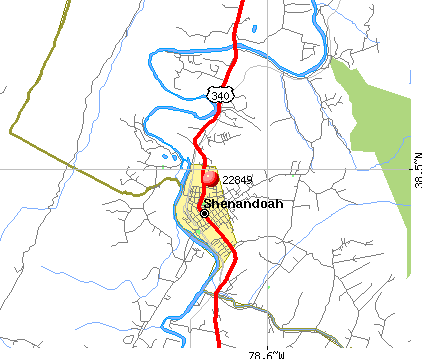
Churches in zip code 22849 include: Saint Pauls Church (A), Trinity Church (B), Independent Church (C), Fields United Methodist Church (D), First Christian Church (E), Grove Hill United Methodist Church (F), Shenandoah Assembly of God Church (G), Mount Lebanon Church (H), Oak Grove Church (I). Display/hide their locations on the map
Cemeteries: Comer Cemetery (1), Koontz Cemetery (2), Saint Pauls Cemetery (3), Rinaca Cemetery (4), Grove Hill Cemetery (5). Display/hide their locations on the map
Streams, rivers, and creeks: Roaring Run (A), Pitt Spring Run (B), Peterfish Run (C), Morgan Run (D), Fultz Run (E), Foltz Creek (F), Cub Run (G), Crooked Run (H), Hickory Run (I). Display/hide their locations on the map
Size of family households: 656 2-persons, 265 3-persons, 233 4-persons, 91 5-persons, 99 6-persons, 33 7-or-more-persons
Size of nonfamily households: 494 1-person, 94 2-persons
575 married couples with children.
331 single-parent households (91 men, 240 women).
94.9% of residents of 22849 zip code speak English at home.
4.9% of residents speak Spanish at home (59% very well, 35% well, 6% not well).
0.1% of residents speak other Indo-European language at home (100% very well).
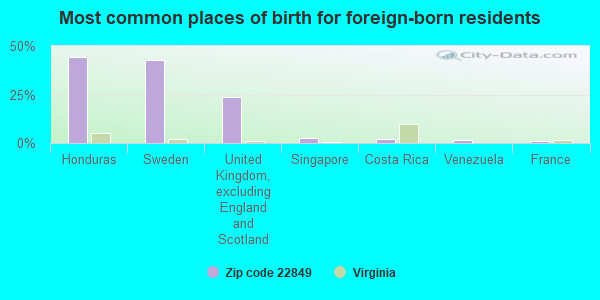
Foreign born population: 302 (5.8%) (59.0% of them are naturalized citizens)
This zip code:
5.8%
Whole state:
12.7%
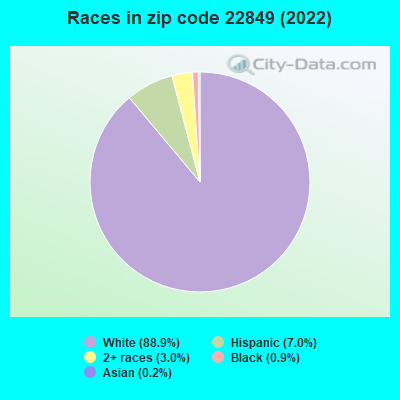
44%Honduras
43%Sweden
24%United Kingdom, excluding England and Scotland
3%Singapore
2%Costa Rica
1%Venezuela
1%France
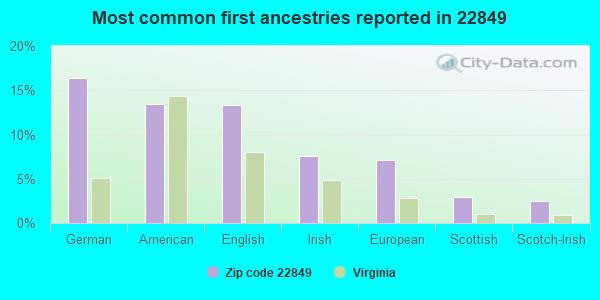
16%German
13%American
13%English
8%Irish
7%European
3%Scottish
2%Scotch-Irish
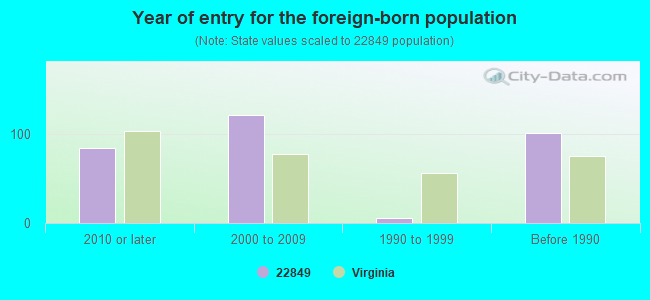
Year of entry for the foreign-born population
852010 or later
1222000 to 2009
61990 to 1999
102Before 1990
Facilities with environmental interests located in this zip code:
CERRO METAL PRODUCTS CO - SHENANDOAH (500 QUINCY AVENUE in SHENANDOAH, VA)
AIR MINOR (AIRS/AFS) STATE MASTER (Virginia pollutants databases) - CEDS-81162, AIR PROGRAM (Integrated Compliance Information System) - ICIS-03-2000-0645, FORMAL ENFORCEMENT ACTION TRI REPORTER (Tracking of toxic chemicals releasing facilities) Business SIC classification: SCREW MACHINE PRODUCTS Business NAICS classification: PRECISION TURNED PRODUCT MANUFACTURING. Alternative names: CERRO FABRICATED PRODUCTS, CERRO METAL PRODS. CO., CERRO METAL PRODS. CO.
Housing units lacking complete plumbing facilities: 4.0% Housing units lacking complete kitchen facilities: 0.6%
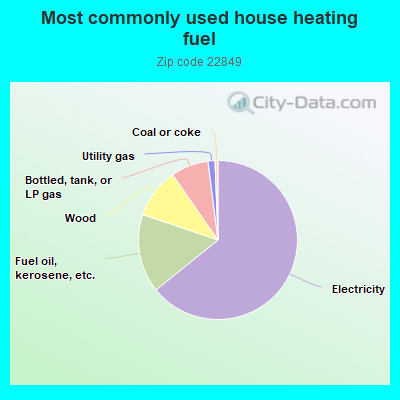
63.9%Electricity
15.9%Fuel oil, kerosene, etc.
10.1%Wood
7.6%Bottled, tank, or LP gas
1.4%Utility gas
0.6%Coal or coke
Population in 1990: 5,174.
Place of birth for U.S.-born residents:
This state: 3,867
Northeast: 215
Midwest: 216
South: 489
West: 120
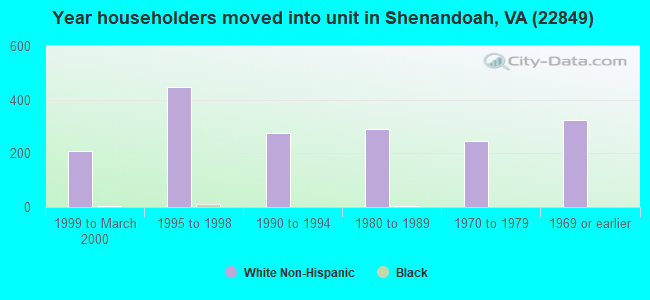
65% of the 22849 zip code residents lived in the same house 5 years ago. Out of people who lived in different houses, 50% lived in this county. Out of people who lived in different counties, 50% lived in Virginia.
94% of the 22849 zip code residents lived in the same house 1 year ago. Out of people who lived in different houses, 34% moved from this county. Out of people who lived in different houses, 53% moved from different county within same state. Out of people who lived in different houses, 9% moved from different state. Out of people who lived in different houses, 9% moved from abroad.
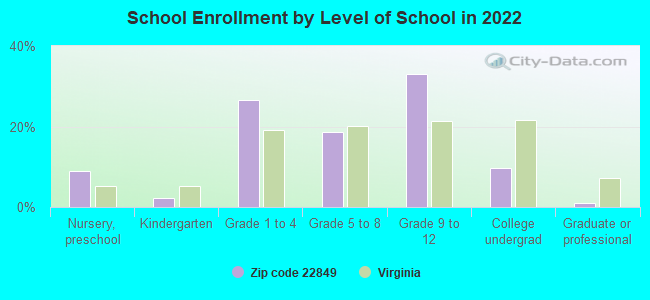
Private vs. public school enrollment:
Students in private schools in grades 1 to 8 (elementary and middle school): 32
Here:
6.0%
Virginia:
13.2%
Students in private schools in grades 9 to 12 (high school): 9
Here:
2.5%
Virginia:
10.2%
Students in private undergraduate colleges: 28
Here:
24.6%
Virginia:
18.7%
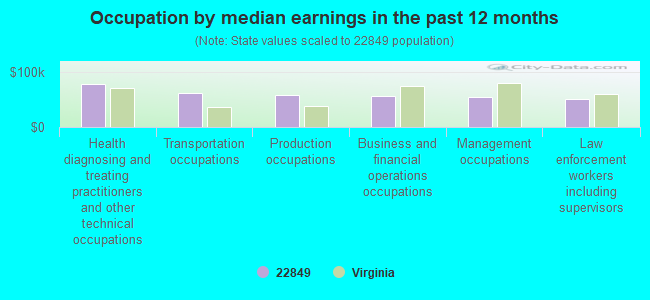
Occupation by median earnings in the past 12 months ($)
77,498Health diagnosing and treating practitioners and other technical occupations
62,041Transportation occupations
57,995Production occupations
55,982Business and financial operations occupations
55,384Management occupations
50,641Law enforcement workers including supervisors
Top industries in this zip code by the number of employees in 2005:
Construction: New Single-Family Housing Construction (except Operative Builders) (5-9: 2, 1-4: 1)
Accommodation and Food Services: Limited-Service Restaurants (10-19: 1)
People in group quarters in 2000:
8 people in other noninstitutional group quarters
Fatal accident statistics in 2012:
Fatal accident count: 1
Vehicles involved in fatal accidents: 1
Fatal accidents caused by drunken drivers: 0
Fatalities: 2
Persons involved in fatal accidents: 3
Pedestrians involved in fatal accidents: 0
Fatal accident statistics in 2010:
Fatal accident count: 2
Vehicles involved in fatal accidents: 2
Fatal accidents caused by drunken drivers: 0
Fatalities: 2
Persons involved in fatal accidents: 3
Pedestrians involved in fatal accidents: 0
2002 - 2018 National Fire Incident Reporting System (NFIRS) incidents
Based on the data from the years 2002 - 2018 the average number of fires per year is 38. The highest number of reported fires - 68 took place in 2013, and the least - 0 in 2003. The data has a rising trend.
When looking into fire subcategories, the most reports belonged to: Structure Fires (47.5%), and Outside Fires (34.5%).
Fire incident types reported to NFIRS in Zip Code 22849


 Nearest zip codes: 22827, 22851, 22844, 22840, 22832, 22853.
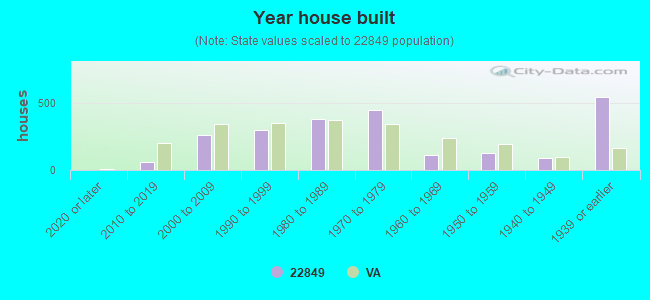


 Based on the data from the years 2002 - 2018 the average number of fires per year is 38. The highest number of reported fires - 68 took place in 2013, and the least - 0 in 2003. The data has a rising trend.
 When looking into fire subcategories, the most reports belonged to: Structure Fires (47.5%), and Outside Fires (34.5%).