Estimated zip code population in 2022: 54,022 Zip code population in 2010: 49,825 Zip code population in 2000: 48,680
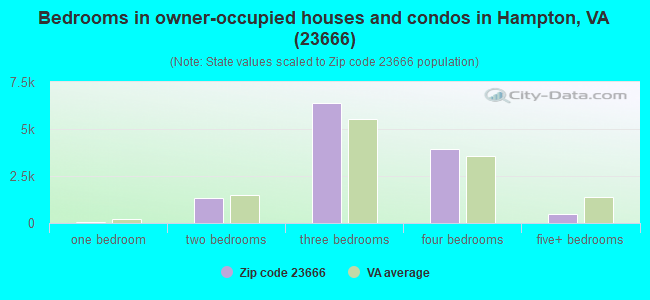
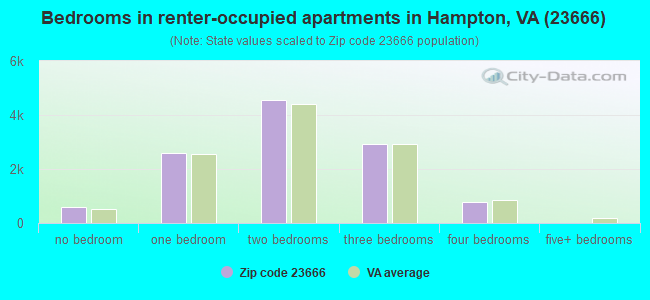
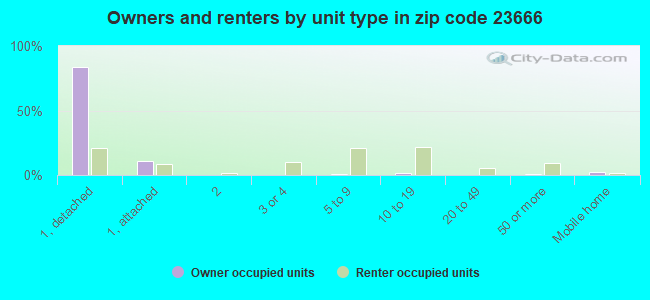
Houses and condos: 25,377 Renter-occupied apartments: 11,476
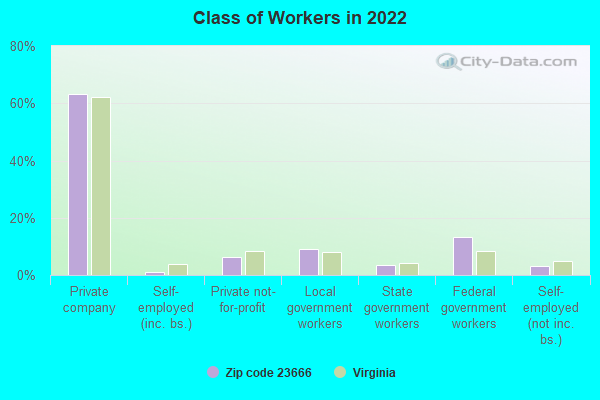
% of renters here:
48%
State:
33%
March 2022 cost of living index in zip code 23666: 96.1 (near average, U.S. average is 100)
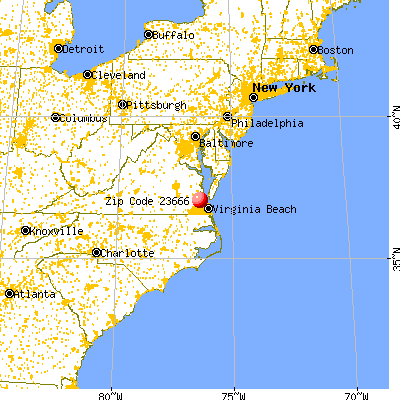
Land area: 19.8 sq. mi. Water area: 0.7 sq. mi.
Population density: 2,730 people per square mile
(average).
OSM Map
General Map
Google Map
MSN Map
OSM Map
General Map
Google Map
MSN Map
OSM Map
General Map
Google Map
MSN Map
OSM Map
General Map
Google Map
MSN Map
Please wait while loading the map...
Real estate property taxes paid for housing units in 2022:
This zip code:
0.9% ($2,262)
Virginia:
0.7% ($2,617)
Median real estate property taxes paid for housing units with mortgages in 2022: $2,268 (0.9%) Median real estate property taxes paid for housing units with no mortgage in 2022: $2,294 (0.9%)
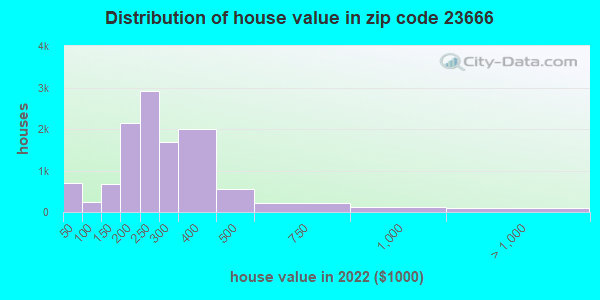
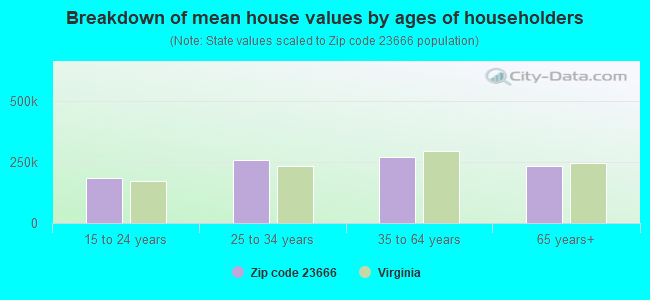
Estimated median house/condo value in 2022: $243,657
23666:
$243,657
Virginia:
$365,700
According to our research of Virginia and other state lists, there were 143 registered sex offenders living in 23666 zip code as of April 27, 2024. The ratio of all residents to sex offenders in zip code 23666 is 370 to 1. The ratio of registered sex offenders to all residents in this zip code is near the state average.
Median resident age:
This zip code:
36.5 years
Virginia median age:
39.0 years
Average household size:
This zip code:
2.2 people
Virginia:
2.5 people
Averages for the 2020 tax year for zip code 23666, filed in 2021:
Average Adjusted Gross Income (AGI) in 2020: $49,871 (Individual Income Tax Returns)
Here:
$49,871
State:
$86,446
Salary/wage: $44,750 (reported on 85.5% of returns)
Here:
$44,750
State:
$71,185
(% of AGI for various income ranges: 1260.6% for AGIs below $25k, 3711.6% for AGIs $25k-50k, 6479.3% for AGIs $50k-75k, 9497.9% for AGIs $75k-100k, 17771.6% for AGIs $100k-200k, 54097.8% for AGIs over 200k)
Taxable interest for individuals: $814 (reported on 22.6% of returns)
This zip code:
$814
Virginia:
$1,805
(% of AGI for various income ranges: 7.5% for AGIs below $25k, 9.5% for AGIs $25k-50k, 22.1% for AGIs $50k-75k, 43.4% for AGIs $75k-100k, 109.4% for AGIs $100k-200k, 772.2% for AGIs over 200k)
Ordinary dividends: $2,517 (reported on 10.4% of returns)
Here:
$2,517
State:
$8,327
(% of AGI for various income ranges: 5.9% for AGIs below $25k, 10.5% for AGIs $25k-50k, 27.1% for AGIs $50k-75k, 57.7% for AGIs $75k-100k, 159.6% for AGIs $100k-200k, 1914.4% for AGIs over 200k)
Net capital gain/loss in AGI: +$5,101 (reported on 8.4% of returns)
Here:
+$5,101
State:
+$24,644
(% of AGI for various income ranges: 2.4% for AGIs below $25k, 6.0% for AGIs $25k-50k, 21.6% for AGIs $50k-75k, 50.9% for AGIs $75k-100k, 278.9% for AGIs $100k-200k, 6006.7% for AGIs over 200k)
Profit/loss from business: +$908 (reported on 14.4% of returns)
Here:
+$908
State:
+$12,836
(% of AGI for various income ranges: 1.6% for AGIs below $25k, 8.8% for AGIs $50k-75k, 22.5% for AGIs $75k-100k, 170.9% for AGIs $100k-200k, 827.8% for AGIs over 200k)
Taxable individual retirement arrangement distribution: $13,357 (reported on 5.6% of returns)
23666:
$13,357
Virginia:
$21,535
(% of AGI for various income ranges: 22.2% for AGIs below $25k, 38.0% for AGIs $25k-50k, 95.2% for AGIs $50k-75k, 211.5% for AGIs $75k-100k, 450.3% for AGIs $100k-200k, 3071.1% for AGIs over 200k)
Total itemized deductions: $27,203 (reported on 9.1% of returns)
Here:
$27,203
State:
$33,287
(% of AGI for various income ranges: 37.2% for AGIs below $25k, 147.9% for AGIs $25k-50k, 412.9% for AGIs $50k-75k, 724.9% for AGIs $75k-100k, 1505.6% for AGIs $100k-200k, 6957.8% for AGIs over 200k)
Charity contributions: $9,159 (reported on 7.7% of returns)
Here:
$9,159
State:
$10,381
(% of AGI for various income ranges: 5.1% for AGIs below $25k, 31.5% for AGIs $25k-50k, 90.6% for AGIs $50k-75k, 194.3% for AGIs $75k-100k, 498.8% for AGIs $100k-200k, 3272.2% for AGIs over 200k)
Taxes paid: $6,571 (reported on 9.1% of returns)
23666:
$6,571
State:
$8,284
(% of AGI for various income ranges: 6.1% for AGIs below $25k, 24.2% for AGIs $25k-50k, 94.5% for AGIs $50k-75k, 195.9% for AGIs $75k-100k, 417.7% for AGIs $100k-200k, 1660.0% for AGIs over 200k)
Earned income credit: $2,262 (reported on 19.1% of returns)
Here:
$2,262
State:
$2,214
(% of AGI for various income ranges: 100.1% for AGIs below $25k, 63.0% for AGIs $25k-50k, 0.8% for AGIs $50k-75k)
Percentage of individuals using paid preparers for their 2020 taxes: 91.4%
Here:
91%
State:
92%
(% for various income ranges: 92.1% for AGIs below $25k, 92.6% for AGIs $25k-50k, 90.2% for AGIs $50k-75k, 88.7% for AGIs $75k-100k, 90.0% for AGIs $100k-200k, 90.0% for AGIs over 200k)
Averages for the 2012 tax year for zip code 23666, filed in 2013:
Average Adjusted Gross Income (AGI) in 2012: $44,642 (Individual Income Tax Returns)
Here:
$44,642
State:
$71,192
Salary/wage: $39,915 (reported on 87.2% of returns)
Here:
$39,915
State:
$59,229
(% of AGI for various income ranges: 82.7% for AGIs below $25k, 83.7% for AGIs $25k-50k, 77.7% for AGIs $50k-75k, 77.0% for AGIs $75k-100k, 75.8% for AGIs $100k-200k, 51.9% for AGIs over 200k)
Taxable interest for individuals: $782 (reported on 26.4% of returns)
This zip code:
$782
Virginia:
$1,600
(% of AGI for various income ranges: 0.6% for AGIs below $25k, 0.3% for AGIs $25k-50k, 0.5% for AGIs $50k-75k, 0.4% for AGIs $75k-100k, 0.4% for AGIs $100k-200k, 1.3% for AGIs over 200k)
Ordinary dividends: $2,159 (reported on 12.0% of returns)
Here:
$2,159
State:
$6,959
(% of AGI for various income ranges: 0.6% for AGIs below $25k, 0.4% for AGIs $25k-50k, 0.6% for AGIs $50k-75k, 0.5% for AGIs $75k-100k, 0.6% for AGIs $100k-200k, 1.4% for AGIs over 200k)
Net capital gain/loss in AGI: +$1,955 (reported on 7.2% of returns)
Here:
+$1,955
State:
+$16,672
(% of AGI for various income ranges: 0.2% for AGIs $50k-75k, 0.2% for AGIs $75k-100k, 0.4% for AGIs $100k-200k, 2.8% for AGIs over 200k)
Profit/loss from business: +$4,635 (reported on 11.0% of returns)
Here:
+$4,635
State:
+$14,116
(% of AGI for various income ranges: 3.8% for AGIs below $25k, 0.7% for AGIs $25k-50k, 0.6% for AGIs $50k-75k, 0.6% for AGIs $75k-100k, 1.1% for AGIs $100k-200k, 1.6% for AGIs over 200k)
Taxable individual retirement arrangement distribution: $9,715 (reported on 7.1% of returns)
23666:
$9,715
Virginia:
$16,667
(% of AGI for various income ranges: 1.4% for AGIs below $25k, 1.2% for AGIs $25k-50k, 1.5% for AGIs $50k-75k, 1.8% for AGIs $75k-100k, 1.8% for AGIs $100k-200k, 1.4% for AGIs over 200k)
Total itemized deductions: $19,332 (25% of AGI, reported on 33.6% of returns)
Here:
$19,332
State:
$26,596
Here:
25.5% of AGI
State:
20.1% of AGI
(% of AGI for various income ranges: 7.5% for AGIs below $25k, 12.4% for AGIs $25k-50k, 15.9% for AGIs $50k-75k, 17.3% for AGIs $75k-100k, 17.7% for AGIs $100k-200k, 11.5% for AGIs over 200k)
Charity contributions: $4,232 (reported on 28.1% of returns)
Here:
$4,232
State:
$4,443
(% of AGI for various income ranges: 1.0% for AGIs below $25k, 2.0% for AGIs $25k-50k, 2.8% for AGIs $50k-75k, 3.2% for AGIs $75k-100k, 3.7% for AGIs $100k-200k, 2.6% for AGIs over 200k)
Taxes paid: $5,758 (reported on 33.4% of returns)
23666:
$5,758
State:
$9,951
(% of AGI for various income ranges: 1.3% for AGIs below $25k, 2.8% for AGIs $25k-50k, 4.4% for AGIs $50k-75k, 5.3% for AGIs $75k-100k, 6.2% for AGIs $100k-200k, 5.8% for AGIs over 200k)
Earned income credit: $2,253 (reported on 21.6% of returns)
Here:
$2,253
State:
$2,211
(% of AGI for various income ranges: 7.3% for AGIs below $25k, 1.0% for AGIs $25k-50k)
Percentage of individuals using paid preparers for their 2012 taxes: 35.1%
Here:
35%
State:
46%
(% for various income ranges: 33.2% for AGIs below $25k, 33.2% for AGIs $25k-50k, 37.4% for AGIs $50k-75k, 38.5% for AGIs $75k-100k, 41.1% for AGIs $100k-200k, 60.0% for AGIs over 200k)
Averages for the 2004 tax year for zip code 23666, filed in 2005:
Average Adjusted Gross Income (AGI) in 2004: $38,784 (Individual Income Tax Returns)
Here:
$38,784
State:
$56,704
Salary/wage: $35,562 (reported on 88.5% of returns)
Here:
$35,562
State:
$48,441
(% of AGI for various income ranges: 98.2% for AGIs below $10k, 83.7% for AGIs $10k-25k, 84.7% for AGIs $25k-50k, 81.4% for AGIs $50k-75k, 81.9% for AGIs $75k-100k, 70.9% for AGIs over 100k)
Taxable interest for individuals: $930 (reported on 37.8% of returns)
This zip code:
$930
Virginia:
$1,688
(% of AGI for various income ranges: 2.3% for AGIs below $10k, 1.2% for AGIs $10k-25k, 0.8% for AGIs $25k-50k, 0.9% for AGIs $50k-75k, 0.7% for AGIs $75k-100k, 0.9% for AGIs over 100k)
Taxable dividends: $1,379 (reported on 15.8% of returns)
Here:
$1,379
State:
$4,028
(% of AGI for various income ranges: 1.2% for AGIs below $10k, 0.5% for AGIs $10k-25k, 0.4% for AGIs $25k-50k, 0.6% for AGIs $50k-75k, 0.5% for AGIs $75k-100k, 0.8% for AGIs over 100k)
Net capital gain/loss: +$4,032 (reported on 10.9% of returns)
Here:
+$4,032
State:
+$14,375
(% of AGI for various income ranges: -0.5% for AGIs below $10k, 0.1% for AGIs $10k-25k, 0.2% for AGIs $25k-50k, 0.4% for AGIs $50k-75k, 0.7% for AGIs $75k-100k, 4.9% for AGIs over 100k)
Profit/loss from business: +$6,016 (reported on 9.2% of returns)
Here:
+$6,016
State:
+$13,342
(% of AGI for various income ranges: 2.4% for AGIs below $10k, 2.0% for AGIs $10k-25k, 1.0% for AGIs $25k-50k, 0.8% for AGIs $50k-75k, 1.2% for AGIs $75k-100k, 2.7% for AGIs over 100k)
IRA payment deduction: $2,524 (reported on 2.1% of returns)
23666:
$2,524
Virginia:
$2,943
(% of AGI for various income ranges: 0.1% for AGIs below $10k, 0.1% for AGIs $10k-25k, 0.2% for AGIs $25k-50k, 0.2% for AGIs $50k-75k, 0.1% for AGIs $75k-100k, 0.1% for AGIs over 100k)
Self-employed pension: $10,677 (reported on 0.1% of returns)
Here:
$10,677
Virginia:
$17,430
Total itemized deductions: $16,245 (25% of AGI, reported on 34.5% of returns)
Here:
$16,245
State:
$21,492
Here:
25.1% of AGI
State:
21.0% of AGI
(% of AGI for various income ranges: 7.7% for AGIs below $10k, 7.5% for AGIs $10k-25k, 12.7% for AGIs $25k-50k, 16.3% for AGIs $50k-75k, 18.3% for AGIs $75k-100k, 16.3% for AGIs over 100k)
Charity contributions deductions: $3,649 (6% of AGI, reported on 31.6% of returns)
Here:
$3,649
State:
$3,794
Here:
5.5% of AGI
State:
3.5% of AGI
(% of AGI for various income ranges: 0.7% for AGIs below $10k, 1.2% for AGIs $10k-25k, 2.5% for AGIs $25k-50k, 3.1% for AGIs $50k-75k, 3.9% for AGIs $75k-100k, 4.0% for AGIs over 100k)
Total tax: $4,522 (reported on 74.6% of returns)
23666:
$4,522
State:
$9,537
(% of AGI for various income ranges: 1.9% for AGIs below $10k, 3.6% for AGIs $10k-25k, 6.6% for AGIs $25k-50k, 8.5% for AGIs $50k-75k, 9.9% for AGIs $75k-100k, 15.2% for AGIs over 100k)
Earned income credit: $1,787 (reported on 17.4% of returns)
Here:
$1,787
State:
$1,734
Percentage of individuals using paid preparers for their 2004 taxes: 46.9%
Here:
47%
State:
52%
(% for various income ranges: 39.5% for AGIs below $10k, 51.1% for AGIs $10k-25k, 47.2% for AGIs $25k-50k, 45.8% for AGIs $50k-75k, 45.8% for AGIs $75k-100k, 50.2% for AGIs over 100k)
Likely homosexual households (counted as self-reported same-sex unmarried-partner households)
Lesbian couples: 0.3% of all households
Gay men: 0.1% of all households
Household received Food Stamps/SNAP in the past 12 months: 2,852 Household did not receive Food Stamps/SNAP in the past 12 months: 21,076
Women who had a birth in the past 12 months: 717 (456 now married, 255 unmarried) Women who did not have a birth in the past 12 months: 13,021 (4,790 now married, 8,263 unmarried)
Housing units in zip code 23666 with a mortgage: 8,904 (820 second mortgage, 30 home equity loan, 597 both second mortgage and home equity loan) Houses without a mortgage: 160
Median monthly owner costs for units with a mortgage: $1,587 Median monthly owner costs for units without a mortgage: $556
Residents with income below the poverty level in 2022:
This zip code:
11.4%
Whole state:
10.6%
Residents with income below 50% of the poverty level in 2022:
This zip code:
6.7%
Whole state:
5.2%
Median number of rooms in houses and condos:
Here:
6.5
State:
7.0
Median number of rooms in apartments:
Here:
4.2
State:
4.3
Notable locations in this zip code not listed on our city pages
Notable locations in zip code 23666: Hampton - NASA Steam Plant (A), Bethel Landfill (B), Sinclair Circle (C), Langley Research And Development Park (D), Langley Speedway (E), The Hamptons Golf Course (F), Wythe Creek Industrial Park (G), Hampton Road Center (H), Hampton Roads Center North (I), Wythe Center Industrial Park (J), Wythe Hall (K), Templin Hall (L), Moore Hall (M), Hastings Hall (N), Harrison Hall (O), Griffin Hall (P), Diggs Hall (Q), Hampton Coliseum (R), Hampton Fire and Rescue Station 10 Mercury Central (S), Hampton Fire and Rescue Station 9 Briarfield (T). Display/hide their locations on the map
Shopping Centers: Todd Center Shopping Center (1), Mercury Plaza Mall Shopping Center (2), Hampton Plaza Shopping Center (3), Greenwood Shopping Center (4), Coliseum Mall Shopping Center (5), Coliseum Crossing Shopping Center (6), Riverdale Plaza Shopping Center (7), Hampton Woods Plaza Shopping Center (8), Pavilion Square Shopping Center (9). Display/hide their locations on the map
Churches in zip code 23666 include: Wesley United Methodist Church (A), Berachah Church (B), Pillars of the Word Ministries (C), Spirit and Truth Church (D), Victory Life Church (E), Warwick Assembly of God Church (F), Cornerstone Assembly of God Church (G), Faith Outreach Church (H), House of God Worship Center (I). Display/hide their locations on the map
Cemeteries: Carver Memorial Park (1), Ebenezer Cemetery (2), Parklawn Memorial Cemetery (3), Mount Olive Cemetery (4). Display/hide their locations on the map
4,665 married couples with children.
4,082 single-parent households (860 men, 3,222 women).
90.7% of residents of 23666 zip code speak English at home.
4.4% of residents speak Spanish at home (65% very well, 14% well, 18% not well, 4% not at all).
1.3% of residents speak other Indo-European language at home (80% very well, 14% well, 6% not well).
1.8% of residents speak Asian or Pacific Island language at home (46% very well, 45% well, 9% not well).
1.5% of residents speak other language at home (78% very well, 13% well, 10% not at all).
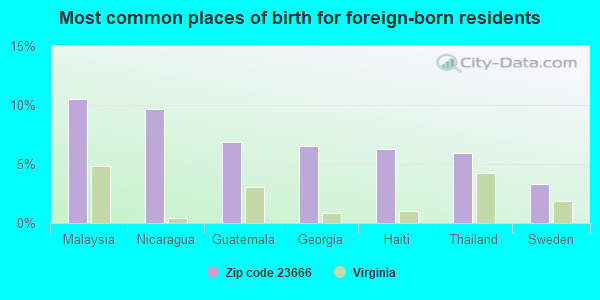
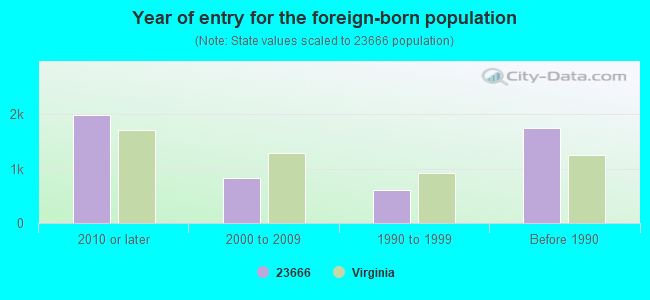
Foreign born population: 3,814 (7.1%) (63.7% of them are naturalized citizens)
Major facilities with environmental interests located in this zip code:
CATALINA CYLINDERS (2400 ALUMINUM AVE. in HAMPTON, VA)
AIR MINOR (AIRS/AFS) STATE MASTER (Virginia pollutants databases) - CEDS-61317, AIR PROGRAM CRITERIA AND HAZARDOUS AIR POLLUTANT INVENTORY (Inventory of air pollution sources) Small Quantity Generators, between 100 kg and 1000 kg of hazardous waste/month (Resource Conservation and Recovery Act (tracking hazardous waste)) TRI REPORTER (Tracking of toxic chemicals releasing facilities) Business SIC classification: ALUMINUM EXTRUDED PRODUCTS Business NAICS classification: ALUMINUM EXTRUDED PRODUCT MANUFACTURING. Alternative names: CATALINA CYLINDERS-CLIFF IMPACT DIV., CATALINA CYLINDERS CLIFF IMPACTS
CLOTHING CARE INCORPORATED (1100 W MERCURY BOULEVARD in HAMPTON, VA)
AIR MINOR (AIRS/AFS) STATE MASTER (Virginia pollutants databases) - CEDS-61242, AIR PROGRAM Small Quantity Generators, between 100 kg and 1000 kg of hazardous waste/month (Resource Conservation and Recovery Act (tracking hazardous waste)) - notification Business SIC classification: DRYCLEANING PLANTS, EXCEPT RUG CLEANING Business NAICS classification: ALL OTHER MISCELLANEOUS STORE RETAILERS (EXCEPT TOBACCO STORES).; DRYCLEANING AND LAUNDRY SERVICES (EXCEPT COIN-OPERATED). Organizations: OPERNAME (CONTACT/OPERATOR)
ADVEX CORPORATION (121 FLOYD THOMPSON DRIVE in HAMPTON, VA)
AIR SYNTHETIC MINOR (AIRS/AFS) STATE MASTER (Virginia pollutants databases) - CEDS-61326, AIR PROGRAM Small Quantity Generators, between 100 kg and 1000 kg of hazardous waste/month (Resource Conservation and Recovery Act (tracking hazardous waste)) - notification Business SIC classification: FABRICATED PLATE WORK (BOILER SHOPS) Business NAICS classification: MACHINE SHOPS.
CHIN S CLEANERS (3427 NORTH ARMISTEAD AVENUE in HAMPTON, VA)
AIR MINOR (AIRS/AFS) STATE MASTER (Virginia pollutants databases) - CEDS-61215, AIR PROGRAM Business SIC classification: DRYCLEANING PLANTS, EXCEPT RUG CLEANING Business NAICS classification: DRYCLEANING AND LAUNDRY SERVICES (EXCEPT COIN-OPERATED). Alternative names: CHINS CLEANERS
COLISEUM MALL PROPERTIES (1800 WEST MERCURY BOULEVARD in HAMPTON, VA)
AIR SYNTHETIC MINOR (AIRS/AFS) STATE MASTER (Virginia pollutants databases) - CEDS-60458, AIR PROGRAM Business SIC classification: OPERATORS OF NONRESIDENTIAL BUILDINGS Business NAICS classification: LESSORS OF NONRESIDENTIAL BUILDINGS (EXCEPT MINIWAREHOUSES).
ABERDEEN ELEM. (1424 ABERDEEN RD in HAMPTON, VA)
(National Center for Education Statistics) - STATE ID-1120160 Organizations: HAMPTON CITY PUBLIC SCHOOLS (SCHOOL DISTRICT)
ALFRED S. FORREST ELEM. (1406 TODDS LN in HAMPTON, VA)
(National Center for Education Statistics) - STATE ID-1120260 Organizations: HAMPTON CITY PUBLIC SCHOOLS (SCHOOL DISTRICT)
CESAR TARRANT ELEM. (1589 WINGFIELD DR in HAMPTON, VA)
(National Center for Education Statistics) - STATE ID-1120510 Organizations: HAMPTON CITY PUBLIC SCHOOLS (SCHOOL DISTRICT)
CHRISTOPHER C KRAFT ELEM. (600 CONCORD DR in HAMPTON, VA)
(National Center for Education Statistics) - STATE ID-1120420 Organizations: HAMPTON CITY PUBLIC SCHOOLS (SCHOOL DISTRICT)
CHESAPEAKE & POTOMAC TELEPHONE CO (1606 ABERDEEN RD in HAMPTON, VA)
(Resource Conservation and Recovery Act (tracking hazardous waste)) Organizations: OPERNAME (CONTACT/OPERATOR)
, CHESAPEAKE & POTOMAC TELEPHONE COMPANY (CONTACT/OWNER)
CHESAPEAKE & POTOMAC TELEPHONE CO (11 WYTHE CREEK RD in HAMPTON, VA)
(Resource Conservation and Recovery Act (tracking hazardous waste)) Organizations: OPERNAME (CONTACT/OPERATOR)
, CHESAPEAKE & POTOMAC TELEPHONE COMPANY (CONTACT/OWNER)
CHESAPEAKE & POTOMAC TELEPHONE CO (NASA LANGLEY BASE in HAMPTON, VA)
Small Quantity Generators, between 100 kg and 1000 kg of hazardous waste/month (Resource Conservation and Recovery Act (tracking hazardous waste)) - notification Organizations: OPERNAME (CONTACT/OPERATOR)
, 7 ELEVEN INC (CONTACT/OWNER)
Housing units lacking complete plumbing facilities: 0.4% Housing units lacking complete kitchen facilities: 0.4%
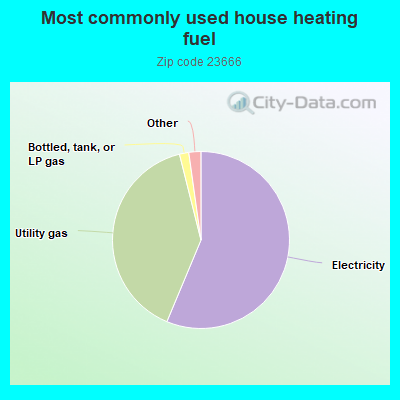
56.3%Electricity
39.8%Utility gas
1.7%Bottled, tank, or LP gas
0.8%Fuel oil, kerosene, etc.
0.5%No fuel used
Population in 1990: 44,985. Population change in the 1990s: +3,695 (+8.2%).
Place of birth for U.S.-born residents:
This state: 26,300
Northeast: 6,398
Midwest: 2,896
South: 10,238
West: 3,076
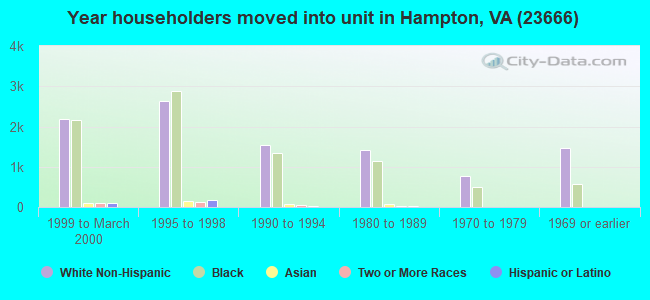
50% of the 23666 zip code residents lived in the same house 5 years ago. Out of people who lived in different houses, 39% lived in this county. Out of people who lived in different counties, 50% lived in Virginia.
86% of the 23666 zip code residents lived in the same house 1 year ago. Out of people who lived in different houses, 28% moved from this county. Out of people who lived in different houses, 37% moved from different county within same state. Out of people who lived in different houses, 23% moved from different state. Out of people who lived in different houses, 12% moved from abroad.
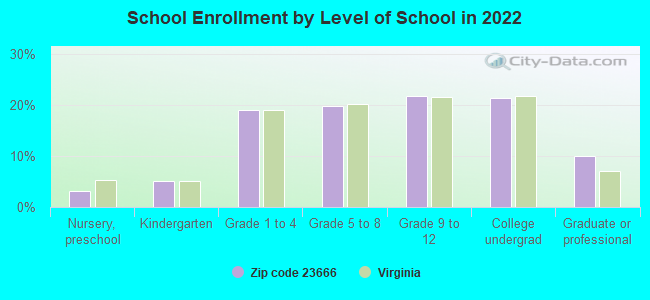
Private vs. public school enrollment:
Students in private schools in grades 1 to 8 (elementary and middle school): 266
Here:
5.8%
Virginia:
13.2%
Students in private schools in grades 9 to 12 (high school): 97
Here:
3.7%
Virginia:
10.2%
Students in private undergraduate colleges: 610
Here:
24.0%
Virginia:
18.7%
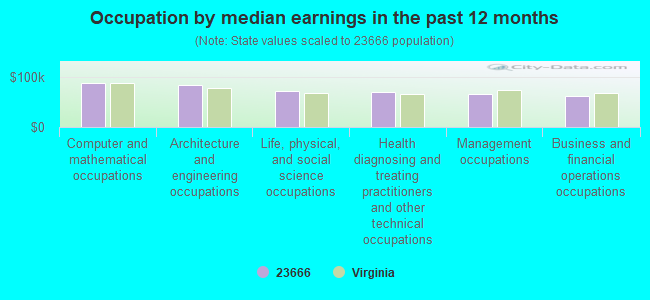
Occupation by median earnings in the past 12 months ($)
88,155Computer and mathematical occupations
84,969Architecture and engineering occupations
73,128Life, physical, and social science occupations
69,772Health diagnosing and treating practitioners and other technical occupations
67,096Management occupations
62,016Business and financial operations occupations
Companies with biggest federal contracts located in this zip code (HAMPTON, VA):
SCIENCE AND TECHNOLOGY CORPORA (10 BASIL SAWYER DR; small business) : $67,624,401 in 1121 contractsfrom 1999 to 2006
Contracts for Data Collection Services, ADP Facility Operation and Maintenance Services, Other Management Support Services, Engineering and Technical Services, and moreby Army, National Oceanic and Atmospheric Administration/Under Secretary for Oceans and Atmosphere, NASA, U.S. Army Corps of Engineers - civil program financing only, and others Signed by year:2000: $5,187,715; 2001: $5,001,671; 2002: $4,603,001; 2003: $4,497,992; 2004: $8,865,290; 2005: $18,038,788; 2006: $20,896,526.
Biggest contracts:
$9,416,702 with Army for Data Collection Services. Taking place in MD. Signed on 2006-06-20. Effective on 2006-05-01. Completion date: 2007-04-30.
$3,238,213, same as above.Signed on 2006-01-23. Completion date: 2006-04-30.
$1,039,662, same as above.Signed on 2005-11-17. Completion date: 2005-12-31.
$980,345, same as above.Signed on 2005-08-25. Completion date: 2005-09-30.
NATIONAL CONSORTUM AVIATN MOBL (3130 N ARMISTEAD AVE.) 8 employees, $10000000 revenue. Nonprofit Organization: $41,570,049 in 15 contractsfrom 2002 to 2006
Contracts for Aeronautics and Space Technology -- Basic Research (R&D) by NASA Signed by year:2000: $0; 2001: $0; 2002: $4,715,400; 2003: $14,947,350; 2004: $19,052,808; 2005: $2,854,491; 2006: $0.
Biggest contracts:
$14,947,350 with NASA for Aeronautics and Space Technology -- Basic Research (R&D). Signed on 2003-09-30. Completion date: 2005-02-20.
$13,702,808, same as above.Signed on 2004-09-30. Completion date: 2005-02-20.
$5,350,000, same as above.Signed on 2004-12-07. Completion date: 2004-10-31.
$3,741,400, same as above.Signed on 2002-09-30. Completion date: 2005-02-20.
SCIENCE APPLICATIONS INTERNATI (22 ENTERPRISE PKWY, SUITE; small business) : $40,361,307 in 204 contractsfrom 2002 to 2006
Contracts for Other Professional Services, Program Management/Support Services, Training/Curriculum Development, Other Administrative Support Services, and moreby Army, Air Force, Minerals Management Service Signed by year:2000: $0; 2001: $0; 2002: $4,469,797; 2003: $5,004,816; 2004: $8,512,397; 2005: $14,917,821; 2006: $7,456,476.
Biggest contracts:
$2,896,667 with Army for Other Professional Services. Taking place in CA. Signed on 2006-04-14. Completion date: 2007-04-30.
$2,100,000 with Army for Other Professional Services. Taking place in WA. Signed on 2005-06-10. Completion date: 2005-10-31.
$1,600,536 with Army for Other Professional Services. Taking place in CA. Signed on 2006-04-14. Completion date: 2007-04-30.
$1,197,071 with Air Force for Program Management/Support Services. Signed on 2005-10-01. Completion date: 2006-09-30.
MANOJ K SHAH, INC (20 BASIL SAWYER DRIVE; small business) : $11,032,438 in 200 contractsfrom 1999 to 2005
Contracts for Maintenance, Repair or Alteration of Real Property -- Other Educational Buildings, Maintenance, Repair or Alteration of Real Property -- Office Buildings, Maintenance, Repair or Alteration of Real Property -- Other Non-Building Facilities, Maintenance, Repair or Alteration of Real Property -- Other Administrative Facilities and Service Buildings, and moreby NASA, Navy, U.S. Army Corps of Engineers - civil program financing only, Army, and others Signed by year:2000: $3,222,618; 2001: $2,622,241; 2002: $3,875,358; 2003: $183,712; 2004: $32,350; 2005: $0; 2006: $0.
Biggest contracts:
$1,397,000 with NASA for Maintenance, Repair or Alteration of Real Property -- Other Educational Buildings. Signed on 2002-03-15. Completion date: 2003-04-15.
$1,350,069 with Navy for Maintenance, Repair or Alteration of Real Property -- Office Buildings. Signed on 2000-09-30. Completion date: 2001-08-29.
$1,262,969 with Navy for Maintenance, Repair or Alteration of Real Property -- Other Non-Building Facilities. Signed on 2001-07-23. Completion date: 2002-04-28.
$1,138,342 with Navy for Maintenance, Repair or Alteration of Real Property -- Office Buildings. Signed on 2002-06-28. Completion date: 2020-06-20.
GENERAL DYNAMICS NETWORK SYSTE (2101 EXECUTIVE DR) : $10,060,472 in 38 contractsfrom 1999 to 2001
Contracts for Communications Services by Department of Defense Signed by year:2000: $6,105,633; 2001: $3,738,957; 2002: $0; 2003: $0; 2004: $0; 2005: $0; 2006: $0.
Biggest contracts:
$1,159,162 with Department of Defense for Communications Services. Signed on 2000-02-29. Completion date: 2000-08-31.
$1,159,162, same as above.Signed on 2000-09-01. Completion date: 2001-02-28.
$926,850, same as above.Signed on 2001-03-29. Completion date: 2001-09-30.
$823,898, same as above.Signed on 2001-03-29. Completion date: 2001-09-30.
SOUTHEASTERN ROOFING INC (33 BROGDEN LN; small business) : $9,694,000 in 24 contractsfrom 2003 to 2004
Contracts for Maintenance, Repair or Alteration of Real Property -- Miscellaneous Buildings by Air Force Signed by year:2000: $0; 2001: $0; 2002: $0; 2003: $611,021; 2004: $9,082,979; 2005: $0; 2006: $0.
Biggest contracts:
$1,458,782 with Air Force for Maintenance, Repair or Alteration of Real Property -- Miscellaneous Buildings. Signed on 2004-04-01. Completion date: 2004-09-17.
$1,373,562, same as above.Signed on 2004-04-05. Completion date: 2004-09-10.
$1,190,597, same as above.Signed on 2004-03-29. Completion date: 2004-09-02.
$1,184,168, same as above.Signed on 2004-03-19. Completion date: 2004-06-04.
ADVEX CORPORATION (121 FLOYD THOMPSON DRIVE; small business) 100 employees, $0 revenue. : $8,640,550 in 134 contractsfrom 1999 to 2006
Contracts for Non-nuclear Ship Repair (East) Ship repair (including overhauls and conversions) performed on non-nuclear propelled and nonpropelled ships east of the 108th meridian, Maintenance, Repair and Rebuilding of Equipment -- Ships, Small Craft, Pontoons, and Floating Docks, Miscellaneous Items, Defense Ships -- Operational Systems Development (R&D), and moreby Navy, National Oceanic and Atmospheric Administration/Under Secretary for Oceans and Atmosphere, NASA, Army, and others Signed by year:2000: $2,227,777; 2001: $1,974,946; 2002: $829,268; 2003: $314,727; 2004: $2,489,247; 2005: $253,529; 2006: $216,229.
Biggest contracts:
$1,334,420 with Navy for Non-nuclear Ship Repair (East) Ship repair (including overhauls and conversions) performed on non-nuclear propelled and nonpropelled ships east of the 108th meridian. Signed on 2004-05-28. Completion date: 2004-08-18.
$465,862 with National Oceanic and Atmospheric Administration/Under Secretary for Oceans and Atmosphere for Maintenance, Repair and Rebuilding of Equipment -- Ships, Small Craft, Pontoons, and Floating Docks. Signed on 2004-12-14. Completion date: 2005-03-03.
$417,000 with NASA for Miscellaneous Items. Signed on 2001-04-15. Completion date: 2001-06-15.
$287,000, same as above.Signed on 2000-06-15. Completion date: 2001-06-15.
APPLIED EM INC (24 RESEARCH DRIVE; small business) : $7,527,528 in 41 contractsfrom 1999 to 2006
Contracts for Other Defense -- Basic Research (R&D), Defense Electronics and Communication Equipment -- Applied Research and Exploratory Development (R&D), Defense Electronics and Communication Equipment -- Operational Systems Development (R&D), Defense Electronics and Communication Equipment -- Advanced Development (R&D), and moreby Air Force, Navy, Army, Department of Defense, and others Signed by year:2000: $634,291; 2001: $426,402; 2002: $449,938; 2003: $1,883,376; 2004: $1,514,714; 2005: $1,860,908; 2006: $687,939.
Biggest contracts:
$749,660 with Air Force for Other Defense -- Basic Research (R&D). Signed on 2005-09-12. Completion date: 2007-11-30.
$603,631, same as above.Signed on 2004-08-31. Completion date: 2006-11-30.
$500,000 with Navy for Defense Electronics and Communication Equipment -- Applied Research and Exploratory Development (R&D). Signed on 2005-09-30. Completion date: 2007-09-30.
$499,957 with Navy for Defense Electronics and Communication Equipment -- Operational Systems Development (R&D). Signed on 2006-03-14. Completion date: 2008-10-15.
TOP PAINTING INC (5 SHUTTLE CT; small business) : $4,589,726 in 68 contractsfrom 1999 to 2006
Contracts for Maintenance, Repair or Alteration of Real Property -- Other Administrative Facilities and Service Buildings, Maintenance, Repair or Alteration of Real Property -- Miscellaneous Buildings, Maintenance, Repair or Alteration of Real Property -- Family Housing Facilities, Construction of Structures and Facilities -- Other Administrative Facilities and Service Buildings, and moreby Navy, Army, National Park Service, U.S. Coast Guard, and others Signed by year:2000: $771,029; 2001: $505,162; 2002: $1,232,176; 2003: $500,954; 2004: $7,807; 2005: $1,358,167; 2006: $114,011.
Biggest contracts:
$747,650 with Navy for Maintenance, Repair or Alteration of Real Property -- Other Administrative Facilities and Service Buildings. Taking place in NC. Signed on 2002-09-30. Completion date: 2004-03-23.
$544,225, same as above.Signed on 2000-09-27. Completion date: 2001-08-08.
$488,065, same as above.Signed on 2002-09-30. Completion date: 2003-09-30.
$344,460, same as above.Signed on 2001-09-25. Completion date: 2002-09-25.
E&E ENTERPRISES GLOBAL, INC (2017 CUNNINGHAM DR , SUITE; small business) : $4,523,938 in 50 contractsfrom 2003 to 2006
Contracts for ADP Facility Operation and Maintenance Services, ADP Software, ADP Telecommunications and Transmission Services, Maintenance, Repair and Rebuilding of Equipment -- Communication, Detection, and Coherent Radiation Equipment, and moreby Department of Defense, Federal Technology Service, Transportation Security Administration, Federal Emergency Management Agency, and others Signed by year:2000: $0; 2001: $0; 2002: $0; 2003: $1,682,558; 2004: $109,639; 2005: $621,528; 2006: $2,110,213.
Biggest contracts:
$1,668,164 with Department of Defense for ADP Facility Operation and Maintenance Services. Signed on 2003-09-30. Completion date: 2003-10-31.
$1,132,463 with Federal Technology Service for ADP Software. Taking place in KY. Signed on 2006-05-09. Completion date: 2006-05-09.
$686,000 with Transportation Security Administration for ADP Telecommunications and Transmission Services. Signed on 2006-01-27. Completion date: 2007-01-26.
$394,128 with Department of Defense for Maintenance, Repair and Rebuilding of Equipment -- Communication, Detection, and Coherent Radiation Equipment. Signed on 2004-12-28. Completion date: 2005-12-27.
Top industries in this zip code by the number of employees in 2005:
Administrative and Support and Waste Management and Remediation Services: Telemarketing Bureaus (over 1000 employees: 1 establishment, 500-999 employees: 1 establishment)
Health Care and Social Assistance: General Medical and Surgical Hospitals (over 1000: 1)
Professional, Scientific, and Technical Services: Research and Development in the Physical, Engineering, and Life Sciences (250-499: 1, 100-249: 3, 50-99: 6, 20-49: 3, 10-19: 2, 5-9: 4, 1-4: 2)
2002 - 2018 National Fire Incident Reporting System (NFIRS) incidents
Based on the data from the years 2002 - 2018 the average number of fire incidents per year is 145. The highest number of reported fires - 242 took place in 2011, and the least - 23 in 2007. The data has a decreasing trend.
When looking into fire subcategories, the most reports belonged to: Outside Fires (38.2%), and Structure Fires (33.5%).
Fire incident types reported to NFIRS in Zip Code 23666


 Nearest zip codes: 23665, 23605, 23661, 23669, 23601, 23693.


 Based on the data from the years 2002 - 2018 the average number of fire incidents per year is 145. The highest number of reported fires - 242 took place in 2011, and the least - 23 in 2007. The data has a decreasing trend.
 When looking into fire subcategories, the most reports belonged to: Outside Fires (38.2%), and Structure Fires (33.5%).