Estimated zip code population in 2022: 1,521 Zip code population in 2010: 1,879 Zip code population in 2000: 2,136
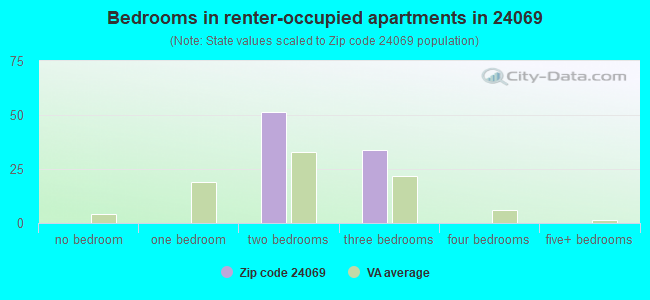
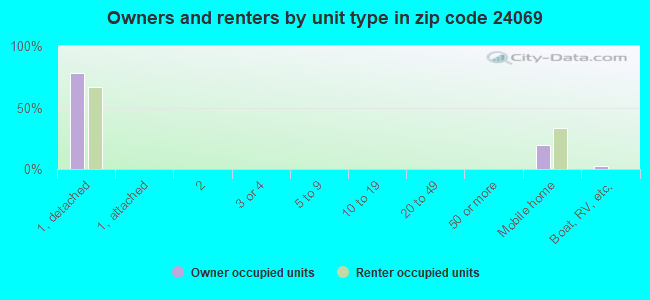
Houses and condos: 933 Renter-occupied apartments: 86
% of renters here:
13%
State:
33%
March 2022 cost of living index in zip code 24069: 84.7 (less than average, U.S. average is 100)
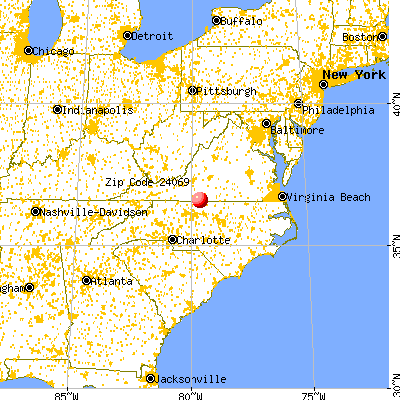
Land area: 33.1 sq. mi. Water area: 0.3 sq. mi.
Population density: 46 people per square mile
(very low).
OSM Map
General Map
Google Map
MSN Map
OSM Map
General Map
Google Map
MSN Map
OSM Map
General Map
Google Map
MSN Map
OSM Map
General Map
Google Map
MSN Map
Please wait while loading the map...
Real estate property taxes paid for housing units in 2022:
This zip code:
0.6% ($826)
Virginia:
0.7% ($2,617)
Median real estate property taxes paid for housing units with mortgages in 2022: $1,096 Median real estate property taxes paid for housing units with no mortgage in 2022: $527
Business Search- 14 Million verified businesses
Males: 660
(43.4%)
Females: 860
(56.6%)
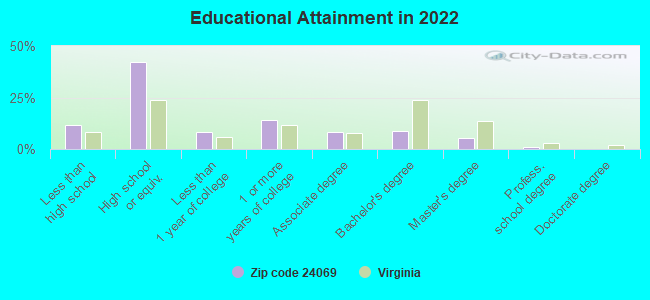
For population 25 years and over in 24069:
High school or higher: 86.5%
Bachelor's degree or higher: 14.7%
Graduate or professional degree: 6.0%
Unemployed: 14.1%
Mean travel time to work (commute): 26.4 minutes
For population 15 years and over in 24069:
Never married: 23.0%
Now married: 47.1%
Separated: 4.4%
Widowed: 13.9%
Divorced: 11.6%
Zip code 24069 compared to state average:
Median household income below state average.
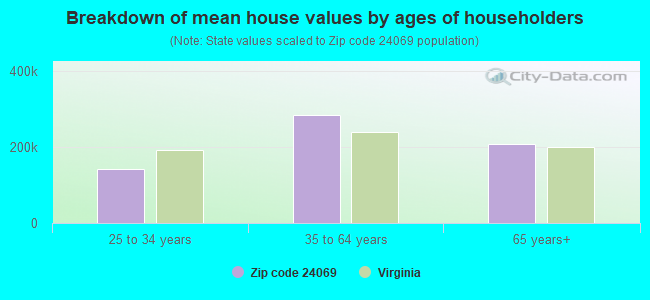
Median house value significantly below state average.
Unemployed percentage significantly above state average.
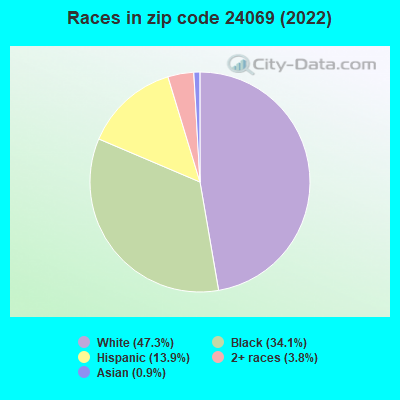
Black race population percentage above state average.
Median age significantly above state average.
Foreign-born population percentage significantly below state average.
Renting percentage significantly below state average.
Length of stay since moving in significantly above state average.
Number of college students significantly below state average.
Percentage of population with a bachelor's degree or higher significantly below state average.
Averages for the 2020 tax year for zip code 24069, filed in 2021:
Average Adjusted Gross Income (AGI) in 2020: $40,554 (Individual Income Tax Returns)
Here:
$40,554
State:
$86,446
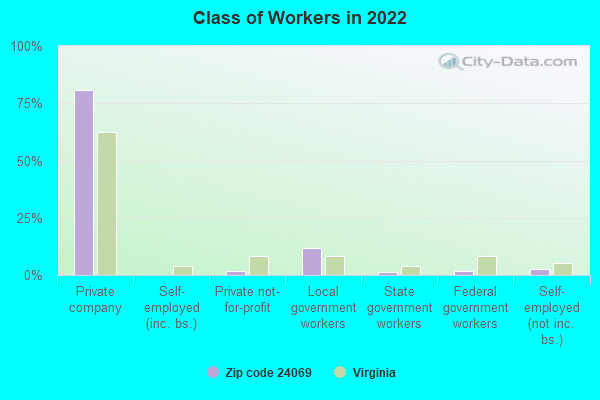
Salary/wage: $34,921 (reported on 88.0% of returns)
Here:
$34,921
State:
$71,185
(% of AGI for various income ranges: 1134.4% for AGIs below $25k, 3733.2% for AGIs $25k-50k, 7082.5% for AGIs $50k-75k, 7922.0% for AGIs $75k-100k, 14272.5% for AGIs $100k-200k)
Taxable interest for individuals: $433 (reported on 18.1% of returns)
This zip code:
$433
Virginia:
$1,805
(% of AGI for various income ranges: 11.5% for AGIs below $25k, 2.6% for AGIs $25k-50k, 8.8% for AGIs $50k-75k, 10.0% for AGIs $75k-100k, 42.5% for AGIs $100k-200k)
Ordinary dividends: $1,067 (reported on 7.2% of returns)
Here:
$1,067
State:
$8,327
(% of AGI for various income ranges: 22.6% for AGIs $25k-50k, 42.0% for AGIs $75k-100k)
Net capital gain/loss in AGI: +$6,350 (reported on 4.8% of returns)
Here:
+$6,350
State:
+$24,644
(% of AGI for various income ranges: 317.5% for AGIs $50k-75k)
Profit/loss from business: +$2,700 (reported on 12.0% of returns)
Here:
+$2,700
State:
+$12,836
(% of AGI for various income ranges: 55.2% for AGIs below $25k, 151.2% for AGIs $50k-75k)
Taxable individual retirement arrangement distribution: $7,540 (reported on 6.0% of returns)
24069:
$7,540
Virginia:
$21,535
(% of AGI for various income ranges: 32.6% for AGIs below $25k, 152.1% for AGIs $25k-50k)
Total itemized deductions: $36,000 (reported on 2.4% of returns)
Here:
$36,000
State:
$33,287
(% of AGI for various income ranges: 378.9% for AGIs $25k-50k)
Charity contributions: $11,200 (reported on 2.4% of returns)
Here:
$11,200
State:
$10,381
(% of AGI for various income ranges: 117.9% for AGIs $25k-50k)
Taxes paid: $6,050 (reported on 2.4% of returns)
24069:
$6,050
State:
$8,284
(% of AGI for various income ranges: 63.7% for AGIs $25k-50k)
Earned income credit: $2,395 (reported on 22.9% of returns)
Here:
$2,395
State:
$2,214
(% of AGI for various income ranges: 116.3% for AGIs below $25k, 74.2% for AGIs $25k-50k)
Percentage of individuals using paid preparers for their 2020 taxes: 91.6%
Here:
92%
State:
92%
(% for various income ranges: 94.3% for AGIs below $25k, 87.5% for AGIs $25k-50k, 90.9% for AGIs $50k-75k, 85.7% for AGIs $75k-100k, 100.0% for AGIs $100k-200k)
Averages for the 2012 tax year for zip code 24069, filed in 2013:
Average Adjusted Gross Income (AGI) in 2012: $34,578 (Individual Income Tax Returns)
Here:
$34,578
State:
$71,192
Salary/wage: $31,786 (reported on 86.2% of returns)
Here:
$31,786
State:
$59,229
(% of AGI for various income ranges: 80.0% for AGIs below $25k, 84.3% for AGIs $25k-50k, 80.6% for AGIs $50k-75k, 84.0% for AGIs $75k-100k, 63.5% for AGIs $100k-200k)
Taxable interest for individuals: $541 (reported on 21.2% of returns)
This zip code:
$541
Virginia:
$1,600
(% of AGI for various income ranges: 0.7% for AGIs below $25k, 0.2% for AGIs $25k-50k, 0.1% for AGIs $50k-75k, 0.6% for AGIs $100k-200k)
Ordinary dividends: $900 (reported on 8.8% of returns)
Here:
$900
State:
$6,959
Profit/loss from business: +$4,111 (reported on 11.2% of returns)
Here:
+$4,111
State:
+$14,116
Taxable individual retirement arrangement distribution: $6,560 (reported on 6.2% of returns)
24069:
$6,560
Virginia:
$16,667
Total itemized deductions: $18,550 (24% of AGI, reported on 17.5% of returns)
Here:
$18,550
State:
$26,596
Here:
24.1% of AGI
State:
20.1% of AGI
(% of AGI for various income ranges: 7.5% for AGIs $25k-50k, 12.3% for AGIs $50k-75k, 12.1% for AGIs $75k-100k, 16.9% for AGIs $100k-200k)
Charity contributions: $5,133 (reported on 15.0% of returns)
Here:
$5,133
State:
$4,443
(% of AGI for various income ranges: 1.5% for AGIs $25k-50k, 2.8% for AGIs $50k-75k, 2.9% for AGIs $75k-100k, 4.6% for AGIs $100k-200k)
Taxes paid: $4,700 (reported on 17.5% of returns)
24069:
$4,700
State:
$9,951
(% of AGI for various income ranges: 1.4% for AGIs $25k-50k, 2.4% for AGIs $50k-75k, 3.7% for AGIs $75k-100k, 5.4% for AGIs $100k-200k)
Earned income credit: $2,318 (reported on 27.5% of returns)
Here:
$2,318
State:
$2,211
(% of AGI for various income ranges: 8.0% for AGIs below $25k, 1.2% for AGIs $25k-50k)
Percentage of individuals using paid preparers for their 2012 taxes: 61.3%
Here:
61%
State:
46%
(% for various income ranges: 55.0% for AGIs below $25k, 61.9% for AGIs $25k-50k, 70.0% for AGIs $50k-75k, 66.7% for AGIs $75k-100k, 100.0% for AGIs $100k-200k)
Averages for the 2004 tax year for zip code 24069, filed in 2005:
Average Adjusted Gross Income (AGI) in 2004: $30,941 (Individual Income Tax Returns)
Here:
$30,941
State:
$56,704
Salary/wage: $28,571 (reported on 88.5% of returns)
Here:
$28,571
State:
$48,441
(% of AGI for various income ranges: 100.1% for AGIs below $10k, 84.1% for AGIs $10k-25k, 86.1% for AGIs $25k-50k, 88.5% for AGIs $50k-75k, 81.4% for AGIs $75k-100k, 51.8% for AGIs over 100k)
Taxable interest for individuals: $452 (reported on 29.6% of returns)
This zip code:
$452
Virginia:
$1,688
(% of AGI for various income ranges: 1.3% for AGIs below $10k, 0.8% for AGIs $10k-25k, 0.4% for AGIs $25k-50k, 0.1% for AGIs $50k-75k, 0.5% for AGIs $75k-100k, 0.1% for AGIs over 100k)
Taxable dividends: $682 (reported on 10.4% of returns)
Here:
$682
State:
$4,028
(% of AGI for various income ranges: 0.4% for AGIs below $10k, 0.1% for AGIs $10k-25k, 0.2% for AGIs $25k-50k, 0.2% for AGIs $50k-75k, 0.6% for AGIs $75k-100k)
Net capital gain/loss: +$49 (reported on 5.0% of returns)
Here:
+$49
State:
+$14,375
Profit/loss from business: +$2,809 (reported on 10.9% of returns)
Here:
+$2,809
State:
+$13,342
(% of AGI for various income ranges: 10.4% for AGIs below $10k, 2.6% for AGIs $10k-25k, 0.8% for AGIs $25k-50k, -0.2% for AGIs $50k-75k)
Total itemized deductions: $14,347 (24% of AGI, reported on 21.3% of returns)
Here:
$14,347
State:
$21,492
Here:
24.1% of AGI
State:
21.0% of AGI
(% of AGI for various income ranges: 5.1% for AGIs $10k-25k, 10.0% for AGIs $25k-50k, 11.4% for AGIs $50k-75k, 15.4% for AGIs $75k-100k, 10.5% for AGIs over 100k)
Charity contributions deductions: $4,273 (7% of AGI, reported on 18.4% of returns)
Here:
$4,273
State:
$3,794
Here:
6.9% of AGI
State:
3.5% of AGI
(% of AGI for various income ranges: 1.0% for AGIs $10k-25k, 2.3% for AGIs $25k-50k, 3.2% for AGIs $50k-75k, 3.8% for AGIs $75k-100k, 3.5% for AGIs over 100k)
Total tax: $3,553 (reported on 70.0% of returns)
24069:
$3,553
State:
$9,537
(% of AGI for various income ranges: 2.6% for AGIs below $10k, 3.3% for AGIs $10k-25k, 6.2% for AGIs $25k-50k, 7.9% for AGIs $50k-75k, 10.0% for AGIs $75k-100k, 19.0% for AGIs over 100k)
Earned income credit: $1,667 (reported on 26.2% of returns)
Here:
$1,667
State:
$1,734
Percentage of individuals using paid preparers for their 2004 taxes: 71.9%
Here:
72%
State:
52%
(% for various income ranges: 64.7% for AGIs below $10k, 74.6% for AGIs $10k-25k, 73.0% for AGIs $25k-50k, 62.6% for AGIs $50k-75k, 87.5% for AGIs $75k-100k, 90.9% for AGIs over 100k)
Household received Food Stamps/SNAP in the past 12 months: 160 Household did not receive Food Stamps/SNAP in the past 12 months: 525
Women who did not have a birth in the past 12 months: 297 (164 now married, 131 unmarried)
Housing units in zip code 24069 with a mortgage: 291 (5 second mortgage) Median monthly owner costs for units with a mortgage: $1,017 Median monthly owner costs for units without a mortgage: $279
Residents with income below the poverty level in 2022:
This zip code:
19.9%
Whole state:
10.6%
Residents with income below 50% of the poverty level in 2022:
This zip code:
15.0%
Whole state:
5.2%
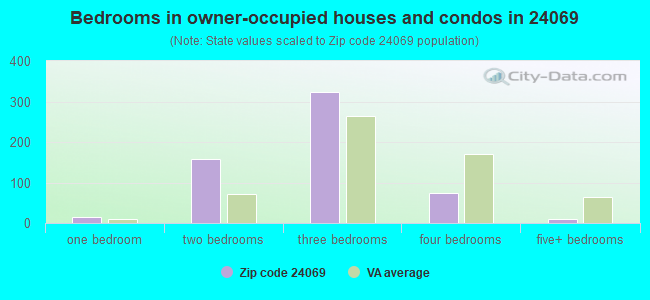
Median number of rooms in houses and condos:
Here:
5.6
State:
7.0
Median number of rooms in apartments:
Here:
4.2
State:
4.3
Notable locations in this zip code not listed on our city pages
Size of family households: 170 2-persons, 140 3-persons, 59 4-persons, 30 5-persons
Size of nonfamily households: 254 1-person, 14 2-persons
171 married couples with children.
49 single-parent households (49 women).
88.7% of residents of 24069 zip code speak English at home.
9.3% of residents speak Spanish at home (32% very well, 68% not well).
0.9% of residents speak other Indo-European language at home (100% well).
0.9% of residents speak Asian or Pacific Island language at home (100% very well).
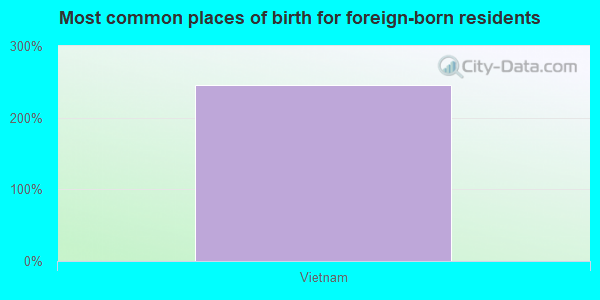
Foreign born population: 12 (0.8%) (0.0% of them are naturalized citizens)
:
0.8%
Whole state:
12.7%
246%Vietnam
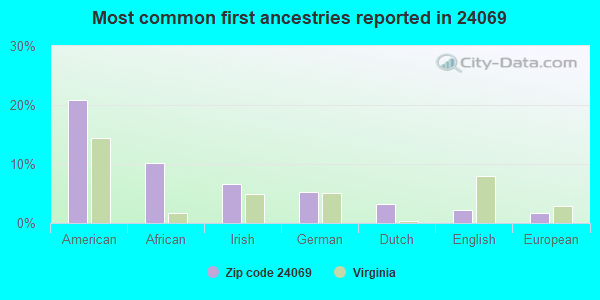
21%American
10%African
7%Irish
5%German
3%Dutch
2%English
2%European
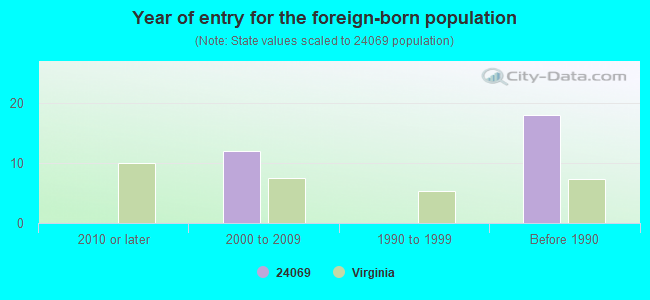
Year of entry for the foreign-born population
02010 or later
122000 to 2009
01990 to 1999
18Before 1990
Housing units lacking complete plumbing facilities: 12.4% Housing units lacking complete kitchen facilities: 18.4%
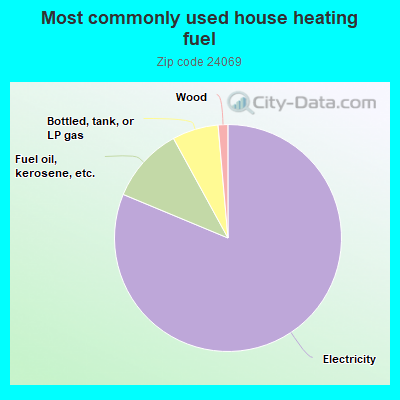
81.6%Electricity
10.8%Fuel oil, kerosene, etc.
6.6%Bottled, tank, or LP gas
1.4%Wood
Population in 1990: 1,435. Population change in the 1990s: +701 (+48.9%).
Place of birth for U.S.-born residents:
This state: 1,065
Northeast: 177
South: 237
66% of the 24069 zip code residents lived in the same house 5 years ago. Out of people who lived in different houses, 61% lived in this county. Out of people who lived in different counties, 50% lived in Virginia.
89% of the 24069 zip code residents lived in the same house 1 year ago. Out of people who lived in different houses, 28% moved from this county. Out of people who lived in different houses, 60% moved from different county within same state. Out of people who lived in different houses, 13% moved from abroad.
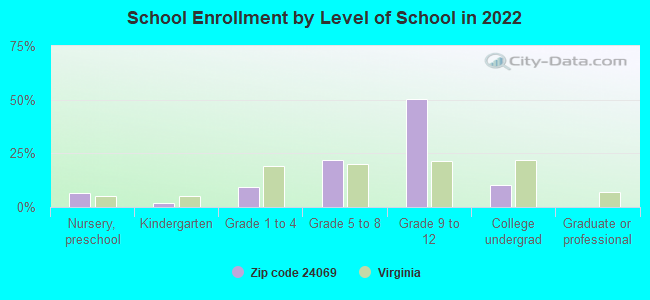
Private vs. public school enrollment:
Students in private schools in grades 1 to 8 (elementary and middle school): 20
Here:
53.7%
Virginia:
13.2%
Students in private schools in grades 9 to 12 (high school): 17
Here:
31.2%
Virginia:
10.2%
Students in private undergraduate colleges: 10
Here:
100.0%
Virginia:
18.7%
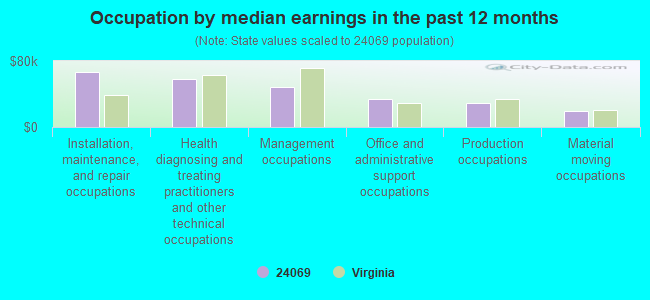
Occupation by median earnings in the past 12 months ($)
66,216Installation, maintenance, and repair occupations
58,090Health diagnosing and treating practitioners and other technical occupations
48,938Management occupations
33,739Office and administrative support occupations
29,291Production occupations
19,999Material moving occupations
Top industries in this zip code by the number of employees in 2005:
Other Services (except Public Administration): Religious Organizations (5-9 employees: 1 establishment, 1-4 employees: 1 establishment)
Health Care and Social Assistance: Child Day Care Services (5-9: 1)
Construction: Residential Remodelers (1-4: 1)
Construction: Drywall and Insulation Contractors (1-4: 1)
Wholesale Trade: Other Electronic Parts and Equipment Merchant Wholesalers (1-4: 1)
Wholesale Trade: Farm and Garden Machinery and Equipment Merchant Wholesalers (1-4: 1)
People in group quarters in 2000:
19 people in other noninstitutional group quarters
Fatal accident statistics in 2013:
Fatal accident count: 2
Vehicles involved in fatal accidents: 2
Fatal accidents caused by drunken drivers: 2
Fatalities: 2
Persons involved in fatal accidents: 2
Pedestrians involved in fatal accidents: 0
Fatal accident statistics in 2010:
Fatal accident count: 1
Vehicles involved in fatal accidents: 3
Fatal accidents caused by drunken drivers: 0
Fatalities: 1
Persons involved in fatal accidents: 3
Pedestrians involved in fatal accidents: 0
Home Mortgage Disclosure Act Aggregated Statistics For Year 2009 (Based on 4 partial tracts)
A) FHA, FSA/RHS & VA Home Purchase Loans
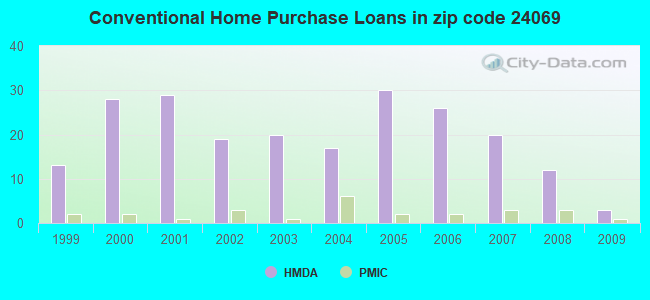
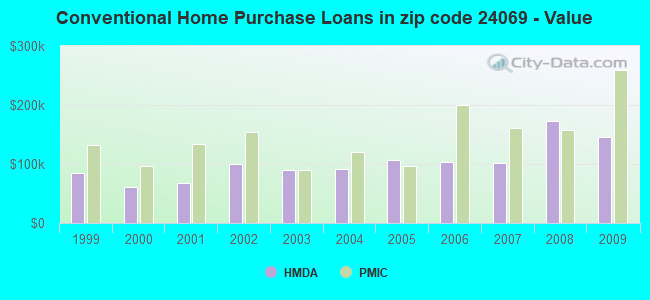
B) Conventional Home Purchase Loans
C) Refinancings
D) Home Improvement Loans
F) Non-occupant Loans on < 5 Family Dwellings (A B C & D)
G) Loans On Manufactured Home Dwelling (A B C & D)
Number
Average Value
Number
Average Value
Number
Average Value
Number
Average Value
Number
Average Value
Number
Average Value
LOANS ORIGINATED
3
$130,247
3
$145,173
44
$108,194
3
$33,960
1
$30,230
3
$66,803
APPLICATIONS APPROVED, NOT ACCEPTED
1
$103,000
1
$89,570
1
$59,340
0
$0
0
$0
0
$0
APPLICATIONS DENIED
2
$163,460
1
$78,370
29
$146,706
2
$22,390
0
$0
7
$75,173
APPLICATIONS WITHDRAWN
0
$0
0
$0
6
$91,620
0
$0
0
$0
0
$0
FILES CLOSED FOR INCOMPLETENESS
0
$0
0
$0
0
$0
0
$0
0
$0
0
$0
Aggregated Statistics For Year 2008 (Based on 4 partial tracts)
A) FHA, FSA/RHS & VA Home Purchase Loans
B) Conventional Home Purchase Loans
C) Refinancings
D) Home Improvement Loans
F) Non-occupant Loans on < 5 Family Dwellings (A B C & D)
G) Loans On Manufactured Home Dwelling (A B C & D)
Number
Average Value
Number
Average Value
Number
Average Value
Number
Average Value
Number
Average Value
Number
Average Value
LOANS ORIGINATED
12
$118,118
12
$172,138
36
$92,678
6
$39,560
4
$54,580
10
$69,079
APPLICATIONS APPROVED, NOT ACCEPTED
1
$160,100
0
$0
7
$170,499
1
$24,630
1
$23,510
1
$23,510
APPLICATIONS DENIED
0
$0
3
$192,943
36
$108,290
12
$18,660
1
$98,520
9
$56,851
APPLICATIONS WITHDRAWN
0
$0
2
$136,030
12
$130,433
0
$0
1
$227,280
2
$146,110
FILES CLOSED FOR INCOMPLETENESS
0
$0
0
$0
1
$190,330
1
$81,730
0
$0
1
$81,730
Aggregated Statistics For Year 2007 (Based on 4 partial tracts)
A) FHA, FSA/RHS & VA Home Purchase Loans
B) Conventional Home Purchase Loans
C) Refinancings
D) Home Improvement Loans
F) Non-occupant Loans on < 5 Family Dwellings (A B C & D)
G) Loans On Manufactured Home Dwelling (A B C & D)
Number
Average Value
Number
Average Value
Number
Average Value
Number
Average Value
Number
Average Value
Number
Average Value
LOANS ORIGINATED
3
$114,200
20
$101,436
25
$100,854
9
$24,631
4
$51,222
7
$47,023
APPLICATIONS APPROVED, NOT ACCEPTED
0
$0
3
$78,373
3
$80,237
2
$58,780
0
$0
3
$57,473
APPLICATIONS DENIED
1
$75,010
10
$99,420
45
$85,488
4
$117,558
2
$106,360
10
$51,054
APPLICATIONS WITHDRAWN
0
$0
2
$231,195
29
$109,605
2
$100,765
0
$0
7
$37,107
FILES CLOSED FOR INCOMPLETENESS
0
$0
1
$167,940
2
$117,000
0
$0
0
$0
0
$0
Aggregated Statistics For Year 2006 (Based on 4 partial tracts)
A) FHA, FSA/RHS & VA Home Purchase Loans
B) Conventional Home Purchase Loans
C) Refinancings
D) Home Improvement Loans
F) Non-occupant Loans on < 5 Family Dwellings (A B C & D)
G) Loans On Manufactured Home Dwelling (A B C & D)
Number
Average Value
Number
Average Value
Number
Average Value
Number
Average Value
Number
Average Value
Number
Average Value
LOANS ORIGINATED
2
$103,565
26
$103,477
46
$88,789
4
$109,440
7
$47,183
11
$67,278
APPLICATIONS APPROVED, NOT ACCEPTED
0
$0
4
$122,875
8
$68,575
1
$32,470
0
$0
2
$29,670
APPLICATIONS DENIED
1
$124,280
7
$74,533
53
$85,280
13
$33,588
0
$0
20
$64,937
APPLICATIONS WITHDRAWN
0
$0
3
$139,950
40
$107,621
1
$44,780
0
$0
3
$103,377
FILES CLOSED FOR INCOMPLETENESS
0
$0
1
$57,100
3
$109,347
1
$78,370
0
$0
0
$0
Aggregated Statistics For Year 2005 (Based on 4 partial tracts)
A) FHA, FSA/RHS & VA Home Purchase Loans
B) Conventional Home Purchase Loans
C) Refinancings
D) Home Improvement Loans
F) Non-occupant Loans on < 5 Family Dwellings (A B C & D)
G) Loans On Manufactured Home Dwelling (A B C & D)
Number
Average Value
Number
Average Value
Number
Average Value
Number
Average Value
Number
Average Value
Number
Average Value
LOANS ORIGINATED
8
$81,171
30
$107,332
49
$91,602
10
$53,741
8
$45,484
13
$89,568
APPLICATIONS APPROVED, NOT ACCEPTED
0
$0
2
$99,085
10
$84,866
1
$16,790
0
$0
1
$57,100
APPLICATIONS DENIED
6
$65,870
16
$83,410
56
$74,733
13
$51,071
3
$39,933
31
$69,451
APPLICATIONS WITHDRAWN
1
$80,610
3
$123,530
32
$89,428
3
$225,413
1
$73,890
6
$67,735
FILES CLOSED FOR INCOMPLETENESS
0
$0
0
$0
4
$90,128
0
$0
0
$0
0
$0
Aggregated Statistics For Year 2004 (Based on 4 partial tracts)
A) FHA, FSA/RHS & VA Home Purchase Loans
B) Conventional Home Purchase Loans
C) Refinancings
D) Home Improvement Loans
F) Non-occupant Loans on < 5 Family Dwellings (A B C & D)
G) Loans On Manufactured Home Dwelling (A B C & D)
Number
Average Value
Number
Average Value
Number
Average Value
Number
Average Value
Number
Average Value
Number
Average Value
LOANS ORIGINATED
0
$0
17
$92,202
58
$95,243
4
$49,262
2
$21,830
9
$59,214
APPLICATIONS APPROVED, NOT ACCEPTED
0
$0
3
$117,183
9
$137,960
0
$0
0
$0
3
$86,583
APPLICATIONS DENIED
0
$0
8
$112,520
56
$77,572
4
$35,828
2
$50,940
26
$60,243
APPLICATIONS WITHDRAWN
1
$125,400
2
$38,625
17
$84,695
4
$26,870
2
$20,715
3
$83,223
FILES CLOSED FOR INCOMPLETENESS
0
$0
0
$0
3
$95,540
2
$24,070
0
$0
1
$100,760
Aggregated Statistics For Year 2003 (Based on 4 partial tracts)
A) FHA, FSA/RHS & VA Home Purchase Loans
B) Conventional Home Purchase Loans
C) Refinancings
D) Home Improvement Loans
F) Non-occupant Loans on < 5 Family Dwellings (A B C & D)
Number
Average Value
Number
Average Value
Number
Average Value
Number
Average Value
Number
Average Value
LOANS ORIGINATED
2
$124,275
20
$90,016
95
$90,299
7
$35,027
2
$129,315
APPLICATIONS APPROVED, NOT ACCEPTED
0
$0
1
$17,910
17
$72,379
1
$57,100
1
$57,100
APPLICATIONS DENIED
0
$0
2
$27,430
46
$66,713
1
$27,990
1
$50,380
APPLICATIONS WITHDRAWN
1
$79,490
1
$111,960
25
$81,776
1
$10,080
0
$0
FILES CLOSED FOR INCOMPLETENESS
1
$106,360
1
$96,290
3
$118,303
0
$0
0
$0
Aggregated Statistics For Year 2002 (Based on 4 partial tracts)
A) FHA, FSA/RHS & VA Home Purchase Loans
B) Conventional Home Purchase Loans
C) Refinancings
D) Home Improvement Loans
F) Non-occupant Loans on < 5 Family Dwellings (A B C & D)
Number
Average Value
Number
Average Value
Number
Average Value
Number
Average Value
Number
Average Value
LOANS ORIGINATED
7
$59,819
19
$99,350
78
$91,233
4
$72,775
7
$46,543
APPLICATIONS APPROVED, NOT ACCEPTED
0
$0
6
$54,300
17
$69,218
0
$0
1
$96,290
APPLICATIONS DENIED
0
$0
13
$69,243
67
$67,627
4
$18,752
0
$0
APPLICATIONS WITHDRAWN
0
$0
1
$66,060
24
$88,122
0
$0
0
$0
FILES CLOSED FOR INCOMPLETENESS
0
$0
1
$86,210
4
$78,092
0
$0
0
$0
Aggregated Statistics For Year 2001 (Based on 4 partial tracts)
A) FHA, FSA/RHS & VA Home Purchase Loans
B) Conventional Home Purchase Loans
C) Refinancings
D) Home Improvement Loans
F) Non-occupant Loans on < 5 Family Dwellings (A B C & D)
Number
Average Value
Number
Average Value
Number
Average Value
Number
Average Value
Number
Average Value
LOANS ORIGINATED
13
$60,458
29
$68,141
57
$88,704
8
$44,644
7
$30,549
APPLICATIONS APPROVED, NOT ACCEPTED
0
$0
8
$48,702
10
$53,853
1
$11,200
0
$0
APPLICATIONS DENIED
0
$0
25
$37,081
53
$55,790
8
$27,290
0
$0
APPLICATIONS WITHDRAWN
0
$0
4
$61,298
19
$81,907
0
$0
0
$0
FILES CLOSED FOR INCOMPLETENESS
0
$0
0
$0
7
$74,213
0
$0
0
$0
Aggregated Statistics For Year 2000 (Based on 4 partial tracts)
A) FHA, FSA/RHS & VA Home Purchase Loans
B) Conventional Home Purchase Loans
C) Refinancings
D) Home Improvement Loans
F) Non-occupant Loans on < 5 Family Dwellings (A B C & D)
Number
Average Value
Number
Average Value
Number
Average Value
Number
Average Value
Number
Average Value
LOANS ORIGINATED
7
$109,241
28
$60,538
35
$65,257
8
$13,855
1
$53,740
APPLICATIONS APPROVED, NOT ACCEPTED
6
$43,852
8
$58,919
9
$57,597
1
$3,360
0
$0
APPLICATIONS DENIED
2
$68,855
18
$52,994
53
$48,819
12
$18,193
0
$0
APPLICATIONS WITHDRAWN
4
$88,728
3
$66,803
8
$68,715
0
$0
1
$45,900
FILES CLOSED FOR INCOMPLETENESS
0
$0
0
$0
1
$92,930
0
$0
0
$0
Aggregated Statistics For Year 1999 (Based on 2 partial tracts)
A) FHA, FSA/RHS & VA Home Purchase Loans
B) Conventional Home Purchase Loans
C) Refinancings
D) Home Improvement Loans
E) Loans on Dwellings For 5+ Families
F) Non-occupant Loans on < 5 Family Dwellings (A B C & D)
Detailed PMIC statistics for the following Tracts:0111.00
2002 - 2018 National Fire Incident Reporting System (NFIRS) incidents
According to the data from the years 2002 - 2018 the average number of fires per year is 20. The highest number of fires - 40 took place in 2005, and the least - 4 in 2003. The data has a constant trend.
When looking into fire subcategories, the most incidents belonged to: Outside Fires (48.8%), and Structure Fires (33.1%).
Fire incident types reported to NFIRS in Zip Code 24069


 Nearest zip codes: 24054, 24541, 27288, 27326, 24549, 27311.


 According to the data from the years 2002 - 2018 the average number of fires per year is 20. The highest number of fires - 40 took place in 2005, and the least - 4 in 2003. The data has a constant trend.
 When looking into fire subcategories, the most incidents belonged to: Outside Fires (48.8%), and Structure Fires (33.1%).