Estimated zip code population in 2022: 4,366 Zip code population in 2010: 4,292 Zip code population in 2000: 4,203
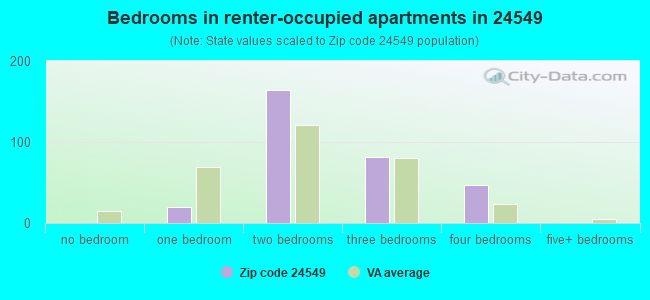
Houses and condos: 2,025 Renter-occupied apartments: 317
% of renters here:
19%
State:
33%
March 2022 cost of living index in zip code 24549: 83.8 (less than average, U.S. average is 100)
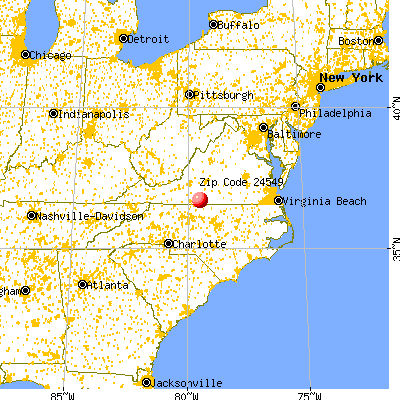
Land area: 51.1 sq. mi. Water area: 0.1 sq. mi.
Population density: 86 people per square mile
(very low).
OSM Map
General Map
Google Map
MSN Map
OSM Map
General Map
Google Map
MSN Map
OSM Map
General Map
Google Map
MSN Map
OSM Map
General Map
Google Map
MSN Map
Please wait while loading the map...
Real estate property taxes paid for housing units in 2022:
This zip code:
0.6% ($804)
Virginia:
0.7% ($2,617)
Median real estate property taxes paid for housing units with mortgages in 2022: $788 (0.5%) Median real estate property taxes paid for housing units with no mortgage in 2022: $840 (0.6%)
Business Search- 14 Million verified businesses
Males: 2,377
(54.5%)
Females: 1,988
(45.5%)
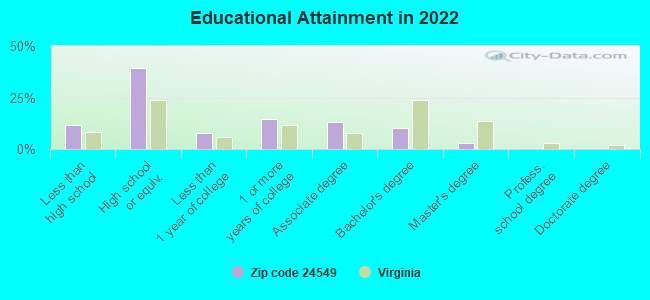
For population 25 years and over in 24549:
High school or higher: 86.9%
Bachelor's degree or higher: 13.2%
Graduate or professional degree: 2.9%
Unemployed: 5.1%
Mean travel time to work (commute): 27.4 minutes
For population 15 years and over in 24549:
Never married: 27.0%
Now married: 50.2%
Separated: 1.8%
Widowed: 10.7%
Divorced: 10.2%
Zip code 24549 compared to state average:
Median household income below state average.
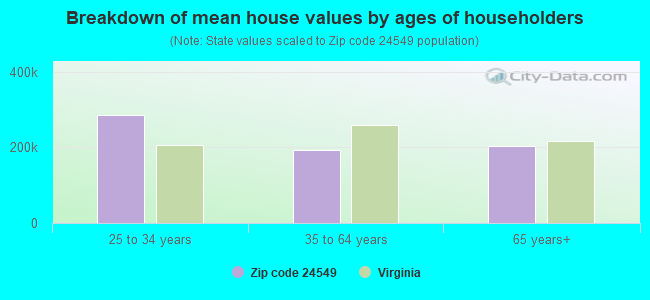
Median house value significantly below state average.
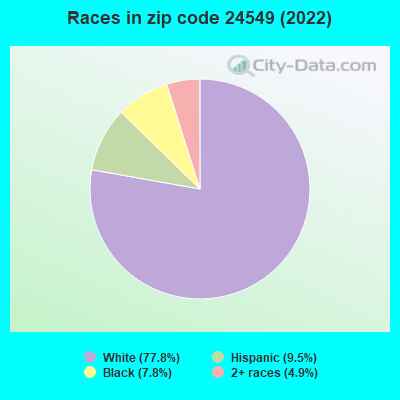
Black race population percentage below state average.
Median age above state average.
Foreign-born population percentage significantly below state average.
Renting percentage below state average.
Length of stay since moving in significantly above state average.
Percentage of population with a bachelor's degree or higher significantly below state average.
Estimated median house/condo value in 2022: $145,182
24549:
$145,182
Virginia:
$365,700
According to our research of Virginia and other state lists, there were 9 registered sex offenders living in 24549 zip code as of April 27, 2024. The ratio of all residents to sex offenders in zip code 24549 is 476 to 1. The ratio of registered sex offenders to all residents in this zip code is lower than the state average.
Median resident age:
This zip code:
45.1 years
Virginia median age:
39.0 years
Average household size:
This zip code:
2.6 people
Virginia:
2.5 people
Averages for the 2020 tax year for zip code 24549, filed in 2021:
Average Adjusted Gross Income (AGI) in 2020: $52,853 (Individual Income Tax Returns)
Here:
$52,853
State:
$86,446
Salary/wage: $46,073 (reported on 84.4% of returns)
Here:
$46,073
State:
$71,185
(% of AGI for various income ranges: 1193.0% for AGIs below $25k, 3529.8% for AGIs $25k-50k, 6174.5% for AGIs $50k-75k, 9439.4% for AGIs $75k-100k, 14125.4% for AGIs $100k-200k)
Taxable interest for individuals: $1,173 (reported on 25.8% of returns)
This zip code:
$1,173
Virginia:
$1,805
(% of AGI for various income ranges: 20.4% for AGIs below $25k, 21.9% for AGIs $25k-50k, 23.2% for AGIs $50k-75k, 38.1% for AGIs $75k-100k, 202.3% for AGIs $100k-200k)
Ordinary dividends: $3,135 (reported on 12.4% of returns)
Here:
$3,135
State:
$8,327
(% of AGI for various income ranges: 14.5% for AGIs below $25k, 19.8% for AGIs $25k-50k, 51.4% for AGIs $50k-75k, 100.6% for AGIs $75k-100k, 227.7% for AGIs $100k-200k)
Net capital gain/loss in AGI: +$10,460 (reported on 10.8% of returns)
Here:
+$10,460
State:
+$24,644
(% of AGI for various income ranges: 19.8% for AGIs below $25k, 25.5% for AGIs $25k-50k, 92.3% for AGIs $50k-75k, 129.4% for AGIs $75k-100k, 1140.0% for AGIs $100k-200k)
Profit/loss from business: +$5,319 (reported on 14.0% of returns)
Here:
+$5,319
State:
+$12,836
(% of AGI for various income ranges: 58.5% for AGIs below $25k, 93.1% for AGIs $25k-50k, 61.8% for AGIs $50k-75k, 143.1% for AGIs $75k-100k, 270.8% for AGIs $100k-200k)
Taxable individual retirement arrangement distribution: $13,629 (reported on 9.1% of returns)
24549:
$13,629
Virginia:
$21,535
(% of AGI for various income ranges: 51.9% for AGIs below $25k, 87.9% for AGIs $25k-50k, 197.7% for AGIs $50k-75k, 299.4% for AGIs $75k-100k, 607.7% for AGIs $100k-200k)
Total itemized deductions: $31,733 (reported on 4.8% of returns)
Here:
$31,733
State:
$33,287
(% of AGI for various income ranges: 98.3% for AGIs below $25k, 244.1% for AGIs $50k-75k, 465.6% for AGIs $75k-100k, 855.4% for AGIs $100k-200k)
Charity contributions: $12,233 (reported on 4.8% of returns)
Here:
$12,233
State:
$10,381
(% of AGI for various income ranges: 87.4% for AGIs $25k-50k, 170.0% for AGIs $75k-100k, 355.4% for AGIs $100k-200k)
Taxes paid: $6,467 (reported on 4.8% of returns)
24549:
$6,467
State:
$8,284
(% of AGI for various income ranges: 10.9% for AGIs below $25k, 35.5% for AGIs $50k-75k, 91.9% for AGIs $75k-100k, 235.4% for AGIs $100k-200k)
Earned income credit: $2,248 (reported on 17.7% of returns)
Here:
$2,248
State:
$2,214
(% of AGI for various income ranges: 91.3% for AGIs below $25k, 74.5% for AGIs $25k-50k)
Percentage of individuals using paid preparers for their 2020 taxes: 92.5%
Here:
92%
State:
92%
(% for various income ranges: 92.1% for AGIs below $25k, 92.3% for AGIs $25k-50k, 92.9% for AGIs $50k-75k, 95.2% for AGIs $75k-100k, 94.7% for AGIs $100k-200k, 66.7% for AGIs over 200k)
Averages for the 2012 tax year for zip code 24549, filed in 2013:
Average Adjusted Gross Income (AGI) in 2012: $42,786 (Individual Income Tax Returns)
Here:
$42,786
State:
$71,192
Salary/wage: $38,724 (reported on 88.1% of returns)
Here:
$38,724
State:
$59,229
(% of AGI for various income ranges: 80.6% for AGIs below $25k, 82.9% for AGIs $25k-50k, 83.6% for AGIs $50k-75k, 82.5% for AGIs $75k-100k, 70.3% for AGIs $100k-200k)
Taxable interest for individuals: $1,095 (reported on 31.1% of returns)
This zip code:
$1,095
Virginia:
$1,600
(% of AGI for various income ranges: 1.3% for AGIs below $25k, 0.7% for AGIs $25k-50k, 0.5% for AGIs $50k-75k, 0.7% for AGIs $75k-100k, 1.0% for AGIs $100k-200k)
Ordinary dividends: $2,035 (reported on 13.0% of returns)
Here:
$2,035
State:
$6,959
(% of AGI for various income ranges: 0.6% for AGIs below $25k, 0.6% for AGIs $25k-50k, 0.5% for AGIs $50k-75k, 0.3% for AGIs $75k-100k, 1.1% for AGIs $100k-200k)
Net capital gain/loss in AGI: +$2,339 (reported on 10.2% of returns)
Here:
+$2,339
State:
+$16,672
(% of AGI for various income ranges: 0.2% for AGIs $50k-75k, 0.3% for AGIs $75k-100k, 1.9% for AGIs $100k-200k)
Profit/loss from business: +$6,876 (reported on 14.1% of returns)
Here:
+$6,876
State:
+$14,116
(% of AGI for various income ranges: 4.6% for AGIs below $25k, 1.9% for AGIs $25k-50k, 3.7% for AGIs $50k-75k, 1.6% for AGIs $100k-200k)
Taxable individual retirement arrangement distribution: $11,567 (reported on 8.5% of returns)
24549:
$11,567
Virginia:
$16,667
(% of AGI for various income ranges: 3.2% for AGIs below $25k, 1.7% for AGIs $25k-50k, 2.3% for AGIs $50k-75k, 5.8% for AGIs $75k-100k)
Total itemized deductions: $17,180 (23% of AGI, reported on 24.9% of returns)
Here:
$17,180
State:
$26,596
Here:
22.7% of AGI
State:
20.1% of AGI
(% of AGI for various income ranges: 5.0% for AGIs below $25k, 8.3% for AGIs $25k-50k, 10.5% for AGIs $50k-75k, 12.6% for AGIs $75k-100k, 11.9% for AGIs $100k-200k)
Charity contributions: $4,319 (reported on 20.9% of returns)
Here:
$4,319
State:
$4,443
(% of AGI for various income ranges: 1.8% for AGIs $25k-50k, 2.5% for AGIs $50k-75k, 2.9% for AGIs $75k-100k, 2.6% for AGIs $100k-200k)
Taxes paid: $4,723 (reported on 24.9% of returns)
24549:
$4,723
State:
$9,951
(% of AGI for various income ranges: 0.5% for AGIs below $25k, 1.7% for AGIs $25k-50k, 2.3% for AGIs $50k-75k, 3.6% for AGIs $75k-100k, 4.8% for AGIs $100k-200k)
Earned income credit: $2,379 (reported on 22.0% of returns)
Here:
$2,379
State:
$2,211
(% of AGI for various income ranges: 7.3% for AGIs below $25k, 1.4% for AGIs $25k-50k)
Percentage of individuals using paid preparers for their 2012 taxes: 56.5%
Here:
56%
State:
46%
(% for various income ranges: 50.7% for AGIs below $25k, 55.8% for AGIs $25k-50k, 62.1% for AGIs $50k-75k, 60.0% for AGIs $75k-100k, 75.0% for AGIs $100k-200k)
Averages for the 2004 tax year for zip code 24549, filed in 2005:
Average Adjusted Gross Income (AGI) in 2004: $36,108 (Individual Income Tax Returns)
Here:
$36,108
State:
$56,704
Salary/wage: $33,533 (reported on 88.8% of returns)
Here:
$33,533
State:
$48,441
(% of AGI for various income ranges: 108.4% for AGIs below $10k, 80.5% for AGIs $10k-25k, 87.2% for AGIs $25k-50k, 88.7% for AGIs $50k-75k, 87.1% for AGIs $75k-100k, 57.2% for AGIs over 100k)
Taxable interest for individuals: $1,066 (reported on 40.1% of returns)
This zip code:
$1,066
Virginia:
$1,688
(% of AGI for various income ranges: 4.0% for AGIs below $10k, 1.8% for AGIs $10k-25k, 0.9% for AGIs $25k-50k, 0.6% for AGIs $50k-75k, 1.0% for AGIs $75k-100k, 1.9% for AGIs over 100k)
Taxable dividends: $1,683 (reported on 15.2% of returns)
Here:
$1,683
State:
$4,028
(% of AGI for various income ranges: 1.7% for AGIs below $10k, 0.8% for AGIs $10k-25k, 0.4% for AGIs $25k-50k, 0.3% for AGIs $50k-75k, 0.8% for AGIs $75k-100k, 1.6% for AGIs over 100k)
Net capital gain/loss: +$6,943 (reported on 12.1% of returns)
Here:
+$6,943
State:
+$14,375
(% of AGI for various income ranges: 1.1% for AGIs below $10k, -0.3% for AGIs $10k-25k, 1.2% for AGIs $25k-50k, 1.2% for AGIs $50k-75k, 1.4% for AGIs $75k-100k, 9.8% for AGIs over 100k)
Profit/loss from business: +$5,638 (reported on 14.1% of returns)
Here:
+$5,638
State:
+$13,342
(% of AGI for various income ranges: 7.6% for AGIs below $10k, 4.3% for AGIs $10k-25k, 3.1% for AGIs $25k-50k, 0.9% for AGIs $50k-75k, 0.5% for AGIs $75k-100k, 1.5% for AGIs over 100k)
IRA payment deduction: $3,025 (reported on 2.3% of returns)
24549:
$3,025
Virginia:
$2,943
Total itemized deductions: $13,887 (22% of AGI, reported on 26.5% of returns)
Here:
$13,887
State:
$21,492
Here:
22.5% of AGI
State:
21.0% of AGI
(% of AGI for various income ranges: 12.2% for AGIs below $10k, 5.8% for AGIs $10k-25k, 9.2% for AGIs $25k-50k, 11.6% for AGIs $50k-75k, 13.5% for AGIs $75k-100k, 10.6% for AGIs over 100k)
Charity contributions deductions: $3,362 (5% of AGI, reported on 23.7% of returns)
Here:
$3,362
State:
$3,794
Here:
5.3% of AGI
State:
3.5% of AGI
(% of AGI for various income ranges: 1.3% for AGIs $10k-25k, 2.0% for AGIs $25k-50k, 2.5% for AGIs $50k-75k, 3.1% for AGIs $75k-100k, 2.4% for AGIs over 100k)
Total tax: $3,984 (reported on 75.0% of returns)
24549:
$3,984
State:
$9,537
(% of AGI for various income ranges: 3.4% for AGIs below $10k, 3.9% for AGIs $10k-25k, 6.1% for AGIs $25k-50k, 7.7% for AGIs $50k-75k, 10.1% for AGIs $75k-100k, 16.5% for AGIs over 100k)
Earned income credit: $1,602 (reported on 19.7% of returns)
Here:
$1,602
State:
$1,734
Percentage of individuals using paid preparers for their 2004 taxes: 67.8%
Here:
68%
State:
52%
(% for various income ranges: 63.2% for AGIs below $10k, 69.7% for AGIs $10k-25k, 67.5% for AGIs $25k-50k, 66.7% for AGIs $50k-75k, 62.6% for AGIs $75k-100k, 88.1% for AGIs over 100k)
Likely homosexual households (counted as self-reported same-sex unmarried-partner households)
Lesbian couples: 0.5% of all households
Gay men: 0.0% of all households
Household received Food Stamps/SNAP in the past 12 months: 347 Household did not receive Food Stamps/SNAP in the past 12 months: 1,381
Women who had a birth in the past 12 months: 28 (9 now married, 17 unmarried) Women who did not have a birth in the past 12 months: 741 (417 now married, 320 unmarried)
Housing units in zip code 24549 with a mortgage: 553 (49 second mortgage, 10 home equity loan, 25 both second mortgage and home equity loan) Houses without a mortgage: 13
Median monthly owner costs for units with a mortgage: $987 Median monthly owner costs for units without a mortgage: $402
Residents with income below the poverty level in 2022:
This zip code:
18.0%
Whole state:
10.6%
Residents with income below 50% of the poverty level in 2022:
This zip code:
9.0%
Whole state:
5.2%
Median number of rooms in houses and condos:
Here:
5.3
State:
7.0
Median number of rooms in apartments:
Here:
5.0
State:
4.3
Notable locations in this zip code not listed on our city pages
Churches in zip code 24549 include: Canaan Church (A), Church of Truth (B), Swansonville Church (C), Tarpleys Chapel (D), Dry Fork Church (E), Gilfield Church (F), White Oak Grove Missionary Baptist Church (G), Whitmell Church (H), Wordens Chapel (I). Display/hide their locations on the map
In group quarters: 15 (-1 institutionalized population)
Size of family households: 593 2-persons, 317 3-persons, 250 4-persons, 110 5-persons, 9 6-persons
Size of nonfamily households: 372 1-person, 34 2-persons
592 married couples with children.
285 single-parent households (90 men, 195 women).
92.6% of residents of 24549 zip code speak English at home.
6.7% of residents speak Spanish at home (29% very well, 57% well, 14% not well).
0.2% of residents speak other Indo-European language at home (100% very well).
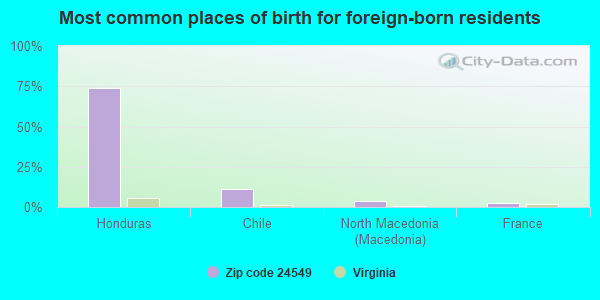
Foreign born population: 225 (5.2%) (75.0% of them are naturalized citizens)
This zip code:
5.2%
Whole state:
12.7%
74%Honduras
11%Chile
4%North Macedonia (Macedonia)
3%France
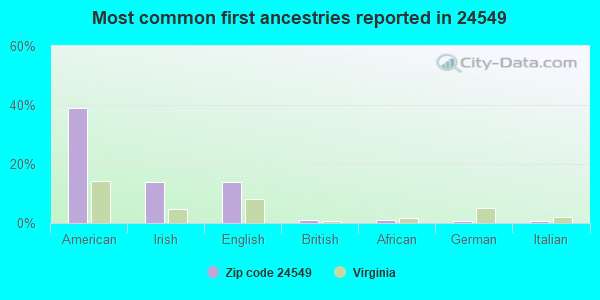
39%American
14%Irish
14%English
1%British
1%African
1%German
1%Italian
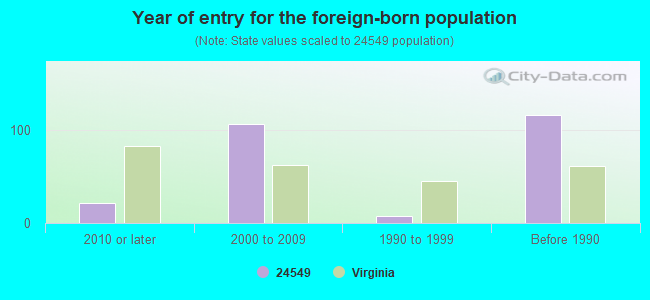
Year of entry for the foreign-born population
212010 or later
1062000 to 2009
81990 to 1999
116Before 1990
Facilities with environmental interests located in this zip code:
DRY FORK MILLING COMPANY (RT 933 in DRY FORK, VA)
AIR MINOR (AIRS/AFS) STATE MASTER (Virginia pollutants databases) - CEDS-30245, AIR PROGRAM Business SIC classification: PREPARED FEEDS AND FEED INGREDIENTS FOR ANIMALS AND FOWLS, EXCEPT DOGS AND CATS Business NAICS classification: OTHER ANIMAL FOOD MANUFACTURING.
Housing units lacking complete plumbing facilities: 8.5% Housing units lacking complete kitchen facilities: 6.0%
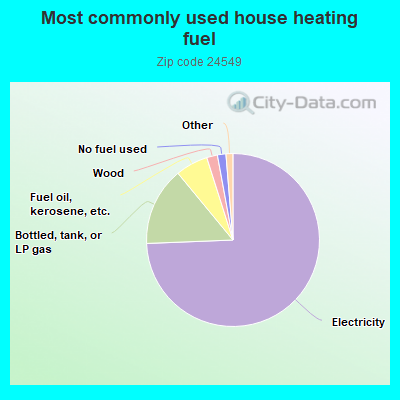
74.6%Electricity
14.7%Bottled, tank, or LP gas
6.1%Fuel oil, kerosene, etc.
2.0%Wood
1.6%No fuel used
0.7%Utility gas
0.7%Other fuel
Population in 1990: 1,989. Population change in the 1990s: +2,214 (+111.3%).
Place of birth for U.S.-born residents:
This state: 3,068
Northeast: 134
Midwest: 83
South: 689
West: 107
61% of the 24549 zip code residents lived in the same house 5 years ago. Out of people who lived in different houses, 65% lived in this county. Out of people who lived in different counties, 50% lived in Virginia.
98% of the 24549 zip code residents lived in the same house 1 year ago. Out of people who lived in different houses, 25% moved from this county. Out of people who lived in different houses, 101% moved from different state.
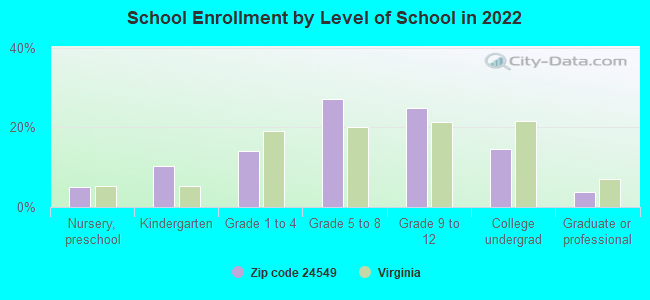
Private vs. public school enrollment:
Students in private schools in grades 1 to 8 (elementary and middle school): 33
Here:
8.8%
Virginia:
13.2%
Students in private schools in grades 9 to 12 (high school): 9
Here:
4.2%
Virginia:
10.2%
Students in private undergraduate colleges: 26
Here:
20.1%
Virginia:
18.7%
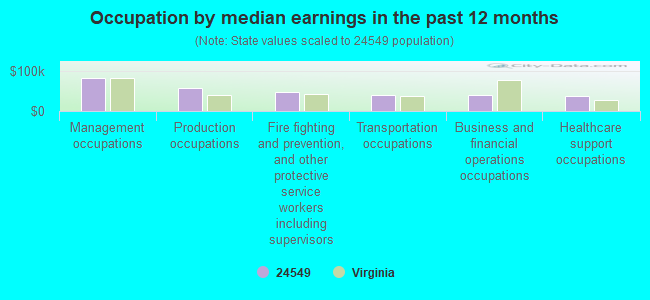
Occupation by median earnings in the past 12 months ($)
83,880Management occupations
57,249Production occupations
48,937Fire fighting and prevention, and other protective service workers including supervisors
40,745Transportation occupations
40,276Business and financial operations occupations
37,611Healthcare support occupations
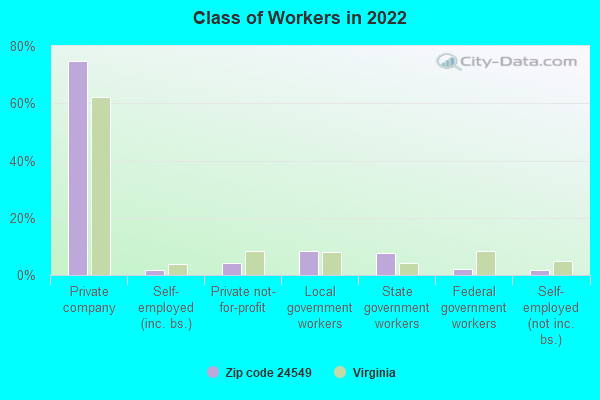
Top industries in this zip code by the number of employees in 2005:
Wholesale Trade: Automobile and Other Motor Vehicle Merchant Wholesalers (20-49 employees: 1 establishment)
Other Services (except Public Administration): Religious Organizations (5-9: 3, 1-4: 6)
Accommodation and Food Services: Full-Service Restaurants (10-19: 1, 1-4: 1)
Construction: Drywall and Insulation Contractors (10-19: 1)
Construction: Highway, Street, and Bridge Construction (10-19: 1)
Construction: All Other Specialty Trade Contractors (5-9: 1, 1-4: 2)
Health Care and Social Assistance: Child Day Care Services (5-9: 1)
Construction: Painting and Wall Covering Contractors (1-4: 2)
Other Services (except Public Administration): Commercial and Industrial Machinery and Equipment (except Automotive and Electronic) Repair and Maintenance (1-4: 2)
People in group quarters in 2010:
9 people in workers' group living quarters and job corps centers
Fatal accident statistics in 2013:
Fatal accident count: 1
Vehicles involved in fatal accidents: 1
Fatal accidents caused by drunken drivers: 1
Fatalities: 1
Persons involved in fatal accidents: 1
Pedestrians involved in fatal accidents: 0
Fatal accident statistics in 2012:
Fatal accident count: 1
Vehicles involved in fatal accidents: 1
Fatal accidents caused by drunken drivers: 0
Fatalities: 1
Persons involved in fatal accidents: 1
Pedestrians involved in fatal accidents: 1
Home Mortgage Disclosure Act Aggregated Statistics For Year 2009 (Based on 4 partial tracts)
A) FHA, FSA/RHS & VA Home Purchase Loans
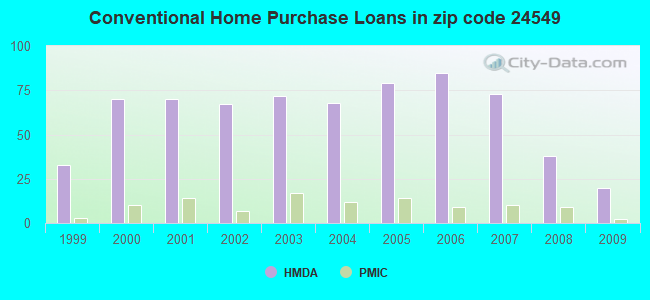
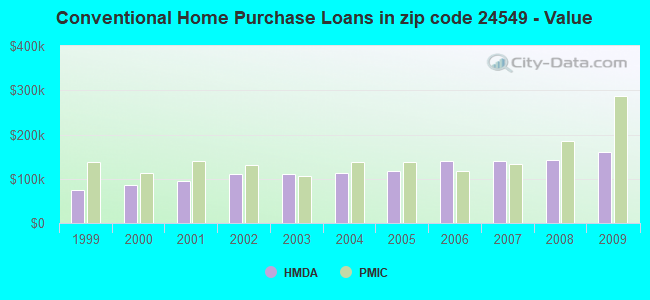
B) Conventional Home Purchase Loans
C) Refinancings
D) Home Improvement Loans
F) Non-occupant Loans on < 5 Family Dwellings (A B C & D)
G) Loans On Manufactured Home Dwelling (A B C & D)
Number
Average Value
Number
Average Value
Number
Average Value
Number
Average Value
Number
Average Value
Number
Average Value
LOANS ORIGINATED
31
$132,186
20
$161,539
135
$139,028
9
$66,793
5
$69,030
15
$76,628
APPLICATIONS APPROVED, NOT ACCEPTED
1
$137,330
1
$43,330
18
$140,572
1
$9,550
1
$43,330
2
$77,435
APPLICATIONS DENIED
3
$196,753
7
$80,804
65
$127,586
3
$66,690
2
$85,560
11
$70,590
APPLICATIONS WITHDRAWN
1
$125,580
3
$188,933
33
$155,610
2
$28,640
2
$249,370
1
$47,740
FILES CLOSED FOR INCOMPLETENESS
1
$187,160
1
$36,720
11
$143,248
0
$0
1
$36,720
2
$36,035
Aggregated Statistics For Year 2008 (Based on 4 partial tracts)
A) FHA, FSA/RHS & VA Home Purchase Loans
B) Conventional Home Purchase Loans
C) Refinancings
D) Home Improvement Loans
E) Loans on Dwellings For 5+ Families
F) Non-occupant Loans on < 5 Family Dwellings (A B C & D)
G) Loans On Manufactured Home Dwelling (A B C & D)
Number
Average Value
Number
Average Value
Number
Average Value
Number
Average Value
Number
Average Value
Number
Average Value
Number
Average Value
LOANS ORIGINATED
32
$119,923
38
$141,342
92
$130,586
19
$65,144
1
$205,630
11
$90,560
21
$71,496
APPLICATIONS APPROVED, NOT ACCEPTED
1
$288,620
1
$110,160
13
$95,785
0
$0
0
$0
0
$0
2
$59,855
APPLICATIONS DENIED
4
$100,950
6
$127,920
78
$108,716
17
$52,146
0
$0
3
$42,433
14
$66,121
APPLICATIONS WITHDRAWN
3
$108,690
5
$217,088
30
$145,957
2
$116,400
1
$220,320
1
$248,960
5
$71,384
FILES CLOSED FOR INCOMPLETENESS
1
$71,240
0
$0
5
$326,502
0
$0
0
$0
0
$0
1
$22,770
Aggregated Statistics For Year 2007 (Based on 4 partial tracts)
A) FHA, FSA/RHS & VA Home Purchase Loans
B) Conventional Home Purchase Loans
C) Refinancings
D) Home Improvement Loans
F) Non-occupant Loans on < 5 Family Dwellings (A B C & D)
G) Loans On Manufactured Home Dwelling (A B C & D)
Number
Average Value
Number
Average Value
Number
Average Value
Number
Average Value
Number
Average Value
Number
Average Value
LOANS ORIGINATED
21
$111,018
73
$139,355
97
$108,174
19
$51,688
17
$104,408
22
$67,990
APPLICATIONS APPROVED, NOT ACCEPTED
1
$96,940
11
$105,564
21
$108,264
5
$43,656
3
$82,443
3
$66,527
APPLICATIONS DENIED
3
$126,200
18
$162,514
106
$94,904
14
$28,131
3
$50,920
23
$66,600
APPLICATIONS WITHDRAWN
1
$63,890
8
$145,509
60
$105,688
5
$71,384
7
$102,951
12
$87,520
FILES CLOSED FOR INCOMPLETENESS
1
$108,730
3
$191,040
10
$152,518
0
$0
1
$111,510
1
$53,610
Aggregated Statistics For Year 2006 (Based on 4 partial tracts)
A) FHA, FSA/RHS & VA Home Purchase Loans
B) Conventional Home Purchase Loans
C) Refinancings
D) Home Improvement Loans
E) Loans on Dwellings For 5+ Families
F) Non-occupant Loans on < 5 Family Dwellings (A B C & D)
G) Loans On Manufactured Home Dwelling (A B C & D)
Number
Average Value
Number
Average Value
Number
Average Value
Number
Average Value
Number
Average Value
Number
Average Value
Number
Average Value
LOANS ORIGINATED
21
$115,153
85
$140,707
110
$97,774
14
$58,436
1
$161,570
11
$92,952
32
$64,406
APPLICATIONS APPROVED, NOT ACCEPTED
1
$23,500
12
$81,642
23
$91,090
4
$38,415
0
$0
2
$102,815
6
$55,695
APPLICATIONS DENIED
5
$121,686
28
$85,500
95
$92,589
22
$27,037
0
$0
4
$111,345
31
$64,323
APPLICATIONS WITHDRAWN
1
$157,160
6
$97,468
68
$107,806
2
$28,460
0
$0
3
$59,790
9
$61,414
FILES CLOSED FOR INCOMPLETENESS
1
$88,130
4
$108,808
9
$105,416
1
$36,720
0
$0
0
$0
2
$61,920
Aggregated Statistics For Year 2005 (Based on 4 partial tracts)
A) FHA, FSA/RHS & VA Home Purchase Loans
B) Conventional Home Purchase Loans
C) Refinancings
D) Home Improvement Loans
F) Non-occupant Loans on < 5 Family Dwellings (A B C & D)
G) Loans On Manufactured Home Dwelling (A B C & D)
Number
Average Value
Number
Average Value
Number
Average Value
Number
Average Value
Number
Average Value
Number
Average Value
LOANS ORIGINATED
23
$104,498
79
$117,219
138
$92,693
24
$41,932
13
$87,495
37
$59,336
APPLICATIONS APPROVED, NOT ACCEPTED
1
$172,580
8
$91,959
37
$71,873
4
$41,612
1
$93,150
4
$45,532
APPLICATIONS DENIED
2
$61,660
35
$93,077
144
$82,486
29
$26,011
4
$59,442
45
$58,065
APPLICATIONS WITHDRAWN
1
$68,300
9
$105,768
89
$105,011
9
$74,709
3
$92,960
14
$65,401
FILES CLOSED FOR INCOMPLETENESS
1
$62,420
1
$307,710
16
$92,694
0
$0
0
$0
0
$0
Aggregated Statistics For Year 2004 (Based on 4 partial tracts)
A) FHA, FSA/RHS & VA Home Purchase Loans
B) Conventional Home Purchase Loans
C) Refinancings
D) Home Improvement Loans
F) Non-occupant Loans on < 5 Family Dwellings (A B C & D)
G) Loans On Manufactured Home Dwelling (A B C & D)
Number
Average Value
Number
Average Value
Number
Average Value
Number
Average Value
Number
Average Value
Number
Average Value
LOANS ORIGINATED
21
$98,416
68
$112,671
150
$97,147
16
$29,637
12
$53,830
32
$63,266
APPLICATIONS APPROVED, NOT ACCEPTED
1
$40,390
20
$74,428
34
$86,173
3
$13,007
0
$0
15
$46,765
APPLICATIONS DENIED
1
$80,050
26
$78,914
122
$82,320
18
$31,455
4
$77,480
42
$60,972
APPLICATIONS WITHDRAWN
1
$62,730
6
$61,222
56
$101,126
2
$48,840
1
$59,930
9
$70,433
FILES CLOSED FOR INCOMPLETENESS
0
$0
4
$86,292
8
$98,960
1
$9,550
2
$52,510
0
$0
Aggregated Statistics For Year 2003 (Based on 4 partial tracts)
A) FHA, FSA/RHS & VA Home Purchase Loans
B) Conventional Home Purchase Loans
C) Refinancings
D) Home Improvement Loans
E) Loans on Dwellings For 5+ Families
F) Non-occupant Loans on < 5 Family Dwellings (A B C & D)
Number
Average Value
Number
Average Value
Number
Average Value
Number
Average Value
Number
Average Value
Number
Average Value
LOANS ORIGINATED
18
$104,551
72
$109,615
292
$98,227
12
$13,440
1
$212,240
12
$54,472
APPLICATIONS APPROVED, NOT ACCEPTED
1
$113,100
14
$63,054
41
$92,695
4
$10,832
0
$0
2
$75,650
APPLICATIONS DENIED
1
$110,890
39
$68,996
81
$82,627
6
$15,388
0
$0
3
$37,410
APPLICATIONS WITHDRAWN
2
$101,345
10
$99,291
71
$104,793
1
$35,250
0
$0
4
$69,612
FILES CLOSED FOR INCOMPLETENESS
3
$107,467
1
$231,840
13
$81,114
1
$109,430
0
$0
1
$17,630
Aggregated Statistics For Year 2002 (Based on 4 partial tracts)
A) FHA, FSA/RHS & VA Home Purchase Loans
B) Conventional Home Purchase Loans
C) Refinancings
D) Home Improvement Loans
E) Loans on Dwellings For 5+ Families
F) Non-occupant Loans on < 5 Family Dwellings (A B C & D)
Number
Average Value
Number
Average Value
Number
Average Value
Number
Average Value
Number
Average Value
Number
Average Value
LOANS ORIGINATED
16
$93,491
67
$110,501
199
$94,278
11
$17,055
1
$447,980
9
$60,723
APPLICATIONS APPROVED, NOT ACCEPTED
1
$122,130
14
$48,818
39
$86,480
1
$38,750
1
$156,430
1
$40,390
APPLICATIONS DENIED
5
$74,286
24
$56,730
112
$73,196
4
$30,660
0
$0
3
$56,953
APPLICATIONS WITHDRAWN
5
$82,492
7
$79,293
45
$88,382
1
$22,030
1
$209,300
2
$127,785
FILES CLOSED FOR INCOMPLETENESS
0
$0
1
$136,600
11
$102,795
0
$0
0
$0
1
$133,660
Aggregated Statistics For Year 2001 (Based on 4 partial tracts)
A) FHA, FSA/RHS & VA Home Purchase Loans
B) Conventional Home Purchase Loans
C) Refinancings
D) Home Improvement Loans
E) Loans on Dwellings For 5+ Families
F) Non-occupant Loans on < 5 Family Dwellings (A B C & D)
Number
Average Value
Number
Average Value
Number
Average Value
Number
Average Value
Number
Average Value
Number
Average Value
LOANS ORIGINATED
17
$74,985
70
$95,970
170
$85,312
13
$22,448
1
$213,710
14
$60,477
APPLICATIONS APPROVED, NOT ACCEPTED
1
$134,760
18
$63,299
39
$84,211
2
$30,530
0
$0
0
$0
APPLICATIONS DENIED
1
$108,690
42
$61,794
90
$67,851
5
$11,958
0
$0
1
$59,520
APPLICATIONS WITHDRAWN
2
$102,910
4
$109,302
30
$81,471
2
$24,365
0
$0
1
$16,890
FILES CLOSED FOR INCOMPLETENESS
0
$0
2
$60,955
9
$77,066
1
$25,340
0
$0
0
$0
Aggregated Statistics For Year 2000 (Based on 4 partial tracts)
A) FHA, FSA/RHS & VA Home Purchase Loans
B) Conventional Home Purchase Loans
C) Refinancings
D) Home Improvement Loans
E) Loans on Dwellings For 5+ Families
F) Non-occupant Loans on < 5 Family Dwellings (A B C & D)
Number
Average Value
Number
Average Value
Number
Average Value
Number
Average Value
Number
Average Value
Number
Average Value
LOANS ORIGINATED
12
$82,468
70
$85,319
53
$69,061
17
$26,028
2
$785,075
7
$30,933
APPLICATIONS APPROVED, NOT ACCEPTED
5
$24,216
17
$67,935
15
$65,029
3
$15,620
0
$0
0
$0
APPLICATIONS DENIED
7
$57,106
38
$54,029
50
$56,551
8
$23,044
0
$0
3
$46,890
APPLICATIONS WITHDRAWN
1
$5,070
8
$72,030
23
$57,242
3
$18,117
0
$0
1
$55,080
FILES CLOSED FOR INCOMPLETENESS
0
$0
2
$52,510
3
$79,777
1
$18,360
0
$0
0
$0
Aggregated Statistics For Year 1999 (Based on 2 partial tracts)
A) FHA, FSA/RHS & VA Home Purchase Loans
B) Conventional Home Purchase Loans
C) Refinancings
D) Home Improvement Loans
F) Non-occupant Loans on < 5 Family Dwellings (A B C & D)
Detailed PMIC statistics for the following Tracts:0109.00
, 0110.00
2002 - 2018 National Fire Incident Reporting System (NFIRS) incidents
Based on the data from the years 2002 - 2018 the average number of fires per year is 24. The highest number of reported fire incidents - 50 took place in 2014, and the least - 3 in 2002. The data has an increasing trend.
When looking into fire subcategories, the most incidents belonged to: Outside Fires (45.0%), and Structure Fires (43.3%).
Fire incident types reported to NFIRS in Zip Code 24549


 Nearest zip codes: 24540, 24541, 24531, 24530, 24527, 24069.


 Based on the data from the years 2002 - 2018 the average number of fires per year is 24. The highest number of reported fire incidents - 50 took place in 2014, and the least - 3 in 2002. The data has an increasing trend.
 When looking into fire subcategories, the most incidents belonged to: Outside Fires (45.0%), and Structure Fires (43.3%).