Estimated zip code population in 2022: 31,620
Zip code population in 2010: 32,170
Zip code population in 2000: 33,924
Houses and condos: 15,764
Renter-occupied apartments: 5,494
% of renters here:
40%State:
33%
March 2022 cost of living index in zip code 24540: 82.3
(low, U.S. average is 100)
Land area: 76.0
sq. mi.
Water area: 0.5
sq. mi.
Population density: 416 people per square mile (low).
OSM Map
General Map
Google Map
MSN Map
OSM Map
General Map
Google Map
MSN Map
OSM Map
General Map
Google Map
MSN Map
OSM Map
General Map
Google Map
MSN Map
Please wait while loading the map...
Real estate property taxes paid for housing units in 2022:
This zip code:
0.6% ($840)Virginia:
0.7% ($2,617)
Median real estate property taxes paid for housing units with mortgages in 2022: $864 (0.6%)
Median real estate property taxes paid for housing units with no mortgage in 2022: $836 (0.7%)
Profiles of local businesses
Business Search - 14 Million verified businesses
Males: 14,324 Females: 17,294
For population 25 years and over in 24540:
High school or higher: 85.5%Bachelor's degree or higher: 17.5%Graduate or professional degree: 5.2%Unemployed: 5.2%Mean travel time to work (commute): 20.5 minutes
For population 15 years and over in 24540:
Never married: 32.7%Now married: 41.5%Separated: 3.7%Widowed: 9.8%Divorced: 12.5%
Zip code 24540 compared to state average:
Median household income below state average. Median house value significantly below state average. Black race population percentage above state average. Hispanic race population percentage significantly below state average. Median age above state average. Foreign-born population percentage significantly below state average. Length of stay since moving in significantly above state average. Percentage of population with a bachelor's degree or higher significantly below state average. 15,979 50.5% White 12,841 40.6% Black 1,356 4.3% Two or more races 1,089 3.4% Hispanic or Latino 321 1.0% Asian 26 0.08% Some other race 6 0.02% American Indian
Data:
Median household income ($)
Median household income (% change since 2000)
Household income diversity
Ratio of average income to average house value (%)
Ratio of average income to average rent
Median household income ($) - White
Median household income ($) - Black or African American
Median household income ($) - Asian
Median household income ($) - Hispanic or Latino
Median household income ($) - American Indian and Alaska Native
Median household income ($) - Multirace
Median household income ($) - Other Race
Median household income for houses/condos with a mortgage ($)
Median household income for apartments without a mortgage ($)
Races - White alone (%)
Races - White alone (% change since 2000)
Races - Black alone (%)
Races - Black alone (% change since 2000)
Races - American Indian alone (%)
Races - American Indian alone (% change since 2000)
Races - Asian alone (%)
Races - Asian alone (% change since 2000)
Races - Hispanic (%)
Races - Hispanic (% change since 2000)
Races - Native Hawaiian and Other Pacific Islander alone (%)
Races - Native Hawaiian and Other Pacific Islander alone (% change since 2000)
Races - Two or more races (%)
Races - Two or more races (% change since 2000)
Races - Other race alone (%)
Races - Other race alone (% change since 2000)
Racial diversity
Unemployment (%)
Unemployment (% change since 2000)
Unemployment (%) - White
Unemployment (%) - Black or African American
Unemployment (%) - Asian
Unemployment (%) - Hispanic or Latino
Unemployment (%) - American Indian and Alaska Native
Unemployment (%) - Multirace
Unemployment (%) - Other Race
Population density (people per square mile)
Population - Males (%)
Population - Females (%)
Population - Males (%) - White
Population - Males (%) - Black or African American
Population - Males (%) - Asian
Population - Males (%) - Hispanic or Latino
Population - Males (%) - American Indian and Alaska Native
Population - Males (%) - Multirace
Population - Males (%) - Other Race
Population - Females (%) - White
Population - Females (%) - Black or African American
Population - Females (%) - Asian
Population - Females (%) - Hispanic or Latino
Population - Females (%) - American Indian and Alaska Native
Population - Females (%) - Multirace
Population - Females (%) - Other Race
Coronavirus confirmed cases (Apr 27, 2024)
Deaths caused by coronavirus (Apr 27, 2024)
Coronavirus confirmed cases (per 100k population) (Apr 27, 2024)
Deaths caused by coronavirus (per 100k population) (Apr 27, 2024)
Daily increase in number of cases (Apr 27, 2024)
Weekly increase in number of cases (Apr 27, 2024)
Cases doubled (in days) (Apr 27, 2024)
Hospitalized patients (Apr 18, 2022)
Negative test results (Apr 18, 2022)
Total test results (Apr 18, 2022)
COVID Vaccine doses distributed (per 100k population) (Sep 19, 2023)
COVID Vaccine doses administered (per 100k population) (Sep 19, 2023)
COVID Vaccine doses distributed (Sep 19, 2023)
COVID Vaccine doses administered (Sep 19, 2023)
Likely homosexual households (%)
Likely homosexual households (% change since 2000)
Likely homosexual households - Lesbian couples (%)
Likely homosexual households - Lesbian couples (% change since 2000)
Likely homosexual households - Gay men (%)
Likely homosexual households - Gay men (% change since 2000)
Cost of living index
Median gross rent ($)
Median contract rent ($)
Median monthly housing costs ($)
Median house or condo value ($)
Median house or condo value ($ change since 2000)
Mean house or condo value by units in structure - 1, detached ($)
Mean house or condo value by units in structure - 1, attached ($)
Mean house or condo value by units in structure - 2 ($)
Mean house or condo value by units in structure by units in structure - 3 or 4 ($)
Mean house or condo value by units in structure - 5 or more ($)
Mean house or condo value by units in structure - Boat, RV, van, etc. ($)
Mean house or condo value by units in structure - Mobile home ($)
Median house or condo value ($) - White
Median house or condo value ($) - Black or African American
Median house or condo value ($) - Asian
Median house or condo value ($) - Hispanic or Latino
Median house or condo value ($) - American Indian and Alaska Native
Median house or condo value ($) - Multirace
Median house or condo value ($) - Other Race
Median resident age
Resident age diversity
Median resident age - Males
Median resident age - Females
Median resident age - White
Median resident age - Black or African American
Median resident age - Asian
Median resident age - Hispanic or Latino
Median resident age - American Indian and Alaska Native
Median resident age - Multirace
Median resident age - Other Race
Median resident age - Males - White
Median resident age - Males - Black or African American
Median resident age - Males - Asian
Median resident age - Males - Hispanic or Latino
Median resident age - Males - American Indian and Alaska Native
Median resident age - Males - Multirace
Median resident age - Males - Other Race
Median resident age - Females - White
Median resident age - Females - Black or African American
Median resident age - Females - Asian
Median resident age - Females - Hispanic or Latino
Median resident age - Females - American Indian and Alaska Native
Median resident age - Females - Multirace
Median resident age - Females - Other Race
Commute - mean travel time to work (minutes)
Travel time to work - Less than 5 minutes (%)
Travel time to work - Less than 5 minutes (% change since 2000)
Travel time to work - 5 to 9 minutes (%)
Travel time to work - 5 to 9 minutes (% change since 2000)
Travel time to work - 10 to 19 minutes (%)
Travel time to work - 10 to 19 minutes (% change since 2000)
Travel time to work - 20 to 29 minutes (%)
Travel time to work - 20 to 29 minutes (% change since 2000)
Travel time to work - 30 to 39 minutes (%)
Travel time to work - 30 to 39 minutes (% change since 2000)
Travel time to work - 40 to 59 minutes (%)
Travel time to work - 40 to 59 minutes (% change since 2000)
Travel time to work - 60 to 89 minutes (%)
Travel time to work - 60 to 89 minutes (% change since 2000)
Travel time to work - 90 or more minutes (%)
Travel time to work - 90 or more minutes (% change since 2000)
Marital status - Never married (%)
Marital status - Now married (%)
Marital status - Separated (%)
Marital status - Widowed (%)
Marital status - Divorced (%)
Median family income ($)
Median family income (% change since 2000)
Median non-family income ($)
Median non-family income (% change since 2000)
Median per capita income ($)
Median per capita income (% change since 2000)
Median family income ($) - White
Median family income ($) - Black or African American
Median family income ($) - Asian
Median family income ($) - Hispanic or Latino
Median family income ($) - American Indian and Alaska Native
Median family income ($) - Multirace
Median family income ($) - Other Race
Median year house/condo built
Median year apartment built
Year house built - Built 2005 or later (%)
Year house built - Built 2000 to 2004 (%)
Year house built - Built 1990 to 1999 (%)
Year house built - Built 1980 to 1989 (%)
Year house built - Built 1970 to 1979 (%)
Year house built - Built 1960 to 1969 (%)
Year house built - Built 1950 to 1959 (%)
Year house built - Built 1940 to 1949 (%)
Year house built - Built 1939 or earlier (%)
Average household size
Household density (households per square mile)
Average household size - White
Average household size - Black or African American
Average household size - Asian
Average household size - Hispanic or Latino
Average household size - American Indian and Alaska Native
Average household size - Multirace
Average household size - Other Race
Occupied housing units (%)
Vacant housing units (%)
Owner occupied housing units (%)
Renter occupied housing units (%)
Vacancy status - For rent (%)
Vacancy status - For sale only (%)
Vacancy status - Rented or sold, not occupied (%)
Vacancy status - For seasonal, recreational, or occasional use (%)
Vacancy status - For migrant workers (%)
Vacancy status - Other vacant (%)
Residents with income below the poverty level (%)
Residents with income below 50% of the poverty level (%)
Children below poverty level (%)
Poor families by family type - Married-couple family (%)
Poor families by family type - Male, no wife present (%)
Poor families by family type - Female, no husband present (%)
Poverty status for native-born residents (%)
Poverty status for foreign-born residents (%)
Poverty among high school graduates not in families (%)
Poverty among people who did not graduate high school not in families (%)
Residents with income below the poverty level (%) - White
Residents with income below the poverty level (%) - Black or African American
Residents with income below the poverty level (%) - Asian
Residents with income below the poverty level (%) - Hispanic or Latino
Residents with income below the poverty level (%) - American Indian and Alaska Native
Residents with income below the poverty level (%) - Multirace
Residents with income below the poverty level (%) - Other Race
Air pollution - Air Quality Index (AQI)
Air pollution - CO
Air pollution - NO2
Air pollution - SO2
Air pollution - Ozone
Air pollution - PM10
Air pollution - PM25
Air pollution - Pb
Crime - Murders per 100,000 population
Crime - Rapes per 100,000 population
Crime - Robberies per 100,000 population
Crime - Assaults per 100,000 population
Crime - Burglaries per 100,000 population
Crime - Thefts per 100,000 population
Crime - Auto thefts per 100,000 population
Crime - Arson per 100,000 population
Crime - City-data.com crime index
Crime - Violent crime index
Crime - Property crime index
Crime - Murders per 100,000 population (5 year average)
Crime - Rapes per 100,000 population (5 year average)
Crime - Robberies per 100,000 population (5 year average)
Crime - Assaults per 100,000 population (5 year average)
Crime - Burglaries per 100,000 population (5 year average)
Crime - Thefts per 100,000 population (5 year average)
Crime - Auto thefts per 100,000 population (5 year average)
Crime - Arson per 100,000 population (5 year average)
Crime - City-data.com crime index (5 year average)
Crime - Violent crime index (5 year average)
Crime - Property crime index (5 year average)
1996 Presidential Elections Results (%) - Democratic Party (Clinton)
1996 Presidential Elections Results (%) - Republican Party (Dole)
1996 Presidential Elections Results (%) - Other
2000 Presidential Elections Results (%) - Democratic Party (Gore)
2000 Presidential Elections Results (%) - Republican Party (Bush)
2000 Presidential Elections Results (%) - Other
2004 Presidential Elections Results (%) - Democratic Party (Kerry)
2004 Presidential Elections Results (%) - Republican Party (Bush)
2004 Presidential Elections Results (%) - Other
2008 Presidential Elections Results (%) - Democratic Party (Obama)
2008 Presidential Elections Results (%) - Republican Party (McCain)
2008 Presidential Elections Results (%) - Other
2012 Presidential Elections Results (%) - Democratic Party (Obama)
2012 Presidential Elections Results (%) - Republican Party (Romney)
2012 Presidential Elections Results (%) - Other
2016 Presidential Elections Results (%) - Democratic Party (Clinton)
2016 Presidential Elections Results (%) - Republican Party (Trump)
2016 Presidential Elections Results (%) - Other
2020 Presidential Elections Results (%) - Democratic Party (Biden)
2020 Presidential Elections Results (%) - Republican Party (Trump)
2020 Presidential Elections Results (%) - Other
Ancestries Reported - Arab (%)
Ancestries Reported - Czech (%)
Ancestries Reported - Danish (%)
Ancestries Reported - Dutch (%)
Ancestries Reported - English (%)
Ancestries Reported - French (%)
Ancestries Reported - French Canadian (%)
Ancestries Reported - German (%)
Ancestries Reported - Greek (%)
Ancestries Reported - Hungarian (%)
Ancestries Reported - Irish (%)
Ancestries Reported - Italian (%)
Ancestries Reported - Lithuanian (%)
Ancestries Reported - Norwegian (%)
Ancestries Reported - Polish (%)
Ancestries Reported - Portuguese (%)
Ancestries Reported - Russian (%)
Ancestries Reported - Scotch-Irish (%)
Ancestries Reported - Scottish (%)
Ancestries Reported - Slovak (%)
Ancestries Reported - Subsaharan African (%)
Ancestries Reported - Swedish (%)
Ancestries Reported - Swiss (%)
Ancestries Reported - Ukrainian (%)
Ancestries Reported - United States (%)
Ancestries Reported - Welsh (%)
Ancestries Reported - West Indian (%)
Ancestries Reported - Other (%)
Educational Attainment - No schooling completed (%)
Educational Attainment - Less than high school (%)
Educational Attainment - High school or equivalent (%)
Educational Attainment - Less than 1 year of college (%)
Educational Attainment - 1 or more years of college (%)
Educational Attainment - Associate degree (%)
Educational Attainment - Bachelor's degree (%)
Educational Attainment - Master's degree (%)
Educational Attainment - Professional school degree (%)
Educational Attainment - Doctorate degree (%)
School Enrollment - Nursery, preschool (%)
School Enrollment - Kindergarten (%)
School Enrollment - Grade 1 to 4 (%)
School Enrollment - Grade 5 to 8 (%)
School Enrollment - Grade 9 to 12 (%)
School Enrollment - College undergrad (%)
School Enrollment - Graduate or professional (%)
School Enrollment - Not enrolled in school (%)
School enrollment - Public schools (%)
School enrollment - Private schools (%)
School enrollment - Not enrolled (%)
Median number of rooms in houses and condos
Median number of rooms in apartments
Housing units lacking complete plumbing facilities (%)
Housing units lacking complete kitchen facilities (%)
Density of houses
Urban houses (%)
Rural houses (%)
Households with people 60 years and over (%)
Households with people 65 years and over (%)
Households with people 75 years and over (%)
Households with one or more nonrelatives (%)
Households with no nonrelatives (%)
Population in households (%)
Family households (%)
Nonfamily households (%)
Population in families (%)
Family households with own children (%)
Median number of bedrooms in owner occupied houses
Mean number of bedrooms in owner occupied houses
Median number of bedrooms in renter occupied houses
Mean number of bedrooms in renter occupied houses
Median number of vehichles in owner occupied houses
Mean number of vehichles in owner occupied houses
Median number of vehichles in renter occupied houses
Mean number of vehichles in renter occupied houses
Mortgage status - with mortgage (%)
Mortgage status - with second mortgage (%)
Mortgage status - with home equity loan (%)
Mortgage status - with both second mortgage and home equity loan (%)
Mortgage status - without a mortgage (%)
Average family size
Average family size - White
Average family size - Black or African American
Average family size - Asian
Average family size - Hispanic or Latino
Average family size - American Indian and Alaska Native
Average family size - Multirace
Average family size - Other Race
Geographical mobility - Same house 1 year ago (%)
Geographical mobility - Moved within same county (%)
Geographical mobility - Moved from different county within same state (%)
Geographical mobility - Moved from different state (%)
Geographical mobility - Moved from abroad (%)
Place of birth - Born in state of residence (%)
Place of birth - Born in other state (%)
Place of birth - Native, outside of US (%)
Place of birth - Foreign born (%)
Housing units in structures - 1, detached (%)
Housing units in structures - 1, attached (%)
Housing units in structures - 2 (%)
Housing units in structures - 3 or 4 (%)
Housing units in structures - 5 to 9 (%)
Housing units in structures - 10 to 19 (%)
Housing units in structures - 20 to 49 (%)
Housing units in structures - 50 or more (%)
Housing units in structures - Mobile home (%)
Housing units in structures - Boat, RV, van, etc. (%)
House/condo owner moved in on average (years ago)
Renter moved in on average (years ago)
Year householder moved into unit - Moved in 1999 to March 2000 (%)
Year householder moved into unit - Moved in 1995 to 1998 (%)
Year householder moved into unit - Moved in 1990 to 1994 (%)
Year householder moved into unit - Moved in 1980 to 1989 (%)
Year householder moved into unit - Moved in 1970 to 1979 (%)
Year householder moved into unit - Moved in 1969 or earlier (%)
Means of transportation to work - Drove car alone (%)
Means of transportation to work - Carpooled (%)
Means of transportation to work - Public transportation (%)
Means of transportation to work - Bus or trolley bus (%)
Means of transportation to work - Streetcar or trolley car (%)
Means of transportation to work - Subway or elevated (%)
Means of transportation to work - Railroad (%)
Means of transportation to work - Ferryboat (%)
Means of transportation to work - Taxicab (%)
Means of transportation to work - Motorcycle (%)
Means of transportation to work - Bicycle (%)
Means of transportation to work - Walked (%)
Means of transportation to work - Other means (%)
Working at home (%)
Industry diversity
Most Common Industries - Agriculture, forestry, fishing and hunting, and mining (%)
Most Common Industries - Agriculture, forestry, fishing and hunting (%)
Most Common Industries - Mining, quarrying, and oil and gas extraction (%)
Most Common Industries - Construction (%)
Most Common Industries - Manufacturing (%)
Most Common Industries - Wholesale trade (%)
Most Common Industries - Retail trade (%)
Most Common Industries - Transportation and warehousing, and utilities (%)
Most Common Industries - Transportation and warehousing (%)
Most Common Industries - Utilities (%)
Most Common Industries - Information (%)
Most Common Industries - Finance and insurance, and real estate and rental and leasing (%)
Most Common Industries - Finance and insurance (%)
Most Common Industries - Real estate and rental and leasing (%)
Most Common Industries - Professional, scientific, and management, and administrative and waste management services (%)
Most Common Industries - Professional, scientific, and technical services (%)
Most Common Industries - Management of companies and enterprises (%)
Most Common Industries - Administrative and support and waste management services (%)
Most Common Industries - Educational services, and health care and social assistance (%)
Most Common Industries - Educational services (%)
Most Common Industries - Health care and social assistance (%)
Most Common Industries - Arts, entertainment, and recreation, and accommodation and food services (%)
Most Common Industries - Arts, entertainment, and recreation (%)
Most Common Industries - Accommodation and food services (%)
Most Common Industries - Other services, except public administration (%)
Most Common Industries - Public administration (%)
Occupation diversity
Most Common Occupations - Management, business, science, and arts occupations (%)
Most Common Occupations - Management, business, and financial occupations (%)
Most Common Occupations - Management occupations (%)
Most Common Occupations - Business and financial operations occupations (%)
Most Common Occupations - Computer, engineering, and science occupations (%)
Most Common Occupations - Computer and mathematical occupations (%)
Most Common Occupations - Architecture and engineering occupations (%)
Most Common Occupations - Life, physical, and social science occupations (%)
Most Common Occupations - Education, legal, community service, arts, and media occupations (%)
Most Common Occupations - Community and social service occupations (%)
Most Common Occupations - Legal occupations (%)
Most Common Occupations - Education, training, and library occupations (%)
Most Common Occupations - Arts, design, entertainment, sports, and media occupations (%)
Most Common Occupations - Healthcare practitioners and technical occupations (%)
Most Common Occupations - Health diagnosing and treating practitioners and other technical occupations (%)
Most Common Occupations - Health technologists and technicians (%)
Most Common Occupations - Service occupations (%)
Most Common Occupations - Healthcare support occupations (%)
Most Common Occupations - Protective service occupations (%)
Most Common Occupations - Fire fighting and prevention, and other protective service workers including supervisors (%)
Most Common Occupations - Law enforcement workers including supervisors (%)
Most Common Occupations - Food preparation and serving related occupations (%)
Most Common Occupations - Building and grounds cleaning and maintenance occupations (%)
Most Common Occupations - Personal care and service occupations (%)
Most Common Occupations - Sales and office occupations (%)
Most Common Occupations - Sales and related occupations (%)
Most Common Occupations - Office and administrative support occupations (%)
Most Common Occupations - Natural resources, construction, and maintenance occupations (%)
Most Common Occupations - Farming, fishing, and forestry occupations (%)
Most Common Occupations - Construction and extraction occupations (%)
Most Common Occupations - Installation, maintenance, and repair occupations (%)
Most Common Occupations - Production, transportation, and material moving occupations (%)
Most Common Occupations - Production occupations (%)
Most Common Occupations - Transportation occupations (%)
Most Common Occupations - Material moving occupations (%)
People in Group quarters - Institutionalized population (%)
People in Group quarters - Correctional institutions (%)
People in Group quarters - Federal prisons and detention centers (%)
People in Group quarters - Halfway houses (%)
People in Group quarters - Local jails and other confinement facilities (including police lockups) (%)
People in Group quarters - Military disciplinary barracks (%)
People in Group quarters - State prisons (%)
People in Group quarters - Other types of correctional institutions (%)
People in Group quarters - Nursing homes (%)
People in Group quarters - Hospitals/wards, hospices, and schools for the handicapped (%)
People in Group quarters - Hospitals/wards and hospices for chronically ill (%)
People in Group quarters - Hospices or homes for chronically ill (%)
People in Group quarters - Military hospitals or wards for chronically ill (%)
People in Group quarters - Other hospitals or wards for chronically ill (%)
People in Group quarters - Hospitals or wards for drug/alcohol abuse (%)
People in Group quarters - Mental (Psychiatric) hospitals or wards (%)
People in Group quarters - Schools, hospitals, or wards for the mentally retarded (%)
People in Group quarters - Schools, hospitals, or wards for the physically handicapped (%)
People in Group quarters - Institutions for the deaf (%)
People in Group quarters - Institutions for the blind (%)
People in Group quarters - Orthopedic wards and institutions for the physically handicapped (%)
People in Group quarters - Wards in general hospitals for patients who have no usual home elsewhere (%)
People in Group quarters - Wards in military hospitals for patients who have no usual home elsewhere (%)
People in Group quarters - Juvenile institutions (%)
People in Group quarters - Long-term care (%)
People in Group quarters - Homes for abused, dependent, and neglected children (%)
People in Group quarters - Residential treatment centers for emotionally disturbed children (%)
People in Group quarters - Training schools for juvenile delinquents (%)
People in Group quarters - Short-term care, detention or diagnostic centers for delinquent children (%)
People in Group quarters - Type of juvenile institution unknown (%)
People in Group quarters - Noninstitutionalized population (%)
People in Group quarters - College dormitories (includes college quarters off campus) (%)
People in Group quarters - Military quarters (%)
People in Group quarters - On base (%)
People in Group quarters - Barracks, unaccompanied personnel housing (UPH), (Enlisted/Officer), ;and similar group living quarters for military personnel (%)
People in Group quarters - Transient quarters for temporary residents (%)
People in Group quarters - Military ships (%)
People in Group quarters - Group homes (%)
People in Group quarters - Homes or halfway houses for drug/alcohol abuse (%)
People in Group quarters - Homes for the mentally ill (%)
People in Group quarters - Homes for the mentally retarded (%)
People in Group quarters - Homes for the physically handicapped (%)
People in Group quarters - Other group homes (%)
People in Group quarters - Religious group quarters (%)
People in Group quarters - Dormitories (%)
People in Group quarters - Agriculture workers' dormitories on farms (%)
People in Group quarters - Job Corps and vocational training facilities (%)
People in Group quarters - Other workers' dormitories (%)
People in Group quarters - Crews of maritime vessels (%)
People in Group quarters - Other nonhousehold living situations (%)
People in Group quarters - Other noninstitutional group quarters (%)
Residents speaking English at home (%)
Residents speaking English at home - Born in the United States (%)
Residents speaking English at home - Native, born elsewhere (%)
Residents speaking English at home - Foreign born (%)
Residents speaking Spanish at home (%)
Residents speaking Spanish at home - Born in the United States (%)
Residents speaking Spanish at home - Native, born elsewhere (%)
Residents speaking Spanish at home - Foreign born (%)
Residents speaking other language at home (%)
Residents speaking other language at home - Born in the United States (%)
Residents speaking other language at home - Native, born elsewhere (%)
Residents speaking other language at home - Foreign born (%)
Class of Workers - Employee of private company (%)
Class of Workers - Self-employed in own incorporated business (%)
Class of Workers - Private not-for-profit wage and salary workers (%)
Class of Workers - Local government workers (%)
Class of Workers - State government workers (%)
Class of Workers - Federal government workers (%)
Class of Workers - Self-employed workers in own not incorporated business and Unpaid family workers (%)
House heating fuel used in houses and condos - Utility gas (%)
House heating fuel used in houses and condos - Bottled, tank, or LP gas (%)
House heating fuel used in houses and condos - Electricity (%)
House heating fuel used in houses and condos - Fuel oil, kerosene, etc. (%)
House heating fuel used in houses and condos - Coal or coke (%)
House heating fuel used in houses and condos - Wood (%)
House heating fuel used in houses and condos - Solar energy (%)
House heating fuel used in houses and condos - Other fuel (%)
House heating fuel used in houses and condos - No fuel used (%)
House heating fuel used in apartments - Utility gas (%)
House heating fuel used in apartments - Bottled, tank, or LP gas (%)
House heating fuel used in apartments - Electricity (%)
House heating fuel used in apartments - Fuel oil, kerosene, etc. (%)
House heating fuel used in apartments - Coal or coke (%)
House heating fuel used in apartments - Wood (%)
House heating fuel used in apartments - Solar energy (%)
House heating fuel used in apartments - Other fuel (%)
House heating fuel used in apartments - No fuel used (%)
Armed forces status - In Armed Forces (%)
Armed forces status - Civilian (%)
Armed forces status - Civilian - Veteran (%)
Armed forces status - Civilian - Nonveteran (%)
Fatal accidents locations in years 2005-2021
Fatal accidents locations in 2005
Fatal accidents locations in 2006
Fatal accidents locations in 2007
Fatal accidents locations in 2008
Fatal accidents locations in 2009
Fatal accidents locations in 2010
Fatal accidents locations in 2011
Fatal accidents locations in 2012
Fatal accidents locations in 2013
Fatal accidents locations in 2014
Fatal accidents locations in 2015
Fatal accidents locations in 2016
Fatal accidents locations in 2017
Fatal accidents locations in 2018
Fatal accidents locations in 2019
Fatal accidents locations in 2020
Fatal accidents locations in 2021
Alcohol use - People drinking some alcohol every month (%)
Alcohol use - People not drinking at all (%)
Alcohol use - Average days/month drinking alcohol
Alcohol use - Average drinks/week
Alcohol use - Average days/year people drink much
Audiometry - Average condition of hearing (%)
Audiometry - People that can hear a whisper from across a quiet room (%)
Audiometry - People that can hear normal voice from across a quiet room (%)
Audiometry - Ears ringing, roaring, buzzing (%)
Audiometry - Had a job exposure to loud noise (%)
Audiometry - Had off-work exposure to loud noise (%)
Blood Pressure & Cholesterol - Has high blood pressure (%)
Blood Pressure & Cholesterol - Checking blood pressure at home (%)
Blood Pressure & Cholesterol - Frequently checking blood cholesterol (%)
Blood Pressure & Cholesterol - Has high cholesterol level (%)
Consumer Behavior - Money monthly spent on food at supermarket/grocery store
Consumer Behavior - Money monthly spent on food at other stores
Consumer Behavior - Money monthly spent on eating out
Consumer Behavior - Money monthly spent on carryout/delivered foods
Consumer Behavior - Income spent on food at supermarket/grocery store (%)
Consumer Behavior - Income spent on food at other stores (%)
Consumer Behavior - Income spent on eating out (%)
Consumer Behavior - Income spent on carryout/delivered foods (%)
Current Health Status - General health condition (%)
Current Health Status - Blood donors (%)
Current Health Status - Has blood ever tested for HIV virus (%)
Current Health Status - Left-handed people (%)
Dermatology - People using sunscreen (%)
Diabetes - Diabetics (%)
Diabetes - Had a blood test for high blood sugar (%)
Diabetes - People taking insulin (%)
Diet Behavior & Nutrition - Diet health (%)
Diet Behavior & Nutrition - Milk product consumption (# of products/month)
Diet Behavior & Nutrition - Meals not home prepared (#/week)
Diet Behavior & Nutrition - Meals from fast food or pizza place (#/week)
Diet Behavior & Nutrition - Ready-to-eat foods (#/month)
Diet Behavior & Nutrition - Frozen meals/pizza (#/month)
Drug Use - People that ever used marijuana or hashish (%)
Drug Use - Ever used hard drugs (%)
Drug Use - Ever used any form of cocaine (%)
Drug Use - Ever used heroin (%)
Drug Use - Ever used methamphetamine (%)
Health Insurance - People covered by health insurance (%)
Kidney Conditions-Urology - Avg. # of times urinating at night
Medical Conditions - People with asthma (%)
Medical Conditions - People with anemia (%)
Medical Conditions - People with psoriasis (%)
Medical Conditions - People with overweight (%)
Medical Conditions - Elderly people having difficulties in thinking or remembering (%)
Medical Conditions - People who ever received blood transfusion (%)
Medical Conditions - People having trouble seeing even with glass/contacts (%)
Medical Conditions - People with arthritis (%)
Medical Conditions - People with gout (%)
Medical Conditions - People with congestive heart failure (%)
Medical Conditions - People with coronary heart disease (%)
Medical Conditions - People with angina pectoris (%)
Medical Conditions - People who ever had heart attack (%)
Medical Conditions - People who ever had stroke (%)
Medical Conditions - People with emphysema (%)
Medical Conditions - People with thyroid problem (%)
Medical Conditions - People with chronic bronchitis (%)
Medical Conditions - People with any liver condition (%)
Medical Conditions - People who ever had cancer or malignancy (%)
Mental Health - People who have little interest in doing things (%)
Mental Health - People feeling down, depressed, or hopeless (%)
Mental Health - People who have trouble sleeping or sleeping too much (%)
Mental Health - People feeling tired or having little energy (%)
Mental Health - People with poor appetite or overeating (%)
Mental Health - People feeling bad about themself (%)
Mental Health - People who have trouble concentrating on things (%)
Mental Health - People moving or speaking slowly or too fast (%)
Mental Health - People having thoughts they would be better off dead (%)
Oral Health - Average years since last visit a dentist
Oral Health - People embarrassed because of mouth (%)
Oral Health - People with gum disease (%)
Oral Health - General health of teeth and gums (%)
Oral Health - Average days a week using dental floss/device
Oral Health - Average days a week using mouthwash for dental problem
Oral Health - Average number of teeth
Pesticide Use - Households using pesticides to control insects (%)
Pesticide Use - Households using pesticides to kill weeds (%)
Physical Activity - People doing vigorous-intensity work activities (%)
Physical Activity - People doing moderate-intensity work activities (%)
Physical Activity - People walking or bicycling (%)
Physical Activity - People doing vigorous-intensity recreational activities (%)
Physical Activity - People doing moderate-intensity recreational activities (%)
Physical Activity - Average hours a day doing sedentary activities
Physical Activity - Average hours a day watching TV or videos
Physical Activity - Average hours a day using computer
Physical Functioning - People having limitations keeping them from working (%)
Physical Functioning - People limited in amount of work they can do (%)
Physical Functioning - People that need special equipment to walk (%)
Physical Functioning - People experiencing confusion/memory problems (%)
Physical Functioning - People requiring special healthcare equipment (%)
Prescription Medications - Average number of prescription medicines taking
Preventive Aspirin Use - Adults 40+ taking low-dose aspirin (%)
Reproductive Health - Vaginal deliveries (%)
Reproductive Health - Cesarean deliveries (%)
Reproductive Health - Deliveries resulted in a live birth (%)
Reproductive Health - Pregnancies resulted in a delivery (%)
Reproductive Health - Women breastfeeding newborns (%)
Reproductive Health - Women that had a hysterectomy (%)
Reproductive Health - Women that had both ovaries removed (%)
Reproductive Health - Women that have ever taken birth control pills (%)
Reproductive Health - Women taking birth control pills (%)
Reproductive Health - Women that have ever used Depo-Provera or injectables (%)
Reproductive Health - Women that have ever used female hormones (%)
Sexual Behavior - People 18+ that ever had sex (vaginal, anal, or oral) (%)
Sexual Behavior - Males 18+ that ever had vaginal sex with a woman (%)
Sexual Behavior - Males 18+ that ever performed oral sex on a woman (%)
Sexual Behavior - Males 18+ that ever had anal sex with a woman (%)
Sexual Behavior - Males 18+ that ever had any sex with a man (%)
Sexual Behavior - Females 18+ that ever had vaginal sex with a man (%)
Sexual Behavior - Females 18+ that ever performed oral sex on a man (%)
Sexual Behavior - Females 18+ that ever had anal sex with a man (%)
Sexual Behavior - Females 18+ that ever had any kind of sex with a woman (%)
Sexual Behavior - Average age people first had sex
Sexual Behavior - Average number of female sex partners in lifetime (males 18+)
Sexual Behavior - Average number of female vaginal sex partners in lifetime (males 18+)
Sexual Behavior - Average age people first performed oral sex on a woman (18+)
Sexual Behavior - Average number of woman performed oral sex on in lifetime (18+)
Sexual Behavior - Average number of male sex partners in lifetime (males 18+)
Sexual Behavior - Average number of male anal sex partners in lifetime (males 18+)
Sexual Behavior - Average age people first performed oral sex on a man (18+)
Sexual Behavior - Average number of male oral sex partners in lifetime (18+)
Sexual Behavior - People using protection when performing oral sex (%)
Sexual Behavior - Average number of times people have vaginal or anal sex a year
Sexual Behavior - People having sex without condom (%)
Sexual Behavior - Average number of male sex partners in lifetime (females 18+)
Sexual Behavior - Average number of male vaginal sex partners in lifetime (females 18+)
Sexual Behavior - Average number of female sex partners in lifetime (females 18+)
Sexual Behavior - Circumcised males 18+ (%)
Sleep Disorders - Average hours sleeping at night
Sleep Disorders - People that has trouble sleeping (%)
Smoking-Cigarette Use - People smoking cigarettes (%)
Taste & Smell - People 40+ having problems with smell (%)
Taste & Smell - People 40+ having problems with taste (%)
Taste & Smell - People 40+ that ever had wisdom teeth removed (%)
Taste & Smell - People 40+ that ever had tonsils teeth removed (%)
Taste & Smell - People 40+ that ever had a loss of consciousness because of a head injury (%)
Taste & Smell - People 40+ that ever had a broken nose or other serious injury to face or skull (%)
Taste & Smell - People 40+ that ever had two or more sinus infections (%)
Weight - Average height (inches)
Weight - Average weight (pounds)
Weight - Average BMI
Weight - People that are obese (%)
Weight - People that ever were obese (%)
Weight - People trying to lose weight (%)
Urban population: 24,320
Rural population: 7,299
Estimated median house/condo value in 2022: $137,756
24540:
$137,756Virginia:
$365,700
Median resident age: This zip code:
44.8 yearsVirginia median age:
39.0 years
Average household size: This zip code:
2.3 peopleVirginia:
2.5 people
Averages for the 2020 tax year for zip code 24540, filed in 2021:
Average Adjusted Gross Income (AGI) in 2020: $42,944 (Individual Income Tax Returns) Here:
$42,944State:
$86,446
Salary/wage: $36,498 (reported on 84.1% of returns )Here:
$36,498State:
$71,185
(% of AGI for various income ranges: 1195.4% for AGIs below $25k , 3461.0% for AGIs $25k-50k , 6344.5% for AGIs $50k-75k , 9033.8% for AGIs $75k-100k , 14391.9% for AGIs $100k-200k , 55702.0% for AGIs over 200k ) Taxable interest for individuals: $1,257 (reported on 21.5% of returns )This zip code:
$1,257Virginia:
$1,805
(% of AGI for various income ranges: 8.9% for AGIs below $25k , 18.3% for AGIs $25k-50k , 36.1% for AGIs $50k-75k , 76.6% for AGIs $75k-100k , 161.3% for AGIs $100k-200k , 1496.0% for AGIs over 200k ) Ordinary dividends: $4,150 (reported on 11.2% of returns )(% of AGI for various income ranges: 11.1% for AGIs below $25k , 26.7% for AGIs $25k-50k , 77.8% for AGIs $50k-75k , 139.3% for AGIs $75k-100k , 327.5% for AGIs $100k-200k , 2194.0% for AGIs over 200k ) Net capital gain/loss in AGI: +$7,153 (reported on 9.5% of returns )Here:
+$7,153State:
+$24,644
(% of AGI for various income ranges: 6.4% for AGIs below $25k , 13.4% for AGIs $25k-50k , 62.7% for AGIs $50k-75k , 147.6% for AGIs $75k-100k , 537.8% for AGIs $100k-200k , 6964.0% for AGIs over 200k ) Profit/loss from business: +$4,676 (reported on 13.9% of returns )Here:
+$4,676State:
+$12,836
(% of AGI for various income ranges: 60.0% for AGIs below $25k , 33.9% for AGIs $25k-50k , 76.3% for AGIs $50k-75k , 94.4% for AGIs $75k-100k , 327.1% for AGIs $100k-200k , 2756.0% for AGIs over 200k ) Taxable individual retirement arrangement distribution: $15,181 (reported on 8.4% of returns )24540:
$15,181Virginia:
$21,535
(% of AGI for various income ranges: 38.9% for AGIs below $25k , 92.0% for AGIs $25k-50k , 259.8% for AGIs $50k-75k , 408.4% for AGIs $75k-100k , 786.7% for AGIs $100k-200k , 3856.0% for AGIs over 200k ) Total itemized deductions: $30,292 (reported on 5.4% of returns )Here:
$30,292State:
$33,287
(% of AGI for various income ranges: 25.2% for AGIs below $25k , 114.4% for AGIs $25k-50k , 378.3% for AGIs $50k-75k , 520.9% for AGIs $75k-100k , 1083.2% for AGIs $100k-200k , 5834.0% for AGIs over 200k ) Charity contributions: $14,037 (reported on 4.9% of returns )Here:
$14,037State:
$10,381
(% of AGI for various income ranges: 5.7% for AGIs below $25k , 42.0% for AGIs $25k-50k , 149.2% for AGIs $50k-75k , 244.6% for AGIs $75k-100k , 429.0% for AGIs $100k-200k , 3246.0% for AGIs over 200k ) Taxes paid: $5,382 (reported on 5.4% of returns )(% of AGI for various income ranges: 2.0% for AGIs below $25k , 13.7% for AGIs $25k-50k , 53.2% for AGIs $50k-75k , 96.3% for AGIs $75k-100k , 235.6% for AGIs $100k-200k , 1334.0% for AGIs over 200k ) Earned income credit: $2,506 (reported on 27.6% of returns )(% of AGI for various income ranges: 144.0% for AGIs below $25k , 81.9% for AGIs $25k-50k , 0.8% for AGIs $50k-75k ) Percentage of individuals using paid preparers for their 2020 taxes: 93.8%(% for various income ranges: 93.4% for AGIs below $25k , 94.6% for AGIs $25k-50k , 93.6% for AGIs $50k-75k , 93.9% for AGIs $75k-100k , 93.1% for AGIs $100k-200k , 100.0% for AGIs over 200k )
Averages for the 2012 tax year for zip code 24540, filed in 2013:
Average Adjusted Gross Income (AGI) in 2012: $37,588 (Individual Income Tax Returns) Here:
$37,588State:
$71,192
Salary/wage: $33,001 (reported on 85.5% of returns )Here:
$33,001State:
$59,229
(% of AGI for various income ranges: 78.0% for AGIs below $25k , 79.9% for AGIs $25k-50k , 76.9% for AGIs $50k-75k , 75.3% for AGIs $75k-100k , 73.9% for AGIs $100k-200k , 48.1% for AGIs over 200k ) Taxable interest for individuals: $1,374 (reported on 25.9% of returns )This zip code:
$1,374Virginia:
$1,600
(% of AGI for various income ranges: 0.9% for AGIs below $25k , 0.9% for AGIs $25k-50k , 0.8% for AGIs $50k-75k , 0.8% for AGIs $75k-100k , 0.9% for AGIs $100k-200k , 2.2% for AGIs over 200k ) Ordinary dividends: $2,940 (reported on 12.7% of returns )(% of AGI for various income ranges: 0.8% for AGIs below $25k , 0.7% for AGIs $25k-50k , 0.8% for AGIs $50k-75k , 1.0% for AGIs $75k-100k , 1.2% for AGIs $100k-200k , 2.8% for AGIs over 200k ) Net capital gain/loss in AGI: +$6,941 (reported on 8.7% of returns )Here:
+$6,941State:
+$16,672
(% of AGI for various income ranges: 0.2% for AGIs $25k-50k , 0.4% for AGIs $50k-75k , 0.7% for AGIs $75k-100k , 1.6% for AGIs $100k-200k , 16.5% for AGIs over 200k ) Profit/loss from business: +$6,529 (reported on 11.6% of returns )Here:
+$6,529State:
+$14,116
(% of AGI for various income ranges: 6.2% for AGIs below $25k , 1.0% for AGIs $25k-50k , 1.0% for AGIs $50k-75k , 0.1% for AGIs $75k-100k , 3.0% for AGIs $100k-200k ) Taxable individual retirement arrangement distribution: $11,081 (reported on 9.0% of returns )24540:
$11,081Virginia:
$16,667
(% of AGI for various income ranges: 2.2% for AGIs below $25k , 2.5% for AGIs $25k-50k , 2.4% for AGIs $50k-75k , 3.0% for AGIs $75k-100k , 4.2% for AGIs $100k-200k ) Total itemized deductions: $18,562 (24% of AGI, reported on 20.5% of returns )Here:
$18,562State:
$26,596
Here:
23.6% of AGIState:
20.1% of AGI
(% of AGI for various income ranges: 4.5% for AGIs below $25k , 8.2% for AGIs $25k-50k , 10.9% for AGIs $50k-75k , 13.3% for AGIs $75k-100k , 13.8% for AGIs $100k-200k , 12.2% for AGIs over 200k ) Charity contributions: $5,357 (reported on 18.3% of returns )(% of AGI for various income ranges: 0.8% for AGIs below $25k , 1.9% for AGIs $25k-50k , 2.9% for AGIs $50k-75k , 3.5% for AGIs $75k-100k , 3.8% for AGIs $100k-200k , 3.6% for AGIs over 200k ) Taxes paid: $5,078 (reported on 20.4% of returns )(% of AGI for various income ranges: 0.6% for AGIs below $25k , 1.4% for AGIs $25k-50k , 2.5% for AGIs $50k-75k , 3.7% for AGIs $75k-100k , 4.8% for AGIs $100k-200k , 6.4% for AGIs over 200k ) Earned income credit: $2,465 (reported on 30.9% of returns )(% of AGI for various income ranges: 10.0% for AGIs below $25k , 1.4% for AGIs $25k-50k ) Percentage of individuals using paid preparers for their 2012 taxes: 54.0%(% for various income ranges: 48.7% for AGIs below $25k , 55.1% for AGIs $25k-50k , 62.7% for AGIs $50k-75k , 63.4% for AGIs $75k-100k , 63.8% for AGIs $100k-200k , 88.9% for AGIs over 200k )
Averages for the 2004 tax year for zip code 24540, filed in 2005:
Average Adjusted Gross Income (AGI) in 2004: $32,944 (Individual Income Tax Returns) Here:
$32,944State:
$56,704
Salary/wage: $29,686 (reported on 87.5% of returns )Here:
$29,686State:
$48,441
(% of AGI for various income ranges: 88.6% for AGIs below $10k , 80.0% for AGIs $10k-25k , 81.8% for AGIs $25k-50k , 83.2% for AGIs $50k-75k , 82.6% for AGIs $75k-100k , 62.4% for AGIs over 100k ) Taxable interest for individuals: $1,384 (reported on 35.7% of returns )This zip code:
$1,384Virginia:
$1,688
(% of AGI for various income ranges: 3.6% for AGIs below $10k , 2.1% for AGIs $10k-25k , 1.5% for AGIs $25k-50k , 1.1% for AGIs $50k-75k , 1.0% for AGIs $75k-100k , 1.5% for AGIs over 100k ) Taxable dividends: $2,100 (reported on 15.8% of returns )(% of AGI for various income ranges: 1.4% for AGIs below $10k , 0.9% for AGIs $10k-25k , 0.9% for AGIs $25k-50k , 0.8% for AGIs $50k-75k , 0.9% for AGIs $75k-100k , 1.6% for AGIs over 100k ) Net capital gain/loss: +$5,526 (reported on 11.5% of returns )Here:
+$5,526State:
+$14,375
(% of AGI for various income ranges: -0.5% for AGIs below $10k , 0.3% for AGIs $10k-25k , 0.5% for AGIs $25k-50k , 0.8% for AGIs $50k-75k , 0.7% for AGIs $75k-100k , 8.7% for AGIs over 100k ) Profit/loss from business: +$6,213 (reported on 10.3% of returns )Here:
+$6,213State:
+$13,342
(% of AGI for various income ranges: 2.9% for AGIs below $10k , 2.5% for AGIs $10k-25k , 1.3% for AGIs $25k-50k , 0.9% for AGIs $50k-75k , 0.9% for AGIs $75k-100k , 4.6% for AGIs over 100k ) IRA payment deduction: $2,917 (reported on 1.9% of returns )24540:
$2,917Virginia:
$2,943
(% of AGI for various income ranges: 0.2% for AGIs $10k-25k , 0.2% for AGIs $25k-50k , 0.1% for AGIs $50k-75k , 0.1% for AGIs $75k-100k , 0.2% for AGIs over 100k ) Self-employed pension: $13,565 (reported on 0.2% of returns )Here:
$13,565Virginia:
$17,430
Total itemized deductions: $15,313 (22% of AGI, reported on 22.9% of returns )Here:
$15,313State:
$21,492
Here:
22.5% of AGIState:
21.0% of AGI
(% of AGI for various income ranges: 3.8% for AGIs below $10k , 5.6% for AGIs $10k-25k , 9.3% for AGIs $25k-50k , 12.2% for AGIs $50k-75k , 14.6% for AGIs $75k-100k , 13.1% for AGIs over 100k ) Charity contributions deductions: $4,183 (6% of AGI, reported on 21.1% of returns )Here:
6.0% of AGIState:
3.5% of AGI
(% of AGI for various income ranges: 0.5% for AGIs below $10k , 1.0% for AGIs $10k-25k , 2.3% for AGIs $25k-50k , 3.2% for AGIs $50k-75k , 3.8% for AGIs $75k-100k , 3.7% for AGIs over 100k ) Total tax: $4,279 (reported on 65.9% of returns )(% of AGI for various income ranges: 1.7% for AGIs below $10k , 3.1% for AGIs $10k-25k , 6.4% for AGIs $25k-50k , 8.6% for AGIs $50k-75k , 10.3% for AGIs $75k-100k , 16.7% for AGIs over 100k ) Earned income credit: $1,902 (reported on 27.3% of returns )Percentage of individuals using paid preparers for their 2004 taxes: 62.7%(% for various income ranges: 55.6% for AGIs below $10k , 64.7% for AGIs $10k-25k , 63.6% for AGIs $25k-50k , 65.8% for AGIs $50k-75k , 64.2% for AGIs $75k-100k , 71.0% for AGIs over 100k )
Estimated median household income in 2022: This zip code:
$43,757Virginia:
$85,873
Nearest zip codes: 24541 ,
24549 ,
27315 ,
24527 ,
24586 ,
27311 .
Danville Zip Code Map
Percentage of family households: This zip code:
38.7%Virginia:
45.8%
Percentage of households with unmarried partners: This zip code:
5.8%Virginia:
48.6%
Likely homosexual households (counted as self-reported same-sex unmarried-partner households)
Lesbian couples: 0.0% of all households Gay men: 0.1% of all households
Household received Food Stamps/SNAP in the past 12 months: 3,200Household did not receive Food Stamps/SNAP in the past 12 months: 10,813
Women who had a birth in the past 12 months: 256 (139 now married , 112 unmarried) Women who did not have a birth in the past 12 months: 6,492 (2,149 now married , 4,368 unmarried)
Housing units in zip code 24540 with a mortgage: 4,065 (430
second mortgage , 1
home equity loan , 367
both second mortgage and home equity loan )
Houses without a mortgage: 86
Median monthly owner costs for units with a mortgage: $1,072
Median monthly owner costs for units without a mortgage: $382
Residents with income below the poverty level in 2022:
This zip code:
22.8%Whole state:
10.6%
Residents with income below 50% of the poverty level in 2022:
This zip code:
13.1%Whole state:
5.2%
Median number of rooms in houses and condos: Median number of rooms in apartments: Notable locations in this zip code not listed on our city pages
Click to draw/clear zip code borders Notable locations in zip code 24540: (A) , Northside Wastewater Treatment Plant (B) , Danville Industrial Development Area (C) , Fall (D) , Tuscarora Country Club (E) , Fire Station Number 5 (F) , Fire Station Number 2 (G) , Tunstall Volunteer Fire and Rescue Department (H) , Mount Hermon Volunteer Fire Department and Rescue Squad (I) , Mount Cross Volunteer Fire Department and Rescue Squad (J) . Display/hide their locations on the map
Shopping Centers: (1) , The Market Square Shopping Center (2) , Kings Fairground Shopping Center (3) , Nor-Dan Shopping Center (4) , North Danville Shopping Center (5) , Piedmont Mall Shopping Center (6) , Piney Forest Shopping Center (7) , Sherwood Shopping Center (8) . Display/hide their locations on the map
Churches in zip code 24540 include: (A) , Saint Johns Church (B) , Saint Matthews Church (C) , Silver Creek Church (D) , Christ Church (E) , East New Hope Baptist Church (F) , Fleemon Church (G) , Floral Hill Church (H) , Wesley Chapel (I) . Display/hide their locations on the map
Cemeteries: (1) , Cunningham Cemetery (2) , Highland Burial Park (3) , Leemont Cemetery (4) . Display/hide their locations on the map
Reservoirs: (A) , Riverside Reservoir (B) . Display/hide their locations on the map
Streams, rivers, and creeks: (A) , Sugartree Creek (B) , Silver Creek (C) , Long Branch (D) , Little Stewart Creek (E) , Lawless Creek (F) , Hardys Creek (G) , Fall Creek (H) , Edwards Branch (I) . Display/hide their locations on the map
Parks in zip code 24540 include: (1) , Stonewall Jackson Park (2) . Display/hide their locations on the map
Year house built (houses)
11 2020 or later446 2010 to 2019845 2000 to 20091,851 1990 to 19992,132 1980 to 19892,638 1970 to 19792,162 1960 to 19692,835 1950 to 19591,102 1940 to 19491,240 1939 or earlier
Zip code 24540 household income distribution in 2022 1,266 Less than $10,0001,134 $10,000 to $14,999882 $15,000 to $19,999820 $20,000 to $24,999812 $25,000 to $29,999798 $30,000 to $34,999750 $35,000 to $39,999679 $40,000 to $44,999559 $45,000 to $49,999867 $50,000 to $59,9991,595 $60,000 to $74,9991,268 $75,000 to $99,999848 $100,000 to $124,999718 $125,000 to $149,999420 $150,000 to $199,999409 $200,000 or moreEstimate of home value of owner-occupied houses/condos in 2022 in zip code 24540 213 Less than $10,000141 $10,000 to $14,99946 $15,000 to $19,99957 $20,000 to $24,999144 $25,000 to $29,99961 $30,000 to $34,99970 $35,000 to $39,999296 $40,000 to $49,999272 $50,000 to $59,999316 $60,000 to $69,999445 $70,000 to $79,999488 $80,000 to $89,999281 $90,000 to $99,999938 $100,000 to $124,999518 $125,000 to $149,999715 $150,000 to $174,999343 $175,000 to $199,999872 $200,000 to $249,999426 $250,000 to $299,999459 $300,000 to $399,99988 $400,000 to $499,999155 $500,000 to $749,99931 $750,000 to $999,99929 $1,000,000 to $1,499,99930 $2,000,000 or moreRent paid by renters in 2022 in zip code 24540 124 Less than $10045 $100 to $149129 $150 to $199188 $200 to $24933 $250 to $299314 $300 to $349264 $350 to $399376 $400 to $449601 $450 to $499708 $500 to $549394 $550 to $599312 $600 to $649470 $650 to $699294 $700 to $749399 $750 to $799182 $800 to $89960 $900 to $999195 $1,000 to $1,249117 $1,250 to $1,499220 No cash rent
Median gross rent in 2022: $783.
Median price asked for vacant for-sale houses and condos in 2022: $127,344.
Estimated median house (or condo) value in 2022 for: White Non-Hispanic householders: $152,000Black or African American householders: $119,576American Indian or Alaska Native householders: $121,263Asian householders: $244,025Some other race householders: $178,052Two or more races householders: $174,491Hispanic or Latino householders: $178,052Estimated median house or condo value in 2022: $137,756
24540:
$137,756Virginia:
$365,700
Lower value quartile - upper value quartile: $86,990 - $222,710
Mean price in 2022: Detached houses: $205,530Here:
$205,530State:
$472,865
Townhouses or other attached units: $204,166Here:
$204,166State:
$457,437
In 2-unit structures: $327,598Here:
$327,598State:
$396,289
In 3-to-4-unit structures: $523,056Here:
$523,056State:
$252,346
In 5-or-more-unit structures: $279,498Here:
$279,498State:
$382,551
Mobile homes: $17,617Here:
$17,617State:
$100,736
Housing units in structures:
One, detached: 11,423One, attached: 186Two: 2363 or 4: 5355 to 9: 62710 to 19: 1,11620 to 49: 44350 or more: 205Mobile homes: 913Unemployment : 5.2%
Means of transportation to work in zip code 24540 78.5% 10,339 Drove a car alone8.3% 1,098 Carpooled0.7% 98 Bus or trolley bus0.0% 1 Streetcar or trolley car0.1% 8 Taxi1.1% 150 Walked1.7% 227 Other means7.2% 954 Worked at homeTravel time to work (commute) in zip code 24540 445 Less than 5 minutes901 5 to 9 minutes2,453 10 to 14 minutes2,966 15 to 19 minutes2,348 20 to 24 minutes539 25 to 29 minutes854 30 to 34 minutes106 35 to 39 minutes208 40 to 44 minutes326 45 to 59 minutes477 60 to 89 minutes196 90 or more minutes
Percentage of zip code residents living and working in this county: 53.3%
Household type by relationship:
Households: 31,620
Male householders: 5,700 (1,786 living alone ), Female householders: 8,029 (2,893 living alone )4,830 spouses (4,798 opposite-sex spouses ), 741 unmarried partners , (741 opposite-sex unmarried partners ), 8,752 children (8,219 natural , 55 adopted , 491 stepchildren ), 1,167 grandchildren , 170 brothers or sisters , 273 parents , 7 foster children , 509 other relatives , 683 non-relatives In group quarters: 744 (-1 institutionalized population )
Size of family households: 4,552 2-persons , 1,624 3-persons , 1,112 4-persons , 493 5-persons , 267 6-persons , 126 7-or-more-persons
Size of nonfamily households: 4,680 1-person , 825 2-persons , 51 3-persons , 19 4-persons , 5 5-persons
2,463 married couples with children. single-parent households (494 men , 2,517 women ).
96.2% of residents of 24540 zip code speak English at home. of residents speak Spanish at home (65% very well, 10% well, 16% not well, 10% not at all ).of residents speak other Indo-European language at home (20% very well, 25% well, 55% not well ).of residents speak Asian or Pacific Island language at home (47% very well, 46% well, 7% not well ).of residents speak other language at home (72% very well, 28% well ).
Foreign born population: 751 (2.4%)
(51.1%
of them are naturalized citizens )
This zip code:
2.4%Whole state:
12.7%
27% Honduras 19% Guatemala 10% Malaysia 9% Nicaragua 8% Vietnam 5% Thailand 4% Costa Rica 19% American 12% English 6% African 2% Irish 2% German 1% European 1% Italian
Year of entry for the foreign-born population
360 2010 or later 190 2000 to 2009 118 1990 to 1999 159 Before 1990
There are
153 Medical Specialists in Zip Code 24540 .
Facilities with environmental interests located in this zip code:
CARRIAGE HILL MOBILE HOME COURT (CARRIAGE HILL LANE in DANVILLE, VA)
(Integrated Compliance Information System) - ICIS-03-2000-0550, FORMAL ENFORCEMENT ACTION Business SIC classification: RECREATIONAL VEHICLE PARKS AND CAMPSITES
CENTECH SERVICE CORP (2020F RIVERSIDE DR in DANVILLE, VA)
(Resource Conservation and Recovery Act (tracking hazardous waste))
ADKINS BROS INC (952 MT CROSS RD in DANVILLE, VA)
Conditionally Exempt Small Quantity Generators, less than 100 kg/month of hazardous waste (Resource Conservation and Recovery Act (tracking hazardous waste)) - notification Organizations: ADKINS RONALD L (CONTACT/OWNER)
APAC-VIRGINIA INC - THOMPSON-ARTHUR DIV (239 EASTWOOD DRIVE in DANVILLE, VA)
Conditionally Exempt Small Quantity Generators, less than 100 kg/month of hazardous waste (Resource Conservation and Recovery Act (tracking hazardous waste)) Organizations: APAC-VIRGINIA INC / DANVILLE (CONTACT/OWNER)
Alternative names: APAC-VIRGINIA INC / DANVILLE
CLEANER WORLD A NO 198 (1376 PINEY FOREST RD in DANVILLE, VA)
Small Quantity Generators, between 100 kg and 1000 kg of hazardous waste/month (Resource Conservation and Recovery Act (tracking hazardous waste)) - notification Organizations: CRAWLEY J T (CONTACT/OWNER)
Housing units lacking complete plumbing facilities: 3.9%
Housing units lacking complete kitchen facilities: 4.6%
67.6% Electricity 22.7% Utility gas 4.9% Bottled, tank, or LP gas 3.5% Fuel oil, kerosene, etc. 0.7% Wood
Population in 1990: 32,061. Population change in the 1990s: +1,863 (+5.8%).
Place of birth for U.S.-born residents:
This state: 23,112Northeast: 1,736Midwest: 741South: 4,590West: 444
63% of the 24540 zip code residents lived in the same house 5 years ago.
Out of people who lived in different houses, 41% lived in this county.
Out of people who lived in different counties, 50% lived in Virginia.
92% of the 24540 zip code residents lived in the same house 1 year ago.
Out of people who lived in different houses, 40% moved from this county.
Out of people who lived in different houses, 40% moved from different county within same state.
Out of people who lived in different houses, 19% moved from different state.
Out of people who lived in different houses, 2% moved from abroad.
Private vs. public school enrollment:
Students in private schools in grades 1 to 8 (elementary and middle school): 259
Students in private schools in grades 9 to 12 (high school): 157
Students in private undergraduate colleges: 264
Occupation by median earnings in the past 12 months ($)
64,784 Business and financial operations occupations 63,791 Arts, design, entertainment, sports, and media occupations 62,498 Health diagnosing and treating practitioners and other technical occupations 58,376 Computer and mathematical occupations 56,782 Transportation occupations 47,611 Education, training, and library occupations
Companies with federal contracts located in this zip code (DANVILLE, VA):
INTERTAPE POLYMER CORP (1101 EAGLE SPRINGS RD; small business) in 34 contracts from 2005 to 2006
Contracts for Packaging and Packing Bulk Materials, Specialized Shipping and Storage Containers by Defense Logistics AgencySigned by year: 2000: $0; 2001: $0; 2002: $0; 2003: $0; 2004: $0; 2005: $224,886; 2006: $199,441.
Biggest contracts: with Defense Logistics Agency for Packaging and Packing Bulk Materials. Signed on 2006-03-10. Completion date: 2006-03-28.
, same as above. Signed on 2005-11-16. Completion date: 2005-12-07.
, same as above. Signed on 2005-10-21. Completion date: 2005-11-14.
, same as above. Signed on 2006-05-17. Completion date: 2006-06-08.
MASTER GAGE & TOOL CO (112 MAPLEWOOD ST; small business) in 3 contracts in 2004
$10,150 with Navy for Maintenance, Repair and Rebuilding of Equipment -- Measuring Tools. Signed on 2004-12-23. Completion date: 2005-01-20.
with Navy for Measuring Tools, Craftsmen's. Signed on 2004-10-26. Completion date: 2004-11-02.
, same as above. Signed on 2004-02-24. Completion date: 2004-03-04.
ELECTRONIC DEVELOPMENT LABS, I (244 OAKLAND DRIVE; small business) in 5 contracts from 2004 to 2006
Contracts for Pressure, Temperature, and Humidity Measuring and Controlling Instruments by Defense Logistics AgencySigned by year: 2000: $0; 2001: $0; 2002: $0; 2003: $0; 2004: $3,670; 2005: $9,176; 2006: $2,753.
Biggest contracts: with Defense Logistics Agency for Pressure, Temperature, and Humidity Measuring and Controlling Instruments. Signed on 2005-11-03. Completion date: 2005-12-09.
, same as above. Signed on 2004-12-29. Completion date: 2005-01-30.
, same as above. Signed on 2006-05-20. Completion date: 2006-07-23.
, same as above. Signed on 2005-06-03. Completion date: 2005-07-06.
DEWBERRY & DAVIS LLC (551 PINEY FOREST RD) in 2 contracts in 2003
$0 with Navy for Other Architect and Engineering Services. Signed on 2003-08-14. Completion date: 2003-08-14.
, same as above. Signed on 2003-08-14. Completion date: 2003-08-14.
Top industries in this zip code by the number of employees in 2005:
Health Care and Social Assistance: Nursing Care Facilities (250-499 employees: 1 establishment, 100-249 employees: 2 establishments, 20-49 employees: 1 establishment)Accommodation and Food Services: Full-Service Restaurants (50-99: 5, 20-49: 7, 10-19: 5, 5-9: 3, 1-4: 11)Accommodation and Food Services: Limited-Service Restaurants (50-99: 1, 20-49: 10, 10-19: 10, 5-9: 7, 1-4: 4)Other Services (except Public Administration): Religious Organizations (20-49: 3, 10-19: 5, 5-9: 10, 1-4: 25)Accommodation and Food Services: Hotels (except Casino Hotels) and Motels (50-99: 1, 20-49: 4, 10-19: 3, 1-4: 4)
People in group quarters in 2010:
509 people in nursing facilities/skilled-nursing facilities
163 people in local jails and other municipal confinement facilities
84 people in other noninstitutional facilities
41 people in residential treatment centers for juveniles (non-correctional)
29 people in group homes intended for adults
People in group quarters in 2000:
609 people in nursing homes
193 people in local jails and other confinement facilities (including police lockups)
63 people in other noninstitutional group quarters
30 people in homes for the mentally retarded
26 people in homes for abused, dependent, and neglected children
12 people in other group homes
Fatal accident statistics in 2014:
Fatal accident count: 3Vehicles involved in fatal accidents: 5Fatal accidents caused by drunken drivers: 0Fatalities: 3Persons involved in fatal accidents: 6Pedestrians involved in fatal accidents: 0
Fatal accident statistics in 2013:
Fatal accident count: 6Vehicles involved in fatal accidents: 8Fatal accidents caused by drunken drivers: 0Fatalities: 6Persons involved in fatal accidents: 9Pedestrians involved in fatal accidents: 2
Home Mortgage Disclosure Act Aggregated Statistics For Year 2009(Based on 10 full and 8 partial tracts) A) FHA, FSA/RHS & VA B) Conventional C) Refinancings D) Home Improvement Loans E) Loans on Dwellings For 5+ Families F) Non-occupant Loans on G) Loans On Manufactured Number Average Value Number Average Value Number Average Value Number Average Value Number Average Value Number Average Value Number Average Value
LOANS ORIGINATED 156 $121,984 127 $99,109 414 $113,723 34 $48,015 3 $461,000 69 $73,201 17 $73,534 APPLICATIONS APPROVED, NOT ACCEPTED 2 $197,545 2 $73,635 34 $85,112 4 $13,820 0 $0 3 $52,923 5 $30,564 APPLICATIONS DENIED 29 $119,726 22 $94,545 233 $104,795 21 $15,194 0 $0 24 $51,789 9 $78,543 APPLICATIONS WITHDRAWN 29 $139,563 11 $79,092 115 $116,226 9 $32,106 0 $0 15 $58,582 4 $48,848 FILES CLOSED FOR INCOMPLETENESS 12 $136,512 4 $105,662 39 $123,957 4 $53,738 0 $0 5 $98,446 2 $111,075
Aggregated Statistics For Year 2008(Based on 10 full and 8 partial tracts) A) FHA, FSA/RHS & VA B) Conventional C) Refinancings D) Home Improvement Loans E) Loans on Dwellings For 5+ Families F) Non-occupant Loans on G) Loans On Manufactured Number Average Value Number Average Value Number Average Value Number Average Value Number Average Value Number Average Value Number Average Value
LOANS ORIGINATED 121 $110,803 194 $97,706 328 $88,556 52 $39,546 6 $736,047 120 $51,208 16 $65,609 APPLICATIONS APPROVED, NOT ACCEPTED 3 $142,827 20 $43,742 52 $85,166 9 $12,830 0 $0 19 $35,681 2 $83,135 APPLICATIONS DENIED 26 $109,425 44 $60,672 411 $97,256 66 $28,927 0 $0 39 $58,694 16 $85,814 APPLICATIONS WITHDRAWN 16 $84,001 10 $142,641 120 $109,525 5 $48,432 0 $0 11 $88,521 5 $69,530 FILES CLOSED FOR INCOMPLETENESS 5 $74,732 4 $96,452 23 $151,902 4 $101,915 0 $0 1 $118,000 0 $0
Aggregated Statistics For Year 2007(Based on 10 full and 8 partial tracts) A) FHA, FSA/RHS & VA B) Conventional C) Refinancings D) Home Improvement Loans E) Loans on Dwellings For 5+ Families F) Non-occupant Loans on G) Loans On Manufactured Number Average Value Number Average Value Number Average Value Number Average Value Number Average Value Number Average Value Number Average Value
LOANS ORIGINATED 81 $104,100 380 $95,773 405 $87,745 93 $35,638 0 $0 136 $58,486 17 $44,981 APPLICATIONS APPROVED, NOT ACCEPTED 4 $121,510 34 $93,798 98 $88,222 16 $57,859 0 $0 15 $37,055 4 $70,248 APPLICATIONS DENIED 13 $102,416 103 $80,873 514 $95,677 71 $36,981 3 $2,083,110 57 $74,619 22 $66,866 APPLICATIONS WITHDRAWN 1 $162,330 21 $91,085 319 $95,428 26 $57,912 0 $0 21 $69,504 12 $80,837 FILES CLOSED FOR INCOMPLETENESS 0 $0 15 $63,737 49 $117,772 3 $52,150 0 $0 17 $36,642 0 $0
Aggregated Statistics For Year 2006(Based on 10 full and 8 partial tracts) A) FHA, FSA/RHS & VA B) Conventional C) Refinancings D) Home Improvement Loans E) Loans on Dwellings For 5+ Families F) Non-occupant Loans on G) Loans On Manufactured Number Average Value Number Average Value Number Average Value Number Average Value Number Average Value Number Average Value Number Average Value
LOANS ORIGINATED 76 $101,648 473 $81,887 529 $76,785 94 $43,194 2 $117,935 226 $43,420 27 $62,430 APPLICATIONS APPROVED, NOT ACCEPTED 5 $72,070 64 $68,209 132 $65,424 12 $33,448 0 $0 27 $42,734 20 $67,733 APPLICATIONS DENIED 13 $78,604 132 $73,369 683 $81,366 82 $31,617 1 $122,850 40 $75,440 63 $60,728 APPLICATIONS WITHDRAWN 9 $98,014 45 $70,246 419 $92,186 14 $69,907 0 $0 19 $94,726 12 $67,978 FILES CLOSED FOR INCOMPLETENESS 2 $95,540 12 $64,332 85 $97,644 1 $80,390 0 $0 2 $43,510 2 $87,860
Aggregated Statistics For Year 2005(Based on 10 full and 8 partial tracts) A) FHA, FSA/RHS & VA B) Conventional C) Refinancings D) Home Improvement Loans E) Loans on Dwellings For 5+ Families F) Non-occupant Loans on G) Loans On Manufactured Number Average Value Number Average Value Number Average Value Number Average Value Number Average Value Number Average Value Number Average Value
LOANS ORIGINATED 69 $96,259 415 $79,084 552 $78,569 112 $30,055 0 $0 160 $46,896 38 $57,001 APPLICATIONS APPROVED, NOT ACCEPTED 8 $99,464 75 $81,437 165 $67,606 17 $38,036 0 $0 25 $53,482 11 $52,887 APPLICATIONS DENIED 14 $54,115 165 $72,451 666 $76,016 170 $26,961 2 $284,805 42 $61,718 93 $58,961 APPLICATIONS WITHDRAWN 8 $66,468 43 $72,864 376 $85,265 42 $68,991 0 $0 22 $47,299 16 $71,359 FILES CLOSED FOR INCOMPLETENESS 2 $95,790 28 $94,744 50 $102,085 5 $43,202 0 $0 3 $78,763 2 $98,500
Aggregated Statistics For Year 2004(Based on 10 full and 8 partial tracts) A) FHA, FSA/RHS & VA B) Conventional C) Refinancings D) Home Improvement Loans E) Loans on Dwellings For 5+ Families F) Non-occupant Loans on G) Loans On Manufactured Number Average Value Number Average Value Number Average Value Number Average Value Number Average Value Number Average Value Number Average Value
LOANS ORIGINATED 100 $86,865 403 $78,458 725 $78,195 91 $27,126 2 $2,922,200 191 $47,724 31 $60,323 APPLICATIONS APPROVED, NOT ACCEPTED 12 $73,231 50 $74,885 193 $68,235 6 $24,990 0 $0 21 $42,753 14 $58,673 APPLICATIONS DENIED 15 $71,708 156 $66,358 710 $70,710 68 $29,022 0 $0 54 $48,574 83 $54,040 APPLICATIONS WITHDRAWN 5 $121,448 29 $76,023 293 $83,859 23 $30,558 0 $0 23 $49,107 12 $64,718 FILES CLOSED FOR INCOMPLETENESS 4 $61,862 12 $70,657 52 $79,724 4 $31,505 0 $0 6 $45,282 0 $0
Aggregated Statistics For Year 2003(Based on 10 full and 8 partial tracts) A) FHA, FSA/RHS & VA B) Conventional C) Refinancings D) Home Improvement Loans E) Loans on Dwellings For 5+ Families F) Non-occupant Loans on Number Average Value Number Average Value Number Average Value Number Average Value Number Average Value Number Average Value
LOANS ORIGINATED 101 $87,984 364 $87,728 1,071 $83,657 47 $15,104 2 $1,715,965 136 $46,036 APPLICATIONS APPROVED, NOT ACCEPTED 4 $54,872 59 $69,887 203 $68,668 5 $20,428 0 $0 6 $41,715 APPLICATIONS DENIED 12 $89,171 85 $66,812 533 $67,880 49 $30,272 2 $122,625 36 $54,464 APPLICATIONS WITHDRAWN 13 $92,961 44 $95,811 261 $88,315 2 $41,170 0 $0 14 $49,339 FILES CLOSED FOR INCOMPLETENESS 6 $106,148 14 $92,686 89 $92,050 7 $56,751 0 $0 6 $43,288
Aggregated Statistics For Year 2002(Based on 4 partial tracts) A) FHA, FSA/RHS & VA B) Conventional C) Refinancings D) Home Improvement Loans F) Non-occupant Loans on Number Average Value Number Average Value Number Average Value Number Average Value Number Average Value
LOANS ORIGINATED 10 $93,738 54 $106,460 150 $91,307 9 $16,031 9 $55,400 APPLICATIONS APPROVED, NOT ACCEPTED 1 $97,030 8 $46,215 39 $87,515 3 $21,520 1 $22,970 APPLICATIONS DENIED 3 $63,197 17 $62,428 95 $77,625 5 $17,610 1 $64,730 APPLICATIONS WITHDRAWN 2 $69,530 5 $68,514 49 $84,555 1 $21,680 2 $87,640 FILES CLOSED FOR INCOMPLETENESS 0 $0 1 $77,670 8 $95,070 0 $0 0 $0
Aggregated Statistics For Year 2001(Based on 4 partial tracts) A) FHA, FSA/RHS & VA B) Conventional C) Refinancings D) Home Improvement Loans E) Loans on Dwellings For 5+ Families F) Non-occupant Loans on Number Average Value Number Average Value Number Average Value Number Average Value Number Average Value Number Average Value
LOANS ORIGINATED 12 $88,305 50 $99,074 122 $93,330 11 $23,765 1 $558,430 6 $71,300 APPLICATIONS APPROVED, NOT ACCEPTED 0 $0 10 $63,440 27 $81,891 1 $37,510 0 $0 0 $0 APPLICATIONS DENIED 1 $61,800 26 $53,660 68 $69,181 2 $11,680 0 $0 1 $96,170 APPLICATIONS WITHDRAWN 1 $80,440 2 $118,180 25 $72,915 0 $0 0 $0 0 $0 FILES CLOSED FOR INCOMPLETENESS 0 $0 1 $69,320 6 $65,148 0 $0 0 $0 1 $12,480
Aggregated Statistics For Year 2000(Based on 4 partial tracts) A) FHA, FSA/RHS & VA B) Conventional C) Refinancings D) Home Improvement Loans E) Loans on Dwellings For 5+ Families F) Non-occupant Loans on Number Average Value Number Average Value Number Average Value Number Average Value Number Average Value Number Average Value
LOANS ORIGINATED 8 $85,924 49 $87,003 38 $61,719 9 $28,796 1 $892,830 8 $46,602 APPLICATIONS APPROVED, NOT ACCEPTED 0 $0 14 $94,463 8 $68,015 5 $21,972 0 $0 2 $67,410 APPLICATIONS DENIED 3 $58,093 37 $68,759 40 $73,816 7 $16,564 0 $0 2 $26,505 APPLICATIONS WITHDRAWN 1 $49,930 4 $72,080 15 $95,721 2 $15,450 0 $0 1 $72,100 FILES CLOSED FOR INCOMPLETENESS 0 $0 1 $59,720 2 $95,095 0 $0 0 $0 0 $0
Aggregated Statistics For Year 1999(Based on 1 full and 3 partial tracts) A) FHA, FSA/RHS & VA B) Conventional C) Refinancings D) Home Improvement Loans E) Loans on Dwellings For 5+ Families F) Non-occupant Loans on Number Average Value Number Average Value Number Average Value Number Average Value Number Average Value Number Average Value
LOANS ORIGINATED 35 $89,276 104 $83,880 132 $75,261 17 $13,098 1 $1,000,000 11 $75,239 APPLICATIONS APPROVED, NOT ACCEPTED 1 $46,090 16 $55,423 32 $70,078 3 $25,270 0 $0 1 $107,020 APPLICATIONS DENIED 3 $64,807 55 $51,325 56 $64,310 11 $17,456 0 $0 2 $46,215 APPLICATIONS WITHDRAWN 2 $91,110 9 $85,411 25 $77,358 3 $8,000 0 $0 0 $0 FILES CLOSED FOR INCOMPLETENESS 1 $78,000 1 $115,000 9 $66,862 1 $15,000 0 $0 0 $0
Private Mortgage Insurance Companies Aggregated Statistics For Year 2009(Based on 6 full and 8 partial tracts) A) Conventional B) Refinancings C) Non-occupant Loans on D) Loans On Manufactured Number Average Value Number Average Value Number Average Value Number Average Value
LOANS ORIGINATED 12 $154,820 7 $141,399 0 $0 1 $114,000 APPLICATIONS APPROVED, NOT ACCEPTED 1 $79,000 4 $190,820 1 $79,000 0 $0 APPLICATIONS DENIED 1 $326,090 7 $166,846 0 $0 0 $0 APPLICATIONS WITHDRAWN 0 $0 0 $0 0 $0 0 $0 FILES CLOSED FOR INCOMPLETENESS 1 $117,000 2 $150,565 0 $0 0 $0
Aggregated Statistics For Year 2008(Based on 10 full and 8 partial tracts) A) Conventional B) Refinancings C) Non-occupant Loans on Number Average Value Number Average Value Number Average Value
LOANS ORIGINATED 46 $127,151 26 $130,573 10 $84,925 APPLICATIONS APPROVED, NOT ACCEPTED 15 $133,780 21 $93,676 4 $55,482 APPLICATIONS DENIED 4 $113,090 5 $132,724 4 $81,940 APPLICATIONS WITHDRAWN 0 $0 4 $108,152 0 $0 FILES CLOSED FOR INCOMPLETENESS 1 $76,000 1 $205,000 0 $0
Aggregated Statistics For Year 2007(Based on 10 full and 8 partial tracts) A) Conventional B) Refinancings C) Non-occupant Loans on D) Loans On Manufactured Number Average Value Number Average Value Number Average Value Number Average Value
LOANS ORIGINATED 113 $90,121 39 $106,673 28 $50,160 1 $58,050 APPLICATIONS APPROVED, NOT ACCEPTED 5 $80,700 13 $108,708 0 $0 0 $0 APPLICATIONS DENIED 1 $94,260 0 $0 0 $0 0 $0 APPLICATIONS WITHDRAWN 4 $94,092 1 $106,520 0 $0 0 $0 FILES CLOSED FOR INCOMPLETENESS 0 $0 0 $0 0 $0 0 $0
Aggregated Statistics For Year 2006(Based on 10 full and 8 partial tracts) A) Conventional B) Refinancings C) Non-occupant Loans on D) Loans On Manufactured Number Average Value Number Average Value Number Average Value Number Average Value
LOANS ORIGINATED 76 $86,628 33 $95,628 20 $47,174 0 $0 APPLICATIONS APPROVED, NOT ACCEPTED 10 $106,146 11 $115,581 5 $51,408 1 $135,000 APPLICATIONS DENIED 0 $0 0 $0 0 $0 0 $0 APPLICATIONS WITHDRAWN 3 $43,340 2 $122,205 0 $0 0 $0 FILES CLOSED FOR INCOMPLETENESS 0 $0 0 $0 0 $0 0 $0
Aggregated Statistics For Year 2005(Based on 10 full and 8 partial tracts) A) Conventional B) Refinancings C) Non-occupant Loans on D) Loans On Manufactured Number Average Value Number Average Value Number Average Value Number Average Value
LOANS ORIGINATED 86 $87,860 50 $105,692 18 $61,888 1 $46,770 APPLICATIONS APPROVED, NOT ACCEPTED 16 $85,219 24 $95,807 3 $26,407 2 $70,080 APPLICATIONS DENIED 0 $0 0 $0 0 $0 0 $0 APPLICATIONS WITHDRAWN 7 $91,723 3 $116,963 0 $0 0 $0 FILES CLOSED FOR INCOMPLETENESS 1 $51,870 1 $138,000 0 $0 0 $0
Aggregated Statistics For Year 2004(Based on 10 full and 8 partial tracts) A) Conventional B) Refinancings C) Non-occupant Loans on D) Loans On Manufactured Number Average Value Number Average Value Number Average Value Number Average Value
LOANS ORIGINATED 82 $82,417 86 $88,970 21 $52,464 1 $48,020 APPLICATIONS APPROVED, NOT ACCEPTED 20 $78,489 18 $91,115 3 $70,270 1 $81,560 APPLICATIONS DENIED 1 $110,580 1 $69,900 0 $0 0 $0 APPLICATIONS WITHDRAWN 8 $94,059 2 $58,590 2 $33,760 0 $0 FILES CLOSED FOR INCOMPLETENESS 0 $0 0 $0 0 $0 0 $0
Aggregated Statistics For Year 2003(Based on 10 full and 8 partial tracts) A) Conventional B) Refinancings C) Non-occupant Loans on Number Average Value Number Average Value Number Average Value
LOANS ORIGINATED 98 $82,910 148 $101,850 13 $52,255 APPLICATIONS APPROVED, NOT ACCEPTED 18 $78,176 37 $96,439 3 $41,597 APPLICATIONS DENIED 0 $0 2 $89,000 0 $0 APPLICATIONS WITHDRAWN 9 $62,258 18 $145,521 7 $47,351 FILES CLOSED FOR INCOMPLETENESS 0 $0 0 $0 0 $0
Aggregated Statistics For Year 2002(Based on 4 partial tracts) A) Conventional B) Refinancings C) Non-occupant Loans on Number Average Value Number Average Value Number Average Value
LOANS ORIGINATED 8 $120,268 11 $114,655 2 $39,115 APPLICATIONS APPROVED, NOT ACCEPTED 2 $140,510 5 $117,658 0 $0 APPLICATIONS DENIED 0 $0 0 $0 0 $0 APPLICATIONS WITHDRAWN 0 $0 0 $0 0 $0 FILES CLOSED FOR INCOMPLETENESS 0 $0 1 $30,790 1 $30,790
Aggregated Statistics For Year 2001(Based on 4 partial tracts) A) Conventional B) Refinancings Number Average Value Number Average Value
LOANS ORIGINATED 10 $154,313 9 $109,252 APPLICATIONS APPROVED, NOT ACCEPTED 0 $0 3 $109,210 APPLICATIONS DENIED 0 $0 0 $0 APPLICATIONS WITHDRAWN 0 $0 0 $0 FILES CLOSED FOR INCOMPLETENESS 1 $35,780 1 $128,010
Aggregated Statistics For Year 2000(Based on 4 partial tracts) A) Conventional B) Refinancings Number Average Value Number Average Value
LOANS ORIGINATED 9 $116,150 3 $77,030 APPLICATIONS APPROVED, NOT ACCEPTED 2 $274,110 0 $0 APPLICATIONS DENIED 1 $160,820 0 $0 APPLICATIONS WITHDRAWN 1 $106,520 0 $0 FILES CLOSED FOR INCOMPLETENESS 0 $0 0 $0
Aggregated Statistics For Year 1999(Based on 1 full and 3 partial tracts) A) Conventional B) Refinancings Number Average Value Number Average Value
LOANS ORIGINATED 12 $100,690 12 $86,752 APPLICATIONS APPROVED, NOT ACCEPTED 1 $114,040 1 $83,000 APPLICATIONS DENIED 1 $121,820 2 $86,500 APPLICATIONS WITHDRAWN 0 $0 0 $0 FILES CLOSED FOR INCOMPLETENESS 0 $0 0 $0
2002 - 2018 National Fire Incident Reporting System (NFIRS) incidents See full 2006 National Fire Incident Reporting System statistics for zip code 24540, Virginia
Most common first names in zip code 24540 among deceased individuals Name Count Lived (average)
James 297 73.9 years Mary 274 79.9 years William 225 74.1 years John 184 75.0 years Robert 142 71.3 years Annie 112 83.9 years George 103 76.5 years Ruth 100 80.9 years Virginia 96 79.6 years Charles 82 73.5 years
Most common last names in zip code 24540 among deceased individuals Last name Count Lived (average)
Jones 121 73.6 years Davis 110 74.2 years Smith 94 76.6 years Wilson 88 74.4 years Carter 81 73.6 years Moore 74 71.8 years Walker 70 74.3 years Adkins 65 75.8 years Hall 65 78.4 years Clark 65 79.0 years
Businesses in zip code 24540
Name Count Name Count
AT&T 1 Lane Furniture 2 Advance Auto Parts 2 Long John Silver's 1 Aeropostale 1 Lowe's 1 American Eagle Outfitters 1 Marriott 1 Applebee's 1 Marshalls 1 Arby's 1 McDonald's 2 Ashley Furniture 1 Men's Wearhouse 1 AutoZone 1 Nike 5 Bath & Body Works 1 Nissan 1 Best Western 1 Old Navy 1 Burger King 3 Olive Garden 1 CVS 1 Outback 1 Chevrolet 1 Outback Steakhouse 1 Chick-Fil-A 1 Pac Sun 1 Comfort Inn 1 Papa John's Pizza 1 Dairy Queen 1 Payless 2 Deb 1 PetSmart 1 Domino's Pizza 2 Pizza Hut 1 Dunkin Donuts 1 RadioShack 2 FedEx 4 Red Lobster 1 Finish Line 1 Rite Aid 1 Foot Locker 1 SONIC Drive-In 1 GNC 1 Sears 2 GameStop 2 Sleep Inn 1 H&R Block 2 Spencer Gifts 1 Hardee's 2 Sprint Nextel 2 Hilton 1 Starbucks 2 Hobby Lobby 1 Super 8 1 Holiday Inn 1 T-Mobile 3 Home Depot 1 Taco Bell 1 Hot Topic 1 Target 1 Hyundai 1 U-Haul 4 JCPenney 1 UPS 5 Jones New York 4 Vans 1 Journeys 1 Victoria's Secret 1 KFC 1 Walmart 1 Lane Bryant 1 Wendy's 2

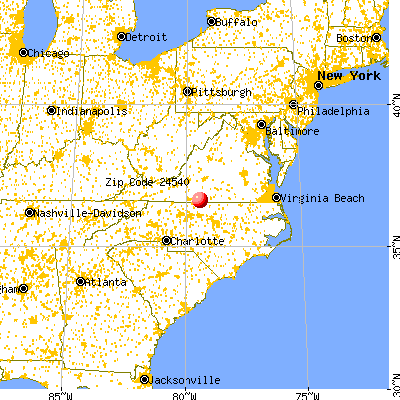


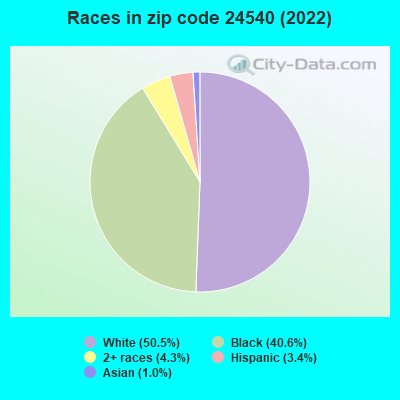


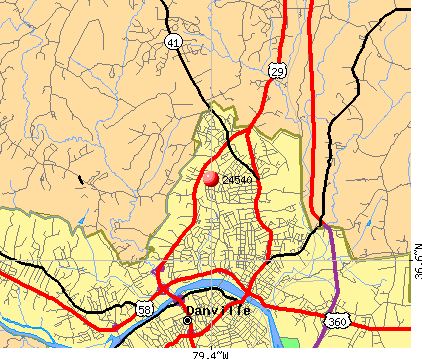 Nearest zip codes: 24541, 24549, 27315, 24527, 24586, 27311.
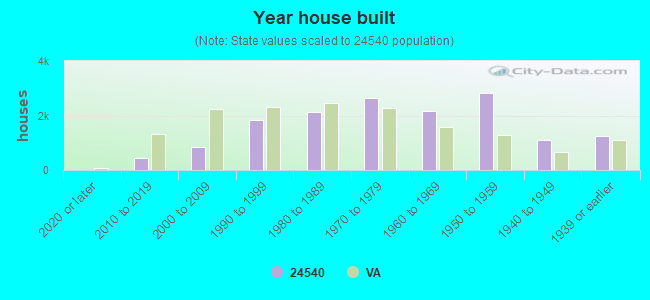

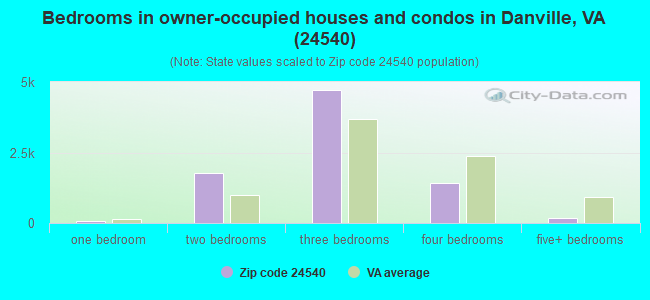
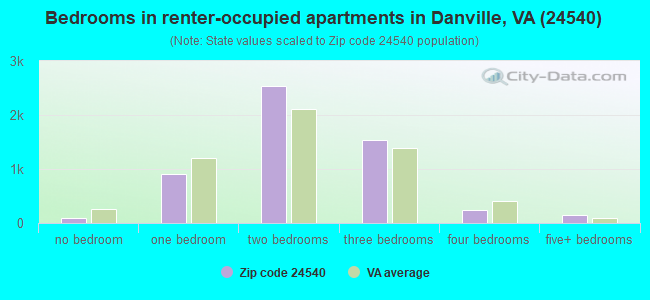

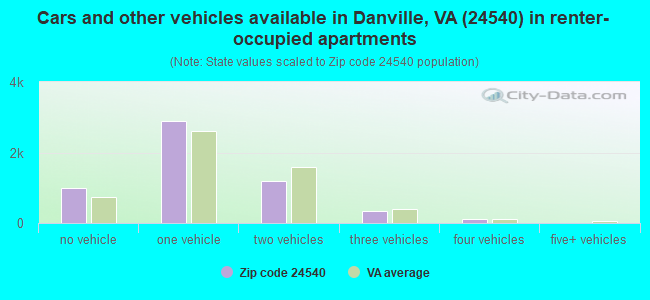


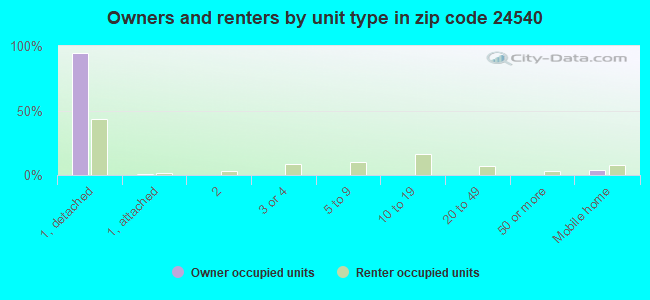
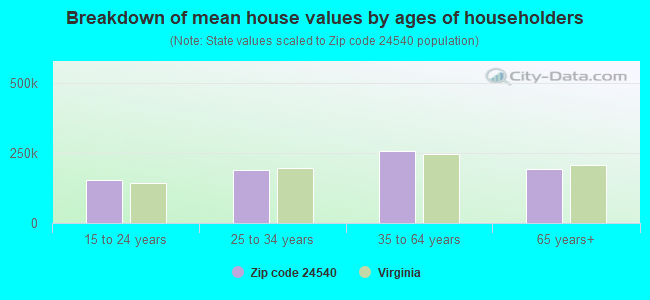


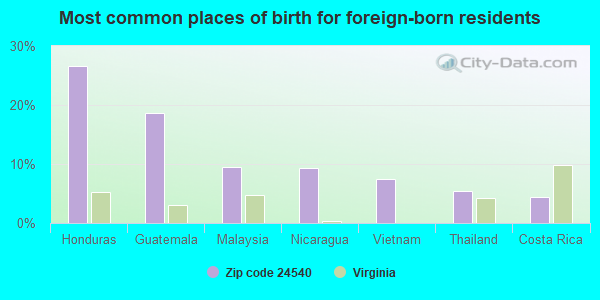
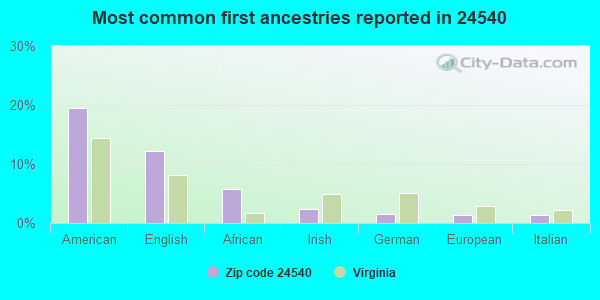
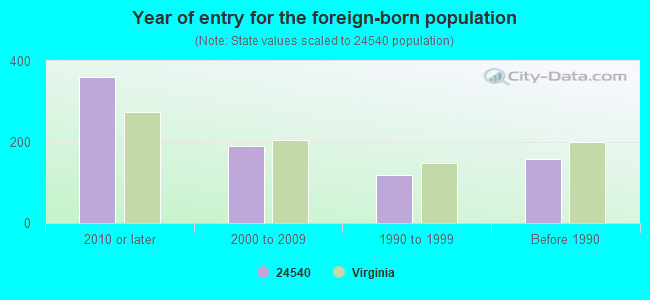


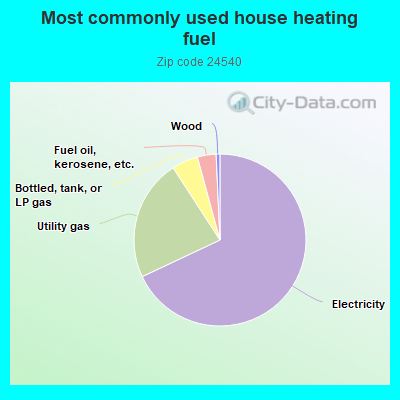
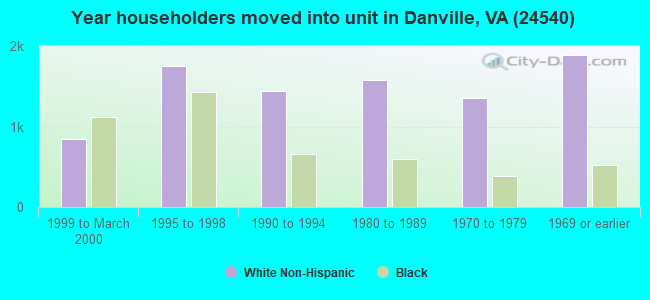
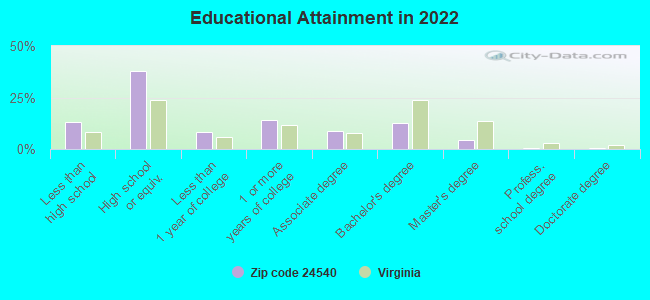
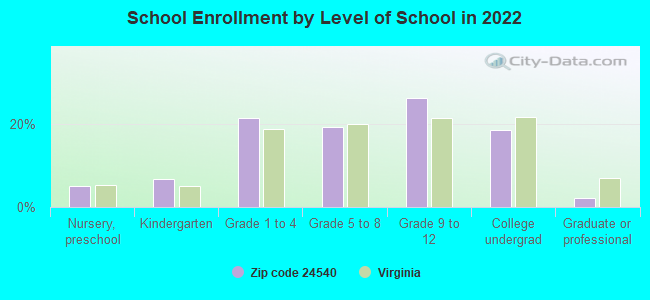
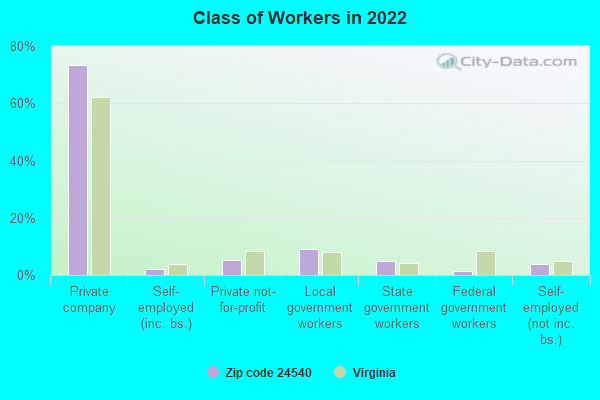
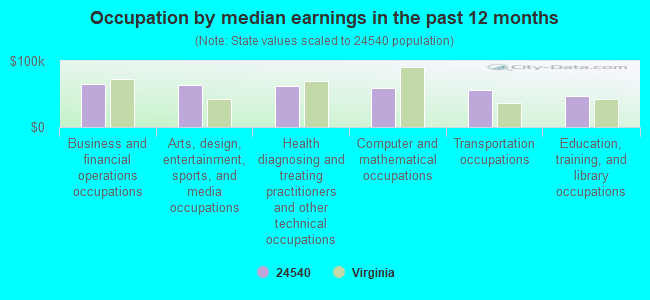
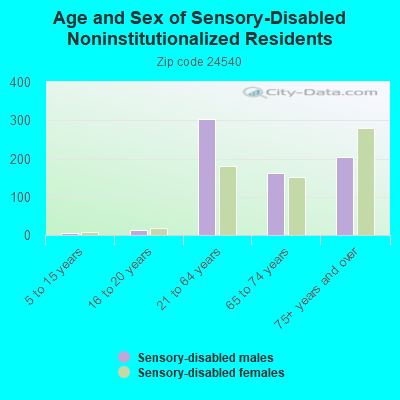
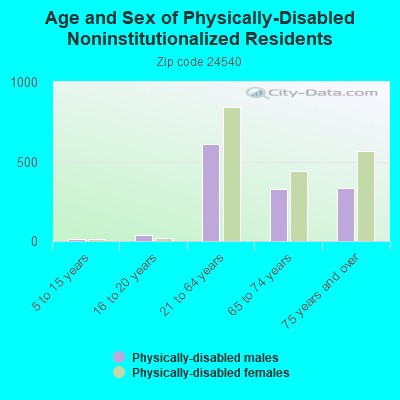
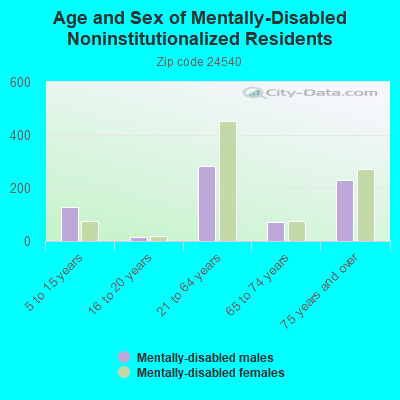
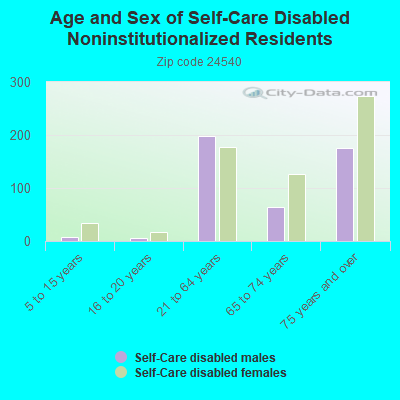
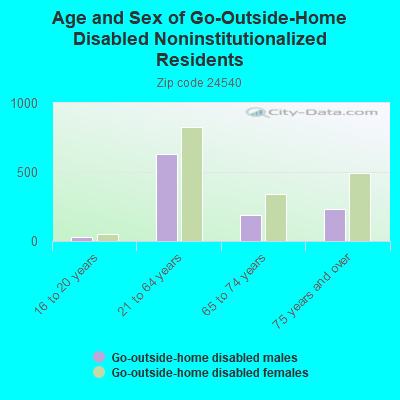
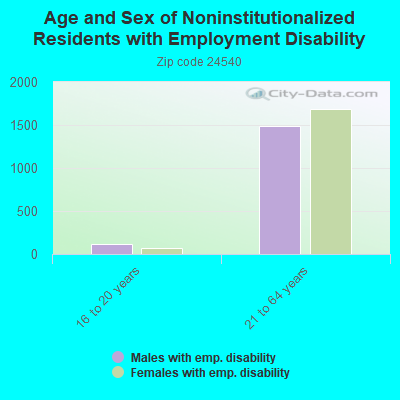
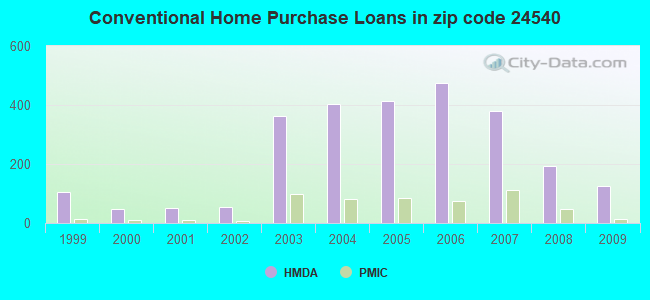
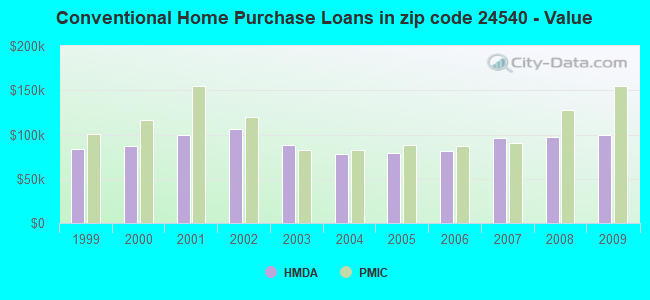
 Based on the data from the years 2002 - 2018 the average number of fire incidents per year is 199. The highest number of fires - 284 took place in 2007, and the least - 64 in 2002. The data has a rising trend.
 When looking into fire subcategories, the most incidents belonged to: Outside Fires (41.6%), and Structure Fires (39.9%).