Estimated zip code population in 2022: 779 Zip code population in 2010: 1,088 Zip code population in 2000: 993
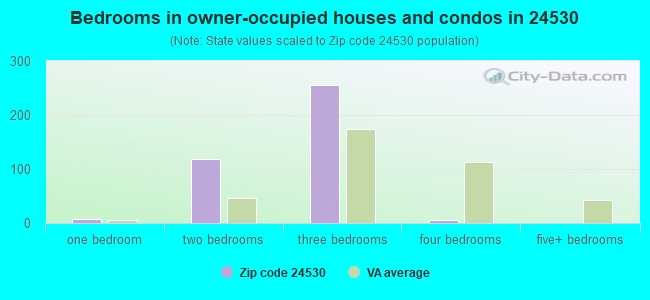
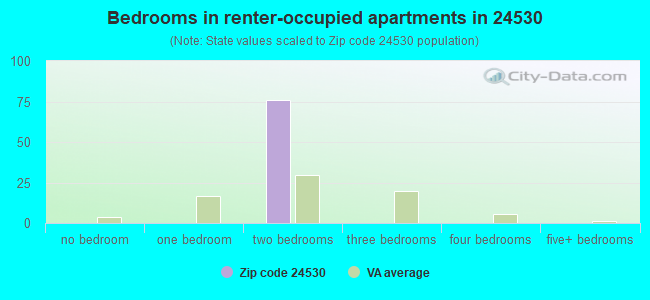
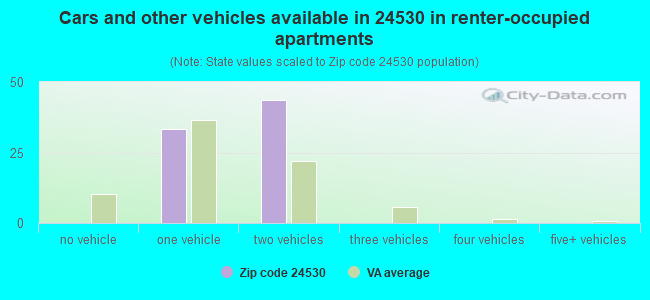
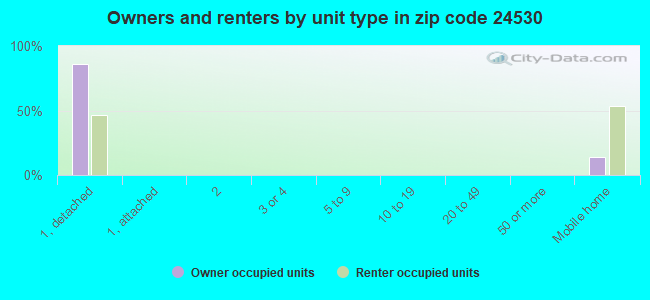
Houses and condos: 565 Renter-occupied apartments: 77
% of renters here:
17%
State:
33%
March 2022 cost of living index in zip code 24530: 85.4 (less than average, U.S. average is 100)
Land area: 35.1 sq. mi. Water area: 0.1 sq. mi.
Population density: 22 people per square mile
(very low).
OSM Map
General Map
Google Map
MSN Map
OSM Map
General Map
Google Map
MSN Map
OSM Map
General Map
Google Map
MSN Map
OSM Map
General Map
Google Map
MSN Map
Please wait while loading the map...
Real estate property taxes paid for housing units in 2022:
This zip code:
0.5% ($714)
Virginia:
0.7% ($2,617)
Median real estate property taxes paid for housing units with mortgages in 2022: $599 (0.4%) Median real estate property taxes paid for housing units with no mortgage in 2022: $750 (0.4%)
Business Search- 14 Million verified businesses
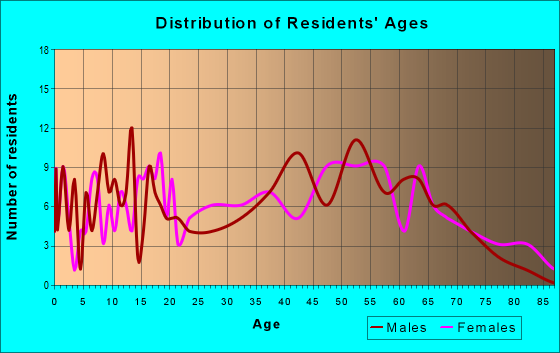
Males: 408
(52.5%)
Females: 370
(47.5%)
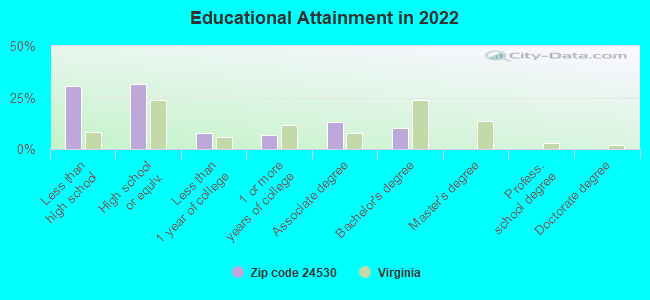
For population 25 years and over in 24530:
High school or higher: 65.9%
Bachelor's degree or higher: 9.5%
Graduate or professional degree: 0.0%
Unemployed: 1.3%
Mean travel time to work (commute): 32.2 minutes
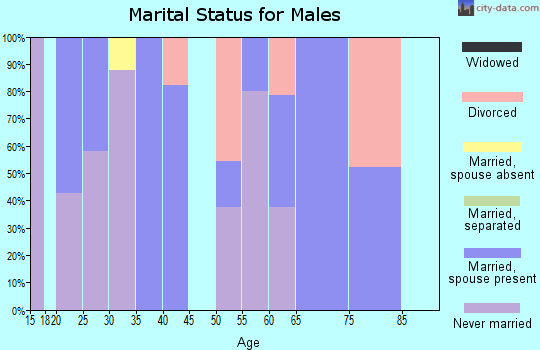
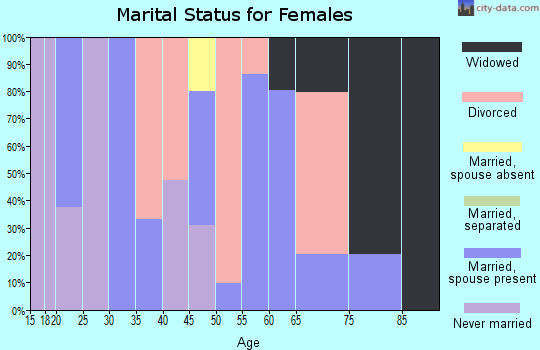
For population 15 years and over in 24530:
Never married: 20.6%
Now married: 62.6%
Separated: 4.4%
Widowed: 7.3%
Divorced: 5.2%
Zip code 24530 compared to state average:
Median household income significantly below state average.
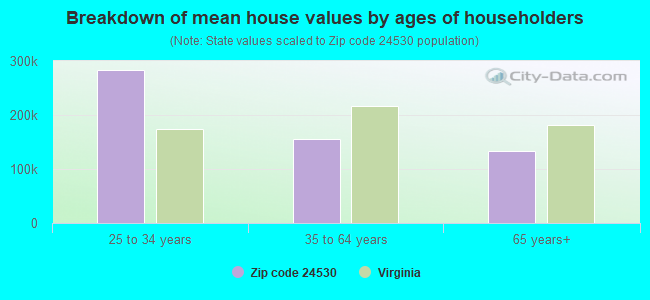
Median house value significantly below state average.
Unemployed percentage below state average.
Hispanic race population percentage significantly below state average.
Median age significantly above state average.
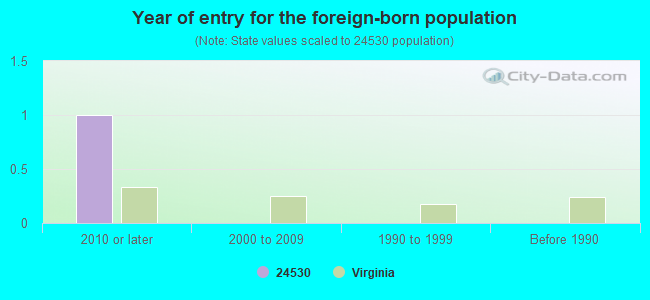
Foreign-born population percentage significantly below state average.
Renting percentage below state average.
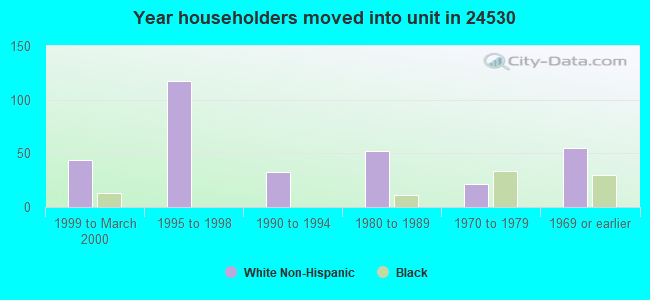
Length of stay since moving in significantly above state average.
Percentage of population with a bachelor's degree or higher significantly below state average.
Estimated median house/condo value in 2022: $157,882
24530:
$157,882
Virginia:
$365,700
According to our research of Virginia and other state lists, there were 3 registered sex offenders living in 24530 zip code as of April 26, 2024. The ratio of all residents to sex offenders in zip code 24530 is 456 to 1. The ratio of registered sex offenders to all residents in this zip code is lower than the state average.
Median resident age:
This zip code:
66.4 years
Virginia median age:
39.0 years
Average household size:
This zip code:
1.7 people
Virginia:
2.5 people
Averages for the 2020 tax year for zip code 24530, filed in 2021:
Average Adjusted Gross Income (AGI) in 2020: $46,158 (Individual Income Tax Returns)
Here:
$46,158
State:
$86,446
Salary/wage: $38,748 (reported on 84.0% of returns)
Here:
$38,748
State:
$71,185
(% of AGI for various income ranges: 1093.1% for AGIs below $25k, 3091.5% for AGIs $25k-50k, 6036.0% for AGIs $50k-75k, 11660.0% for AGIs $75k-100k, 14393.3% for AGIs $100k-200k)
Taxable interest for individuals: $1,027 (reported on 22.0% of returns)
This zip code:
$1,027
Virginia:
$1,805
(% of AGI for various income ranges: 13.1% for AGIs below $25k, 40.0% for AGIs $25k-50k, 146.7% for AGIs $75k-100k)
Ordinary dividends: $3,460 (reported on 10.0% of returns)
Here:
$3,460
State:
$8,327
(% of AGI for various income ranges: 43.8% for AGIs below $25k, 232.0% for AGIs $50k-75k)
Net capital gain/loss in AGI: +$3,980 (reported on 10.0% of returns)
Here:
+$3,980
State:
+$24,644
(% of AGI for various income ranges: 398.0% for AGIs $50k-75k)
Profit/loss from business: +$6,620 (reported on 10.0% of returns)
Here:
+$6,620
State:
+$12,836
(% of AGI for various income ranges: 110.0% for AGIs below $25k, 144.6% for AGIs $25k-50k)
Taxable individual retirement arrangement distribution: $15,400 (reported on 8.0% of returns)
24530:
$15,400
Virginia:
$21,535
(% of AGI for various income ranges: 115.4% for AGIs below $25k, 932.0% for AGIs $50k-75k)
Earned income credit: $2,050 (reported on 20.0% of returns)
Here:
$2,050
State:
$2,214
(% of AGI for various income ranges: 86.9% for AGIs below $25k, 70.8% for AGIs $25k-50k)
Percentage of individuals using paid preparers for their 2020 taxes: 96.0%
Here:
96%
State:
92%
(% for various income ranges: 88.9% for AGIs below $25k, 100.0% for AGIs $25k-50k, 100.0% for AGIs $50k-75k, 100.0% for AGIs $75k-100k, 100.0% for AGIs $100k-200k)
Averages for the 2012 tax year for zip code 24530, filed in 2013:
Average Adjusted Gross Income (AGI) in 2012: $39,905 (Individual Income Tax Returns)
Here:
$39,905
State:
$71,192
Salary/wage: $35,816 (reported on 86.0% of returns)
Here:
$35,816
State:
$59,229
(% of AGI for various income ranges: 76.9% for AGIs below $25k, 77.9% for AGIs $25k-50k, 76.8% for AGIs $50k-75k, 86.0% for AGIs $75k-100k, 67.7% for AGIs $100k-200k)
Taxable interest for individuals: $1,020 (reported on 34.9% of returns)
This zip code:
$1,020
Virginia:
$1,600
(% of AGI for various income ranges: 1.1% for AGIs below $25k, 1.0% for AGIs $25k-50k, 1.4% for AGIs $50k-75k, 0.7% for AGIs $75k-100k)
Ordinary dividends: $867 (reported on 14.0% of returns)
Here:
$867
State:
$6,959
Net capital gain/loss in AGI: +$3,120 (reported on 11.6% of returns)
Here:
+$3,120
State:
+$16,672
Profit/loss from business: +$5,420 (reported on 11.6% of returns)
Here:
+$5,420
State:
+$14,116
Taxable individual retirement arrangement distribution: $5,867 (reported on 7.0% of returns)
24530:
$5,867
Virginia:
$16,667
Total itemized deductions: $16,775 (24% of AGI, reported on 18.6% of returns)
Here:
$16,775
State:
$26,596
Here:
23.9% of AGI
State:
20.1% of AGI
Charity contributions: $6,100 (reported on 14.0% of returns)
Here:
$6,100
State:
$4,443
Taxes paid: $4,250 (reported on 18.6% of returns)
24530:
$4,250
State:
$9,951
Earned income credit: $1,967 (reported on 20.9% of returns)
Here:
$1,967
State:
$2,211
(% of AGI for various income ranges: 5.3% for AGIs below $25k, 1.5% for AGIs $25k-50k)
Percentage of individuals using paid preparers for their 2012 taxes: 69.8%
Here:
70%
State:
46%
(% for various income ranges: 66.7% for AGIs below $25k, 72.7% for AGIs $25k-50k, 75.0% for AGIs $50k-75k, 100.0% for AGIs $75k-100k)
Averages for the 2004 tax year for zip code 24530, filed in 2005:
Average Adjusted Gross Income (AGI) in 2004: $31,669 (Individual Income Tax Returns)
Here:
$31,669
State:
$56,704
Salary/wage: $30,334 (reported on 86.8% of returns)
Here:
$30,334
State:
$48,441
(% of AGI for various income ranges: 72.6% for AGIs below $10k, 84.0% for AGIs $10k-25k, 85.1% for AGIs $25k-50k, 85.9% for AGIs $50k-75k, 88.4% for AGIs $75k-100k, 71.5% for AGIs over 100k)
Taxable interest for individuals: $717 (reported on 31.4% of returns)
This zip code:
$717
Virginia:
$1,688
(% of AGI for various income ranges: 1.6% for AGIs below $10k, 1.4% for AGIs $10k-25k, 0.6% for AGIs $25k-50k, 0.9% for AGIs $50k-75k, 0.1% for AGIs $75k-100k, 0.0% for AGIs over 100k)
Taxable dividends: $781 (reported on 12.6% of returns)
Here:
$781
State:
$4,028
Profit/loss from business: +$3,098 (reported on 10.1% of returns)
Here:
+$3,098
State:
+$13,342
(% of AGI for various income ranges: 10.9% for AGIs below $10k, 2.8% for AGIs $10k-25k, 0.3% for AGIs $25k-50k, 0.2% for AGIs $50k-75k)
Total itemized deductions: $13,911 (21% of AGI, reported on 19.9% of returns)
Here:
$13,911
State:
$21,492
Here:
20.6% of AGI
State:
21.0% of AGI
(% of AGI for various income ranges: 3.9% for AGIs $10k-25k, 7.2% for AGIs $25k-50k, 11.0% for AGIs $50k-75k, 13.0% for AGIs $75k-100k, 13.1% for AGIs over 100k)
Charity contributions deductions: $3,957 (6% of AGI, reported on 18.1% of returns)
Here:
$3,957
State:
$3,794
Here:
5.7% of AGI
State:
3.5% of AGI
(% of AGI for various income ranges: 0.5% for AGIs $10k-25k, 1.4% for AGIs $25k-50k, 3.3% for AGIs $50k-75k, 4.3% for AGIs $75k-100k, 3.6% for AGIs over 100k)
Total tax: $3,798 (reported on 71.2% of returns)
24530:
$3,798
State:
$9,537
(% of AGI for various income ranges: 3.7% for AGIs below $10k, 3.7% for AGIs $10k-25k, 6.2% for AGIs $25k-50k, 8.2% for AGIs $50k-75k, 10.4% for AGIs $75k-100k, 19.5% for AGIs over 100k)
Earned income credit: $1,746 (reported on 26.4% of returns)
Here:
$1,746
State:
$1,734
Percentage of individuals using paid preparers for their 2004 taxes: 77.9%
Here:
78%
State:
52%
(% for various income ranges: 75.9% for AGIs below $10k, 80.2% for AGIs $10k-25k, 76.2% for AGIs $25k-50k, 77.2% for AGIs $50k-75k, 82.6% for AGIs $75k-100k, 78.6% for AGIs over 100k)
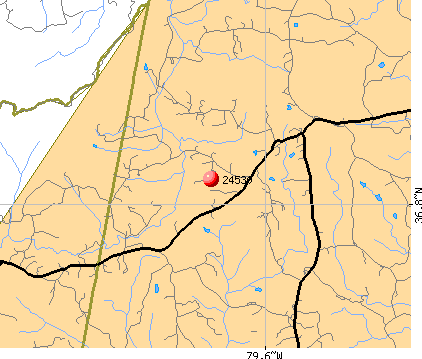
Streams, rivers, and creeks: West Fork Sandy River (A), Terry Branch (B), Sailor Creek (C), James Branch (D), Garrett Branch (E), Flippins Creek (F), Crooked Run (G). Display/hide their locations on the map
In group quarters: 2 (-1 institutionalized population)
Size of family households: 225 2-persons, 34 3-persons, 8 4-persons
Size of nonfamily households: 198 1-person
14 married couples with children.
0 single-parent households ().
101.6% of residents of 24530 zip code speak English at home.
Foreign born population: 0 (0.1%) (0.0% of them are naturalized citizens)
:
0.1%
Whole state:
12.7%
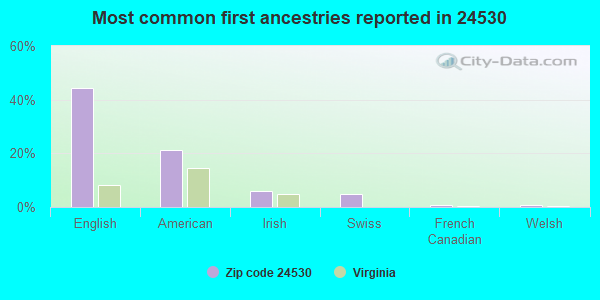
44%English
21%American
6%Irish
5%Swiss
1%French Canadian
1%Welsh
Year of entry for the foreign-born population
12010 or later
02000 to 2009
01990 to 1999
0Before 1990
Housing units lacking complete plumbing facilities: 7.9% Housing units lacking complete kitchen facilities: 8.9%
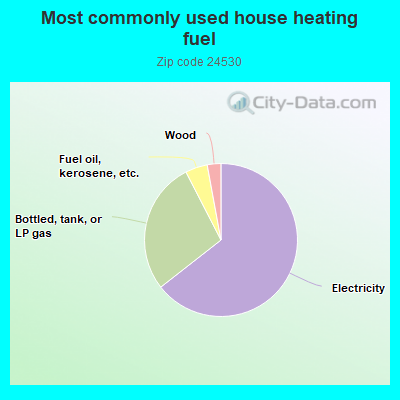
64.7%Electricity
28.1%Bottled, tank, or LP gas
4.7%Fuel oil, kerosene, etc.
2.9%Wood
Population in 1990: 2,143.
Place of birth for U.S.-born residents:
This state: 683
Northeast: 54
Midwest: 8
South: 24
68% of the 24530 zip code residents lived in the same house 5 years ago. Out of people who lived in different houses, 72% lived in this county. Out of people who lived in different counties, 50% lived in Virginia.
93% of the 24530 zip code residents lived in the same house 1 year ago. Out of people who lived in different houses, 48% moved from this county. Out of people who lived in different houses, 54% moved from abroad.
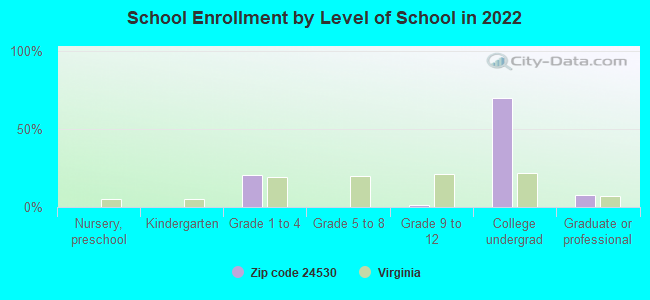
Private vs. public school enrollment:
Students in private schools in grades 1 to 8 (elementary and middle school):
Here:
0.0%
Virginia:
13.2%
Students in private schools in grades 9 to 12 (high school): 1
Here:
100.0%
Virginia:
10.2%
Students in private undergraduate colleges: 18
Here:
41.7%
Virginia:
18.7%
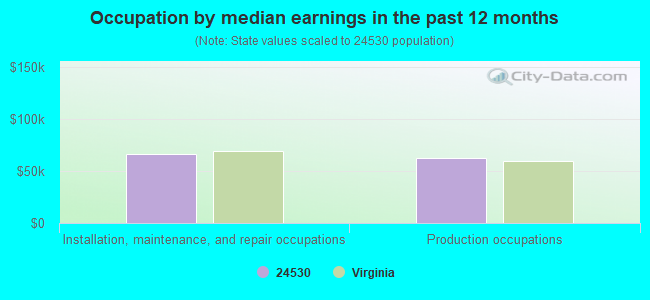
Occupation by median earnings in the past 12 months ($)
66,508Installation, maintenance, and repair occupations
62,772Production occupations
Top industries in this zip code by the number of employees in 2005:
Construction: Highway, Street, and Bridge Construction (10-19 employees: 1 establishment)
Other Services (except Public Administration): Religious Organizations (1-4: 2)
Health Care and Social Assistance: Child Day Care Services (1-4: 1)
Construction: Painting and Wall Covering Contractors (1-4: 1)
Other Services (except Public Administration): Commercial and Industrial Machinery and Equipment (except Automotive and Electronic) Repair and Maintenance (1-4: 1)
Professional, Scientific, and Technical Services: Other Accounting Services (1-4: 1)
Construction: All Other Specialty Trade Contractors (1-4: 1)
People in group quarters in 2010:
2 people in workers' group living quarters and job corps centers
Home Mortgage Disclosure Act Aggregated Statistics For Year 2009 (Based on 2 partial tracts)
A) FHA, FSA/RHS & VA Home Purchase Loans
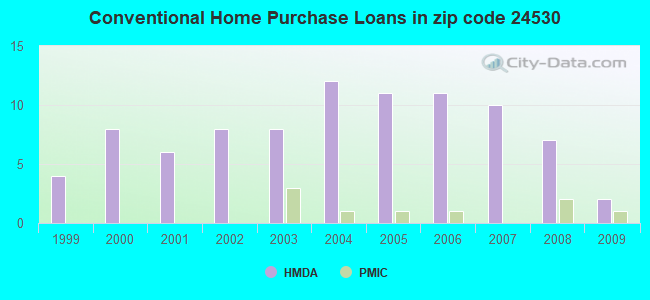
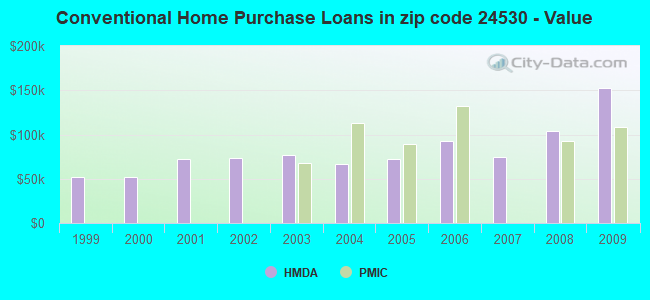
B) Conventional Home Purchase Loans
C) Refinancings
D) Home Improvement Loans
F) Non-occupant Loans on < 5 Family Dwellings (A B C & D)
G) Loans On Manufactured Home Dwelling (A B C & D)
Number
Average Value
Number
Average Value
Number
Average Value
Number
Average Value
Number
Average Value
Number
Average Value
LOANS ORIGINATED
5
$85,380
2
$152,945
12
$105,084
4
$52,462
1
$326,540
6
$83,795
APPLICATIONS APPROVED, NOT ACCEPTED
0
$0
0
$0
1
$90,280
0
$0
0
$0
0
$0
APPLICATIONS DENIED
1
$73,470
1
$93,640
10
$92,438
1
$49,940
0
$0
5
$69,822
APPLICATIONS WITHDRAWN
0
$0
1
$82,590
6
$98,522
0
$0
0
$0
0
$0
FILES CLOSED FOR INCOMPLETENESS
0
$0
0
$0
1
$150,300
0
$0
0
$0
1
$60,510
Aggregated Statistics For Year 2008 (Based on 2 partial tracts)
A) FHA, FSA/RHS & VA Home Purchase Loans
B) Conventional Home Purchase Loans
C) Refinancings
D) Home Improvement Loans
F) Non-occupant Loans on < 5 Family Dwellings (A B C & D)
G) Loans On Manufactured Home Dwelling (A B C & D)
Number
Average Value
Number
Average Value
Number
Average Value
Number
Average Value
Number
Average Value
Number
Average Value
LOANS ORIGINATED
5
$87,780
7
$104,409
16
$109,486
3
$48,980
2
$82,835
8
$65,608
APPLICATIONS APPROVED, NOT ACCEPTED
0
$0
0
$0
3
$81,313
0
$0
0
$0
1
$80,670
APPLICATIONS DENIED
3
$86,277
3
$45,620
24
$94,800
1
$30,730
1
$64,830
8
$77,912
APPLICATIONS WITHDRAWN
1
$121,970
0
$0
5
$111,406
0
$0
0
$0
2
$99,400
FILES CLOSED FOR INCOMPLETENESS
0
$0
0
$0
1
$309,730
0
$0
0
$0
0
$0
Aggregated Statistics For Year 2007 (Based on 2 partial tracts)
A) FHA, FSA/RHS & VA Home Purchase Loans
B) Conventional Home Purchase Loans
C) Refinancings
D) Home Improvement Loans
F) Non-occupant Loans on < 5 Family Dwellings (A B C & D)
G) Loans On Manufactured Home Dwelling (A B C & D)
Number
Average Value
Number
Average Value
Number
Average Value
Number
Average Value
Number
Average Value
Number
Average Value
LOANS ORIGINATED
5
$88,068
10
$75,055
22
$83,096
4
$37,095
0
$0
12
$68,508
APPLICATIONS APPROVED, NOT ACCEPTED
0
$0
2
$70,110
5
$111,694
1
$96,520
1
$33,610
1
$148,860
APPLICATIONS DENIED
0
$0
6
$62,347
31
$98,596
6
$48,500
0
$0
11
$63,037
APPLICATIONS WITHDRAWN
0
$0
1
$126,290
10
$106,556
1
$85,480
0
$0
1
$93,640
FILES CLOSED FOR INCOMPLETENESS
0
$0
0
$0
1
$141,180
0
$0
0
$0
0
$0
Aggregated Statistics For Year 2006 (Based on 2 partial tracts)
A) FHA, FSA/RHS & VA Home Purchase Loans
B) Conventional Home Purchase Loans
C) Refinancings
D) Home Improvement Loans
F) Non-occupant Loans on < 5 Family Dwellings (A B C & D)
G) Loans On Manufactured Home Dwelling (A B C & D)
Number
Average Value
Number
Average Value
Number
Average Value
Number
Average Value
Number
Average Value
Number
Average Value
LOANS ORIGINATED
4
$91,238
11
$92,111
20
$76,544
4
$26,410
2
$107,325
10
$58,200
APPLICATIONS APPROVED, NOT ACCEPTED
0
$0
3
$76,673
4
$76,592
1
$25,450
0
$0
3
$80,353
APPLICATIONS DENIED
1
$71,550
7
$91,033
29
$69,728
2
$42,740
3
$46,260
10
$63,338
APPLICATIONS WITHDRAWN
0
$0
1
$128,210
19
$76,554
1
$38,900
0
$0
5
$55,512
FILES CLOSED FOR INCOMPLETENESS
0
$0
1
$111,890
1
$77,790
0
$0
0
$0
0
$0
Aggregated Statistics For Year 2005 (Based on 2 partial tracts)
A) FHA, FSA/RHS & VA Home Purchase Loans
B) Conventional Home Purchase Loans
C) Refinancings
D) Home Improvement Loans
F) Non-occupant Loans on < 5 Family Dwellings (A B C & D)
G) Loans On Manufactured Home Dwelling (A B C & D)
Number
Average Value
Number
Average Value
Number
Average Value
Number
Average Value
Number
Average Value
Number
Average Value
LOANS ORIGINATED
4
$106,485
11
$72,554
27
$80,620
3
$39,217
2
$162,310
13
$66,009
APPLICATIONS APPROVED, NOT ACCEPTED
0
$0
3
$46,100
8
$65,427
0
$0
0
$0
4
$59,185
APPLICATIONS DENIED
0
$0
7
$73,264
43
$73,716
5
$34,766
1
$48,980
23
$61,925
APPLICATIONS WITHDRAWN
0
$0
3
$104,043
20
$77,120
3
$86,597
0
$0
5
$61,082
FILES CLOSED FOR INCOMPLETENESS
0
$0
0
$0
5
$93,446
0
$0
0
$0
0
$0
Aggregated Statistics For Year 2004 (Based on 2 partial tracts)
A) FHA, FSA/RHS & VA Home Purchase Loans
B) Conventional Home Purchase Loans
C) Refinancings
D) Home Improvement Loans
F) Non-occupant Loans on < 5 Family Dwellings (A B C & D)
G) Loans On Manufactured Home Dwelling (A B C & D)
Number
Average Value
Number
Average Value
Number
Average Value
Number
Average Value
Number
Average Value
Number
Average Value
LOANS ORIGINATED
5
$80,098
12
$67,028
31
$71,596
5
$33,134
3
$70,750
18
$53,809
APPLICATIONS APPROVED, NOT ACCEPTED
0
$0
4
$67,948
11
$65,613
1
$18,730
0
$0
5
$60,986
APPLICATIONS DENIED
1
$106,600
4
$49,820
40
$74,335
4
$21,610
0
$0
14
$65,136
APPLICATIONS WITHDRAWN
0
$0
3
$68,350
12
$86,756
2
$32,895
0
$0
5
$65,596
FILES CLOSED FOR INCOMPLETENESS
0
$0
1
$37,460
2
$82,355
0
$0
0
$0
0
$0
Aggregated Statistics For Year 2003 (Based on 2 partial tracts)
A) FHA, FSA/RHS & VA Home Purchase Loans
B) Conventional Home Purchase Loans
C) Refinancings
D) Home Improvement Loans
F) Non-occupant Loans on < 5 Family Dwellings (A B C & D)
Number
Average Value
Number
Average Value
Number
Average Value
Number
Average Value
Number
Average Value
LOANS ORIGINATED
2
$76,350
8
$77,192
38
$76,870
2
$5,520
1
$153,660
APPLICATIONS APPROVED, NOT ACCEPTED
1
$49,940
1
$34,090
8
$69,629
1
$32,170
0
$0
APPLICATIONS DENIED
0
$0
6
$42,258
26
$71,088
2
$19,450
1
$61,470
APPLICATIONS WITHDRAWN
0
$0
0
$0
13
$71,772
1
$52,820
0
$0
FILES CLOSED FOR INCOMPLETENESS
0
$0
0
$0
3
$82,113
0
$0
0
$0
Aggregated Statistics For Year 2002 (Based on 2 partial tracts)
A) FHA, FSA/RHS & VA Home Purchase Loans
B) Conventional Home Purchase Loans
C) Refinancings
D) Home Improvement Loans
F) Non-occupant Loans on < 5 Family Dwellings (A B C & D)
Number
Average Value
Number
Average Value
Number
Average Value
Number
Average Value
Number
Average Value
LOANS ORIGINATED
3
$96,680
8
$73,410
18
$59,385
1
$73,470
2
$52,580
APPLICATIONS APPROVED, NOT ACCEPTED
0
$0
7
$52,821
10
$72,174
0
$0
0
$0
APPLICATIONS DENIED
0
$0
8
$51,501
22
$68,734
0
$0
0
$0
APPLICATIONS WITHDRAWN
0
$0
0
$0
8
$93,699
0
$0
0
$0
FILES CLOSED FOR INCOMPLETENESS
0
$0
0
$0
2
$81,395
0
$0
0
$0
Aggregated Statistics For Year 2001 (Based on 2 partial tracts)
A) FHA, FSA/RHS & VA Home Purchase Loans
B) Conventional Home Purchase Loans
C) Refinancings
D) Home Improvement Loans
F) Non-occupant Loans on < 5 Family Dwellings (A B C & D)
Number
Average Value
Number
Average Value
Number
Average Value
Number
Average Value
Number
Average Value
LOANS ORIGINATED
2
$85,715
6
$71,790
16
$62,126
1
$10,080
2
$48,740
APPLICATIONS APPROVED, NOT ACCEPTED
0
$0
3
$76,513
2
$71,070
0
$0
0
$0
APPLICATIONS DENIED
0
$0
6
$41,377
18
$54,956
1
$18,250
0
$0
APPLICATIONS WITHDRAWN
0
$0
0
$0
8
$51,441
0
$0
0
$0
FILES CLOSED FOR INCOMPLETENESS
0
$0
0
$0
1
$110,450
0
$0
0
$0
Aggregated Statistics For Year 2000 (Based on 2 partial tracts)
A) FHA, FSA/RHS & VA Home Purchase Loans
B) Conventional Home Purchase Loans
C) Refinancings
D) Home Improvement Loans
F) Non-occupant Loans on < 5 Family Dwellings (A B C & D)
Number
Average Value
Number
Average Value
Number
Average Value
Number
Average Value
Number
Average Value
LOANS ORIGINATED
2
$92,200
8
$51,681
7
$52,753
1
$48,020
1
$26,410
APPLICATIONS APPROVED, NOT ACCEPTED
0
$0
5
$58,200
1
$55,700
0
$0
0
$0
APPLICATIONS DENIED
0
$0
10
$53,110
8
$67,949
2
$9,605
0
$0
APPLICATIONS WITHDRAWN
0
$0
2
$68,670
3
$68,190
0
$0
0
$0
FILES CLOSED FOR INCOMPLETENESS
0
$0
0
$0
0
$0
0
$0
0
$0
Aggregated Statistics For Year 1999 (Based on 1 partial tract)
Detailed PMIC statistics for the following Tracts:0104.00
2002 - 2018 National Fire Incident Reporting System (NFIRS) incidents
Based on the data from the years 2002 - 2018 the average number of fire incidents per year is 11. The highest number of fires - 22 took place in 2008, and the least - 2 in 2011. The data has a declining trend.
When looking into fire subcategories, the most incidents belonged to: Structure Fires (44.1%), and Outside Fires (38.2%).
Fire incident types reported to NFIRS in Zip Code 24530
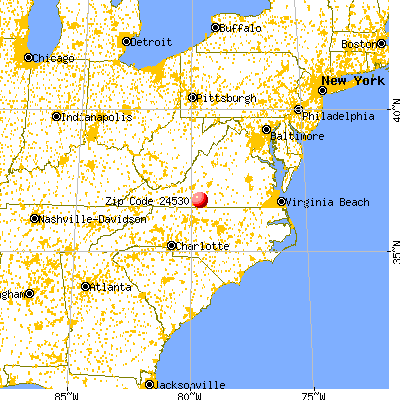


 Nearest zip codes: 24137, 24549, 24054, 24531, 24161, 24176.
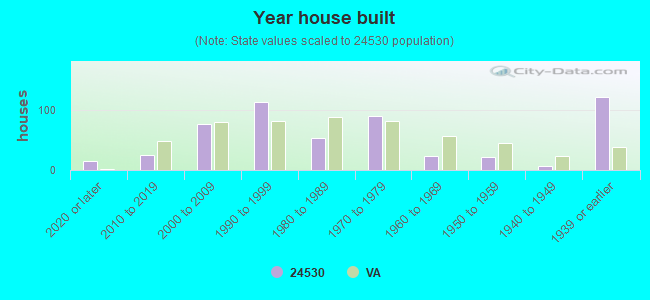


 Based on the data from the years 2002 - 2018 the average number of fire incidents per year is 11. The highest number of fires - 22 took place in 2008, and the least - 2 in 2011. The data has a declining trend.
 When looking into fire subcategories, the most incidents belonged to: Structure Fires (44.1%), and Outside Fires (38.2%).