Estimated zip code population in 2022: 5,107 Zip code population in 2010: 5,734 Zip code population in 2000: 6,146
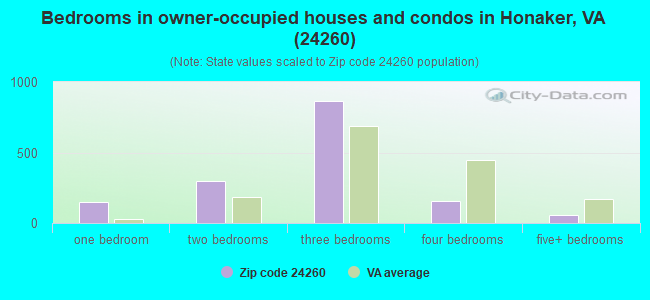
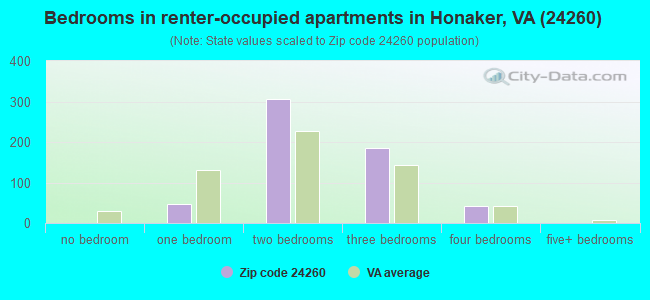
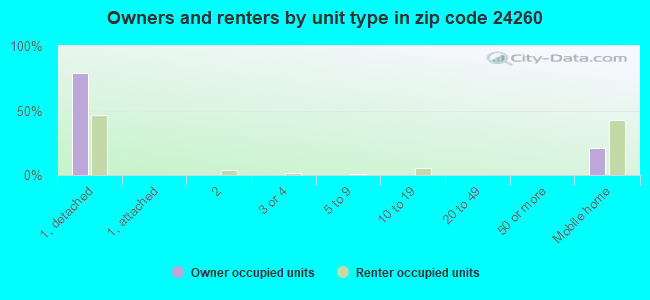
Houses and condos: 2,554 Renter-occupied apartments: 594
% of renters here:
28%
State:
33%
March 2022 cost of living index in zip code 24260: 83.0 (low, U.S. average is 100)
Land area: 79.1 sq. mi. Water area: 0.3 sq. mi.
Population density: 65 people per square mile
(very low).
OSM Map
General Map
Google Map
MSN Map
OSM Map
General Map
Google Map
MSN Map
OSM Map
General Map
Google Map
MSN Map
OSM Map
General Map
Google Map
MSN Map
Please wait while loading the map...
Real estate property taxes paid for housing units in 2022:
This zip code:
0.5% ($498)
Virginia:
0.7% ($2,617)
Median real estate property taxes paid for housing units with mortgages in 2022: $402 (0.4%) Median real estate property taxes paid for housing units with no mortgage in 2022: $553 (0.5%)
Business Search- 14 Million verified businesses
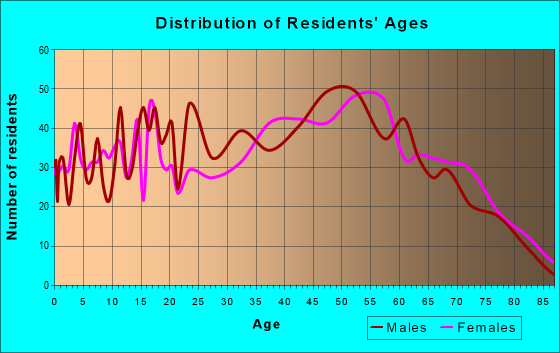
Males: 2,672
(52.3%)
Females: 2,434
(47.7%)
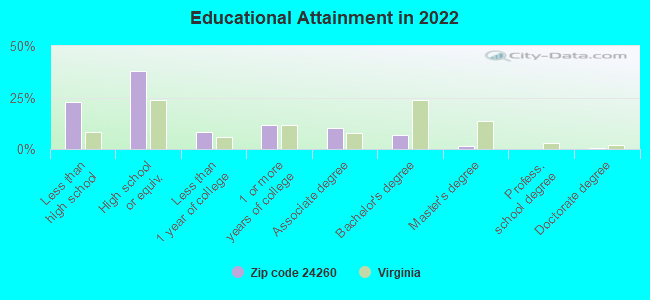
For population 25 years and over in 24260:
High school or higher: 74.7%
Bachelor's degree or higher: 8.9%
Graduate or professional degree: 2.3%
Unemployed: 3.8%
Mean travel time to work (commute): 32.0 minutes
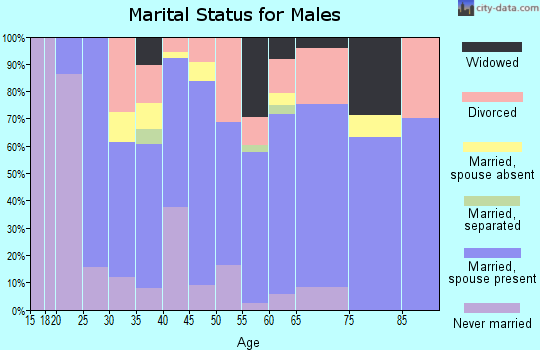
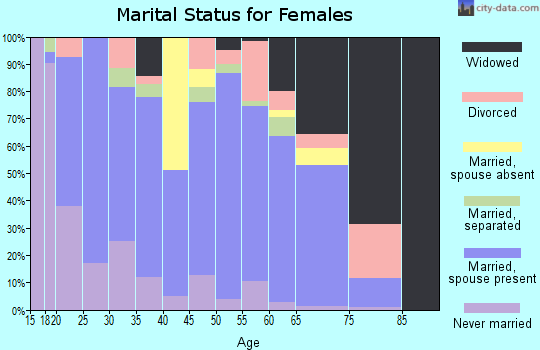
For population 15 years and over in 24260:
Never married: 23.4%
Now married: 50.9%
Separated: 1.6%
Widowed: 7.9%
Divorced: 16.1%
Zip code 24260 compared to state average:
Median household income significantly below state average.
Median house value significantly below state average.
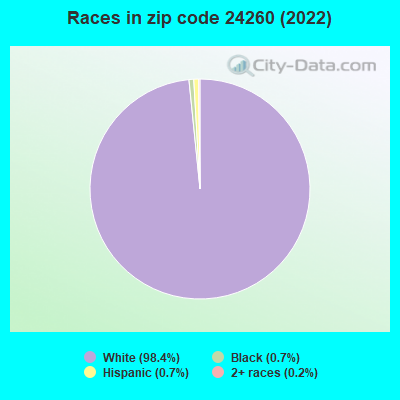
Black race population percentage significantly below state average.
Hispanic race population percentage significantly below state average.
Median age above state average.
Foreign-born population percentage significantly below state average.
Length of stay since moving in significantly above state average.
Number of college students significantly below state average.
Percentage of population with a bachelor's degree or higher significantly below state average.
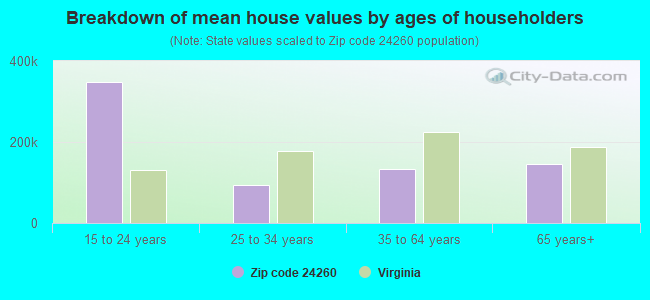
Estimated median house/condo value in 2022: $103,963
24260:
$103,963
Virginia:
$365,700
According to our research of Virginia and other state lists, there were 18 registered sex offenders living in 24260 zip code as of May 11, 2024. The ratio of all residents to sex offenders in zip code 24260 is 338 to 1. The ratio of registered sex offenders to all residents in this zip code is near the state average.
Median resident age:
This zip code:
45.1 years
Virginia median age:
39.0 years
Average household size:
This zip code:
2.4 people
Virginia:
2.5 people
Averages for the 2020 tax year for zip code 24260, filed in 2021:
Average Adjusted Gross Income (AGI) in 2020: $42,772 (Individual Income Tax Returns)
Here:
$42,772
State:
$86,446
Salary/wage: $40,017 (reported on 83.5% of returns)
Here:
$40,017
State:
$71,185
(% of AGI for various income ranges: 1136.2% for AGIs below $25k, 3372.8% for AGIs $25k-50k, 6151.3% for AGIs $50k-75k, 8721.7% for AGIs $75k-100k, 13423.3% for AGIs $100k-200k)
Taxable interest for individuals: $884 (reported on 23.4% of returns)
This zip code:
$884
Virginia:
$1,805
(% of AGI for various income ranges: 15.7% for AGIs below $25k, 30.9% for AGIs $25k-50k, 20.4% for AGIs $50k-75k, 60.8% for AGIs $75k-100k, 30.0% for AGIs $100k-200k)
Ordinary dividends: $3,175 (reported on 6.4% of returns)
Here:
$3,175
State:
$8,327
(% of AGI for various income ranges: 13.3% for AGIs $25k-50k, 27.0% for AGIs $50k-75k, 118.3% for AGIs $75k-100k, 96.7% for AGIs $100k-200k)
Net capital gain/loss in AGI: +$3,491 (reported on 5.9% of returns)
Here:
+$3,491
State:
+$24,644
(% of AGI for various income ranges: 2.1% for AGIs below $25k, 21.5% for AGIs $25k-50k, 25.8% for AGIs $75k-100k, 201.7% for AGIs $100k-200k)
Profit/loss from business: +$8,244 (reported on 9.6% of returns)
Here:
+$8,244
State:
+$12,836
(% of AGI for various income ranges: 85.3% for AGIs below $25k, 105.2% for AGIs $25k-50k, 79.6% for AGIs $50k-75k, 268.3% for AGIs $75k-100k)
Taxable individual retirement arrangement distribution: $10,630 (reported on 5.3% of returns)
24260:
$10,630
Virginia:
$21,535
(% of AGI for various income ranges: 27.9% for AGIs below $25k, 87.0% for AGIs $25k-50k, 417.5% for AGIs $75k-100k)
Taxes paid: $7,050 (reported on 1.1% of returns)
24260:
$7,050
State:
$8,284
(% of AGI for various income ranges: 30.7% for AGIs $25k-50k)
Earned income credit: $2,351 (reported on 25.0% of returns)
Here:
$2,351
State:
$2,214
(% of AGI for various income ranges: 110.9% for AGIs below $25k, 100.4% for AGIs $25k-50k)
Percentage of individuals using paid preparers for their 2020 taxes: 92.0%
Here:
92%
State:
92%
(% for various income ranges: 91.9% for AGIs below $25k, 92.6% for AGIs $25k-50k, 89.3% for AGIs $50k-75k, 93.8% for AGIs $75k-100k, 93.8% for AGIs $100k-200k)
Averages for the 2012 tax year for zip code 24260, filed in 2013:
Average Adjusted Gross Income (AGI) in 2012: $39,582 (Individual Income Tax Returns)
Here:
$39,582
State:
$71,192
Salary/wage: $36,900 (reported on 86.1% of returns)
Here:
$36,900
State:
$59,229
(% of AGI for various income ranges: 74.4% for AGIs below $25k, 84.0% for AGIs $25k-50k, 85.4% for AGIs $50k-75k, 88.9% for AGIs $75k-100k, 68.9% for AGIs $100k-200k)
Taxable interest for individuals: $1,069 (reported on 28.9% of returns)
This zip code:
$1,069
Virginia:
$1,600
(% of AGI for various income ranges: 2.1% for AGIs below $25k, 0.7% for AGIs $25k-50k, 0.7% for AGIs $50k-75k, 0.4% for AGIs $75k-100k, 0.3% for AGIs $100k-200k)
Ordinary dividends: $1,821 (reported on 7.5% of returns)
Here:
$1,821
State:
$6,959
(% of AGI for various income ranges: 0.3% for AGIs below $25k, 0.6% for AGIs $25k-50k, 0.3% for AGIs $50k-75k, 0.4% for AGIs $100k-200k)
Net capital gain/loss in AGI: +$2,636 (reported on 7.5% of returns)
Here:
+$2,636
State:
+$16,672
(% of AGI for various income ranges: 0.3% for AGIs below $25k, 0.2% for AGIs $50k-75k, 1.7% for AGIs $100k-200k)
Profit/loss from business: +$5,447 (reported on 10.2% of returns)
Here:
+$5,447
State:
+$14,116
(% of AGI for various income ranges: 5.1% for AGIs below $25k, 1.7% for AGIs $25k-50k, 0.3% for AGIs $50k-75k, 1.3% for AGIs $75k-100k)
Taxable individual retirement arrangement distribution: $7,125 (reported on 6.4% of returns)
24260:
$7,125
Virginia:
$16,667
(% of AGI for various income ranges: 1.8% for AGIs below $25k, 1.6% for AGIs $25k-50k, 2.3% for AGIs $50k-75k)
Total itemized deductions: $16,869 (18% of AGI, reported on 8.6% of returns)
Here:
$16,869
State:
$26,596
Here:
17.6% of AGI
State:
20.1% of AGI
(% of AGI for various income ranges: 3.5% for AGIs $25k-50k, 2.8% for AGIs $50k-75k, 4.9% for AGIs $75k-100k, 6.2% for AGIs $100k-200k)
Charity contributions: $5,333 (reported on 4.8% of returns)
Here:
$5,333
State:
$4,443
(% of AGI for various income ranges: 0.8% for AGIs $50k-75k, 1.1% for AGIs $75k-100k, 1.2% for AGIs $100k-200k)
Taxes paid: $5,338 (reported on 8.6% of returns)
24260:
$5,338
State:
$9,951
(% of AGI for various income ranges: 0.5% for AGIs $25k-50k, 0.8% for AGIs $50k-75k, 1.5% for AGIs $75k-100k, 2.7% for AGIs $100k-200k)
Earned income credit: $2,171 (reported on 27.8% of returns)
Here:
$2,171
State:
$2,211
(% of AGI for various income ranges: 8.0% for AGIs below $25k, 1.5% for AGIs $25k-50k)
Percentage of individuals using paid preparers for their 2012 taxes: 60.4%
Here:
60%
State:
46%
(% for various income ranges: 59.8% for AGIs below $25k, 58.7% for AGIs $25k-50k, 58.6% for AGIs $50k-75k, 64.3% for AGIs $75k-100k, 72.7% for AGIs $100k-200k)
Averages for the 2004 tax year for zip code 24260, filed in 2005:
Average Adjusted Gross Income (AGI) in 2004: $28,784 (Individual Income Tax Returns)
Here:
$28,784
State:
$56,704
Salary/wage: $27,431 (reported on 84.4% of returns)
Here:
$27,431
State:
$48,441
(% of AGI for various income ranges: 97.1% for AGIs below $10k, 78.6% for AGIs $10k-25k, 84.7% for AGIs $25k-50k, 85.2% for AGIs $50k-75k, 84.5% for AGIs $75k-100k, 38.7% for AGIs over 100k)
Taxable interest for individuals: $1,393 (reported on 39.4% of returns)
This zip code:
$1,393
Virginia:
$1,688
(% of AGI for various income ranges: 7.1% for AGIs below $10k, 3.0% for AGIs $10k-25k, 1.4% for AGIs $25k-50k, 1.2% for AGIs $50k-75k, 1.7% for AGIs $75k-100k, 1.5% for AGIs over 100k)
Taxable dividends: $2,098 (reported on 9.6% of returns)
Here:
$2,098
State:
$4,028
(% of AGI for various income ranges: 2.4% for AGIs below $10k, 0.6% for AGIs $10k-25k, 0.3% for AGIs $25k-50k, 0.5% for AGIs $50k-75k, 0.2% for AGIs $75k-100k, 3.5% for AGIs over 100k)
Net capital gain/loss: +$4,082 (reported on 6.7% of returns)
Here:
+$4,082
State:
+$14,375
(% of AGI for various income ranges: -1.2% for AGIs below $10k, 0.3% for AGIs $10k-25k, 0.8% for AGIs $25k-50k, -0.0% for AGIs $50k-75k, 0.2% for AGIs $75k-100k, 8.7% for AGIs over 100k)
Profit/loss from business: +$4,008 (reported on 11.9% of returns)
Here:
+$4,008
State:
+$13,342
(% of AGI for various income ranges: 6.2% for AGIs below $10k, 5.4% for AGIs $10k-25k, 1.5% for AGIs $25k-50k, 0.0% for AGIs $50k-75k, -0.8% for AGIs $75k-100k)
IRA payment deduction: $3,417 (reported on 1.8% of returns)
24260:
$3,417
Virginia:
$2,943
Total itemized deductions: $15,062 (21% of AGI, reported on 7.3% of returns)
Here:
$15,062
State:
$21,492
Here:
21.4% of AGI
State:
21.0% of AGI
(% of AGI for various income ranges: 2.6% for AGIs $10k-25k, 2.7% for AGIs $25k-50k, 3.7% for AGIs $50k-75k, 7.6% for AGIs $75k-100k, 8.0% for AGIs over 100k)
Charity contributions deductions: $3,922 (6% of AGI, reported on 5.1% of returns)
Here:
$3,922
State:
$3,794
Here:
5.5% of AGI
State:
3.5% of AGI
(% of AGI for various income ranges: 0.3% for AGIs $10k-25k, 0.5% for AGIs $25k-50k, 0.7% for AGIs $50k-75k, 1.4% for AGIs $75k-100k, 1.6% for AGIs over 100k)
Total tax: $3,234 (reported on 66.3% of returns)
24260:
$3,234
State:
$9,537
(% of AGI for various income ranges: 3.1% for AGIs below $10k, 3.6% for AGIs $10k-25k, 5.7% for AGIs $25k-50k, 8.5% for AGIs $50k-75k, 11.4% for AGIs $75k-100k, 17.4% for AGIs over 100k)
Earned income credit: $1,675 (reported on 26.3% of returns)
Here:
$1,675
State:
$1,734
Percentage of individuals using paid preparers for their 2004 taxes: 55.4%
Here:
55%
State:
52%
(% for various income ranges: 51.6% for AGIs below $10k, 55.2% for AGIs $10k-25k, 56.2% for AGIs $25k-50k, 56.8% for AGIs $50k-75k, 58.4% for AGIs $75k-100k, 84.6% for AGIs over 100k)
Likely homosexual households (counted as self-reported same-sex unmarried-partner households)
Lesbian couples: 0.0% of all households
Gay men: 0.1% of all households
Household received Food Stamps/SNAP in the past 12 months: 689 Household did not receive Food Stamps/SNAP in the past 12 months: 1,507
Women who had a birth in the past 12 months: 50 (17 now married, 31 unmarried) Women who did not have a birth in the past 12 months: 1,044 (590 now married, 448 unmarried)
Housing units in zip code 24260 with a mortgage: 508 (14 second mortgage, 14 both second mortgage and home equity loan) Median monthly owner costs for units with a mortgage: $841 Median monthly owner costs for units without a mortgage: $311
Residents with income below the poverty level in 2022:
This zip code:
24.5%
Whole state:
10.6%
Residents with income below 50% of the poverty level in 2022:
This zip code:
9.3%
Whole state:
5.2%
Median number of rooms in houses and condos:
Here:
6.1
State:
7.0
Median number of rooms in apartments:
Here:
4.8
State:
4.3
Notable locations in this zip code not listed on our city pages
Churches in zip code 24260 include: Austin Chapel (A), Bethany Church (B), Russell Fork Church (C), Concord Church (D), Corinth Church (E), Hubbard Chapel (F), Independence Church (G), Jacksons Chapel (H), Blackford United Methodist Church (I). Display/hide their locations on the map
Cemeteries: Stevens Cemetery (1), Sutherland Cemetery (2), Sykes Cemetery (3), Thompson Cemetery (4), Tiller Cemetery (5), Whitt Cemetery (6), Clark Cemetery (7). Display/hide their locations on the map
Streams, rivers, and creeks: Waddy Branch (A), Thompson Creek (B), Stone Branch (C), Stillhouse Branch (D), Quinn Branch (E), Puncheon Camp Branch (F), Presley Branch (G), Nance White Branch (H), McFarlane Branch (I). Display/hide their locations on the map
In group quarters: 101 (-1 institutionalized population)
Size of family households: 551 2-persons, 330 3-persons, 124 4-persons, 156 5-persons, 21 6-persons
Size of nonfamily households: 834 1-person, 99 2-persons
913 married couples with children.
193 single-parent households (30 men, 163 women).
99.3% of residents of 24260 zip code speak English at home.
0.4% of residents speak Spanish at home (100% very well).
Foreign born population: 0 (0.0%)
:
0.0%
Whole state:
12.7%
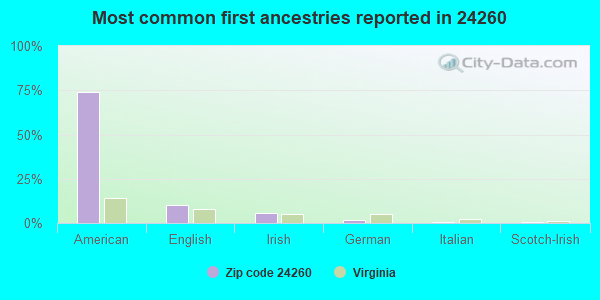
74%American
10%English
6%Irish
2%German
0%Italian
0%Scotch-Irish
0%Dutch
Facilities with environmental interests located in this zip code:
BUCHANAN CNTY PUBLIC SCHOOLS - COUNCIL ELEM & HS (STATE RT 80 in COUNCIL, VA)
AIR MINOR (AIRS/AFS) STATE MASTER (Virginia pollutants databases) - CEDS-10173, AIR PROGRAM National Pollutant Discharge Elimination System NON-MAJOR (Tracking pollutant discharge elimination systems) - permit Business SIC classification: SEWERAGE SYSTEMS; ELEMENTARY AND SECONDARY SCHOOLS Business NAICS classification: ELEMENTARY AND SECONDARY SCHOOLS. Alternative names: BUCHANAN COUNTY PUBLIC SCHOOLS/COUNCIL E, BUCHANAN CTY PUB SCHOOLS/COUNC, COUNCIL ELEM., COUNCIL ELEMENTARY SCHOOL
APPALACHIAN DETENTION CTR (ROUTE 640 in HONAKER, VA)
ENFORCEMENT/COMPLIANCE ACTIVITY (Integrated Compliance Information System) (National Center for Education Statistics) - STATE ID-9000001 Organizations: DEPARTMENT OF CORRECTIONAL EDUCATION (SCHOOL DISTRICT)
BUCHANAN CNTY PSA - COUNCIL IN (ST RT 80 in COUNCIL, VA)
National Pollutant Discharge Elimination System NON-MAJOR (Tracking pollutant discharge elimination systems) - permit Business SIC classification: SEWERAGE SYSTEMS Alternative names: BUCHANAN COUNTY PUBLIC SERVICE
COASTAL MART INCORPORATED #803 (ROUTE 80 in HONAKER, VA)
Small Quantity Generators, between 100 kg and 1000 kg of hazardous waste/month (Resource Conservation and Recovery Act (tracking hazardous waste)) - notification Organizations: OPERNAME (CONTACT/OPERATOR)
, L M HUGHEY CO (CONTACT/OWNER)
Housing units lacking complete plumbing facilities: 10.4% Housing units lacking complete kitchen facilities: 11.4%
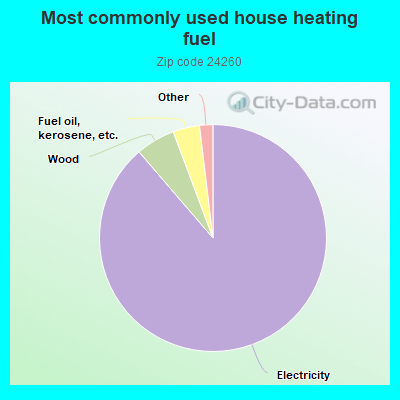
88.8%Electricity
5.6%Wood
3.8%Fuel oil, kerosene, etc.
0.8%Bottled, tank, or LP gas
0.6%Utility gas
0.5%No fuel used
Population in 1990: 6,162.
Place of birth for U.S.-born residents:
This state: 4,280
Northeast: 24
Midwest: 48
South: 706
West: 6
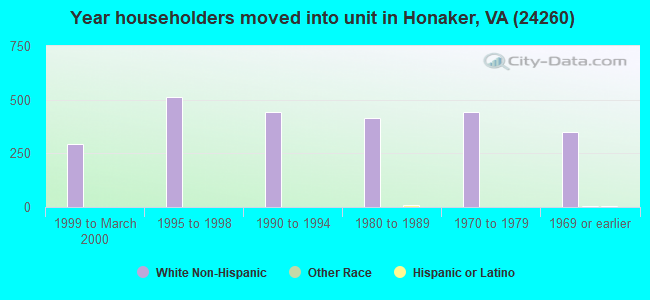
76% of the 24260 zip code residents lived in the same house 5 years ago. Out of people who lived in different houses, 75% lived in this county. Out of people who lived in different counties, 50% lived in Virginia.
96% of the 24260 zip code residents lived in the same house 1 year ago. Out of people who lived in different houses, 21% moved from this county. Out of people who lived in different houses, 87% moved from different county within same state. Out of people who lived in different houses, 3% moved from different state.
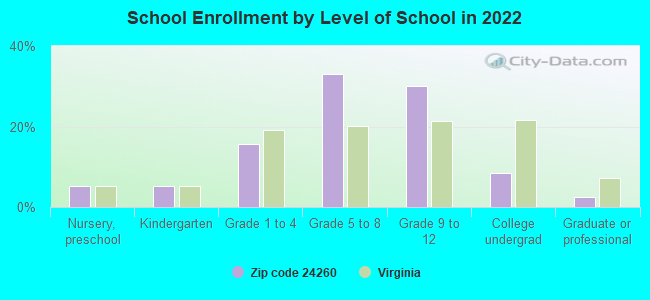
Private vs. public school enrollment:
Students in private schools in grades 1 to 8 (elementary and middle school): 4
Here:
1.6%
Virginia:
13.2%
Students in private schools in grades 9 to 12 (high school): 17
Here:
9.5%
Virginia:
10.2%
Students in private undergraduate colleges:
Here:
0.0%
Virginia:
18.7%
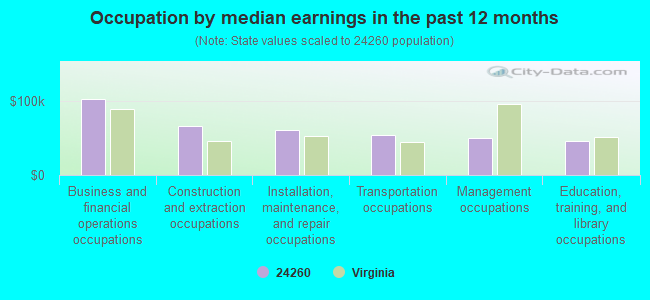
Occupation by median earnings in the past 12 months ($)
103,324Business and financial operations occupations
66,862Construction and extraction occupations
60,878Installation, maintenance, and repair occupations
53,931Transportation occupations
50,301Management occupations
46,645Education, training, and library occupations
Top industries in this zip code by the number of employees in 2005:
Health Care and Social Assistance: Home Health Care Services (20-49: 1)
Health Care and Social Assistance: Offices of Physicians (except Mental Health Specialists) (10-19: 1, 5-9: 1)
People in group quarters in 2010:
104 people in correctional residential facilities
11 people in group homes intended for adults
People in group quarters in 2000:
11 people in other noninstitutional group quarters
Fatal accident statistics in 2013:
Fatal accident count: 1
Vehicles involved in fatal accidents: 1
Fatal accidents caused by drunken drivers: 1
Fatalities: 2
Persons involved in fatal accidents: 4
Pedestrians involved in fatal accidents: 0
Fatal accident statistics in 2012:
Fatal accident count: 1
Vehicles involved in fatal accidents: 1
Fatal accidents caused by drunken drivers: 0
Fatalities: 1
Persons involved in fatal accidents: 1
Pedestrians involved in fatal accidents: 0
2003 - 2018 National Fire Incident Reporting System (NFIRS) incidents
According to the data from the years 2003 - 2018 the average number of fires per year is 13. The highest number of fire incidents - 26 took place in 2014, and the least - 4 in 2018. The data has a declining trend.
When looking into fire subcategories, the most incidents belonged to: Outside Fires (42.3%), and Structure Fires (39.9%).
Fire incident types reported to NFIRS in Zip Code 24260
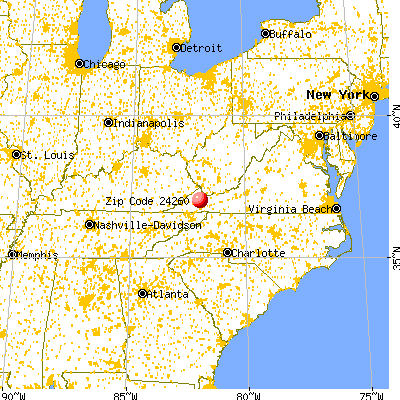


 Nearest zip codes: 24646, 24280, 24649, 24225, 24239, 24217.


 According to the data from the years 2003 - 2018 the average number of fires per year is 13. The highest number of fire incidents - 26 took place in 2014, and the least - 4 in 2018. The data has a declining trend.
 When looking into fire subcategories, the most incidents belonged to: Outside Fires (42.3%), and Structure Fires (39.9%).