Estimated zip code population in 2022: 2,289 Zip code population in 2010: 2,013 Zip code population in 2000: 2,363
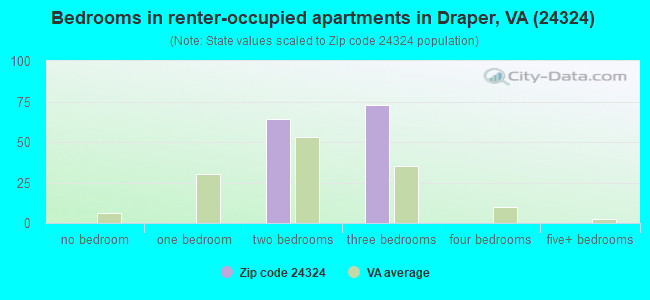
Houses and condos: 1,115 Renter-occupied apartments: 139
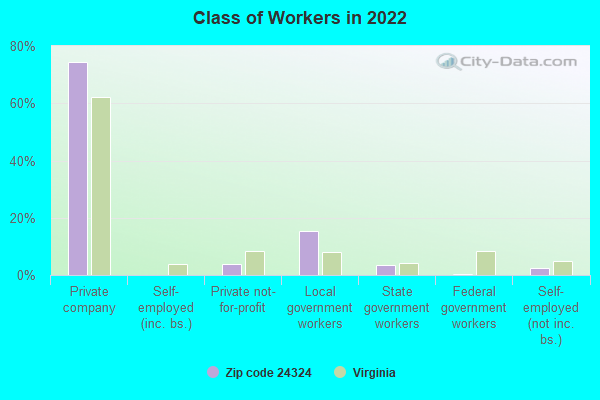
% of renters here:
14%
State:
33%
March 2022 cost of living index in zip code 24324: 83.5 (less than average, U.S. average is 100)
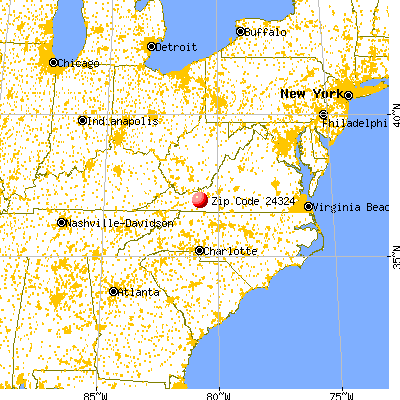
Land area: 35.0 sq. mi. Water area: 1.1 sq. mi.
Population density: 65 people per square mile
(very low).
OSM Map
General Map
Google Map
MSN Map
OSM Map
General Map
Google Map
MSN Map
OSM Map
General Map
Google Map
MSN Map
OSM Map
General Map
Google Map
MSN Map
Please wait while loading the map...
Real estate property taxes paid for housing units in 2022:
This zip code:
0.7% ($1,494)
Virginia:
0.7% ($2,617)
Median real estate property taxes paid for housing units with mortgages in 2022: $1,450 (0.7%) Median real estate property taxes paid for housing units with no mortgage in 2022: $1,863 (0.7%)
Business Search- 14 Million verified businesses
Males: 1,112
(48.6%)
Females: 1,176
(51.4%)
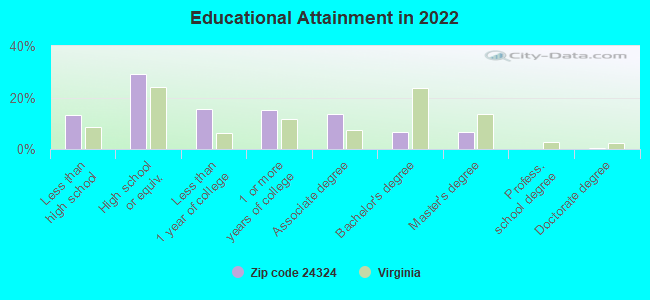
For population 25 years and over in 24324:
High school or higher: 86.2%
Bachelor's degree or higher: 13.8%
Graduate or professional degree: 7.1%
Unemployed: 1.9%
Mean travel time to work (commute): 31.3 minutes
For population 15 years and over in 24324:
Never married: 20.0%
Now married: 59.7%
Separated: 2.8%
Widowed: 7.4%
Divorced: 10.0%
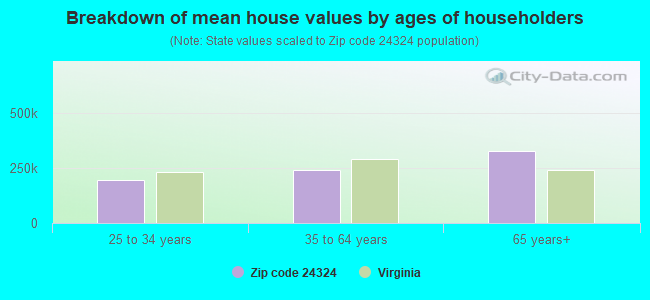
Zip code 24324 compared to state average:
Median house value below state average.
Unemployed percentage below state average.
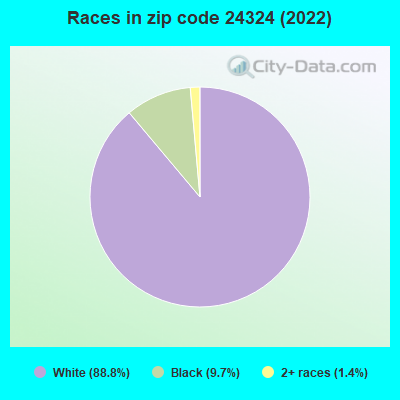
Black race population percentage below state average.
Hispanic race population percentage significantly below state average.
Median age significantly above state average.
Foreign-born population percentage significantly below state average.
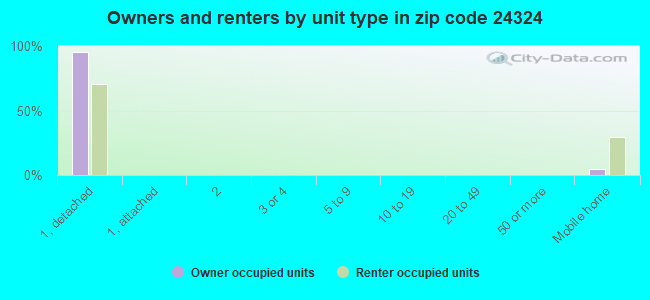
Renting percentage significantly below state average.
Length of stay since moving in significantly above state average.
Percentage of population with a bachelor's degree or higher significantly below state average.
Averages for the 2020 tax year for zip code 24324, filed in 2021:
Average Adjusted Gross Income (AGI) in 2020: $60,177 (Individual Income Tax Returns)
Here:
$60,177
State:
$86,446
Salary/wage: $51,047 (reported on 80.4% of returns)
Here:
$51,047
State:
$71,185
(% of AGI for various income ranges: 1100.5% for AGIs below $25k, 3084.0% for AGIs $25k-50k, 6296.7% for AGIs $50k-75k, 9048.6% for AGIs $75k-100k, 15210.0% for AGIs $100k-200k)
Taxable interest for individuals: $735 (reported on 26.8% of returns)
This zip code:
$735
Virginia:
$1,805
(% of AGI for various income ranges: 16.4% for AGIs below $25k, 15.5% for AGIs $25k-50k, 30.0% for AGIs $50k-75k, 17.1% for AGIs $75k-100k, 38.8% for AGIs $100k-200k)
Ordinary dividends: $3,377 (reported on 13.4% of returns)
Here:
$3,377
State:
$8,327
(% of AGI for various income ranges: 7.7% for AGIs below $25k, 18.5% for AGIs $25k-50k, 62.5% for AGIs $50k-75k, 160.0% for AGIs $100k-200k)
Net capital gain/loss in AGI: +$20,508 (reported on 12.4% of returns)
Here:
+$20,508
State:
+$24,644
(% of AGI for various income ranges: 5.9% for AGIs below $25k, 75.0% for AGIs $50k-75k, 263.8% for AGIs $100k-200k)
Profit/loss from business: +$7,536 (reported on 14.4% of returns)
Here:
+$7,536
State:
+$12,836
(% of AGI for various income ranges: 127.3% for AGIs below $25k, 111.5% for AGIs $25k-50k, 181.7% for AGIs $50k-75k, 417.5% for AGIs $100k-200k)
Taxable individual retirement arrangement distribution: $14,608 (reported on 12.4% of returns)
24324:
$14,608
Virginia:
$21,535
(% of AGI for various income ranges: 73.2% for AGIs below $25k, 209.5% for AGIs $25k-50k, 378.3% for AGIs $50k-75k, 898.8% for AGIs $100k-200k)
Total itemized deductions: $34,220 (reported on 5.2% of returns)
Here:
$34,220
State:
$33,287
(% of AGI for various income ranges: 314.5% for AGIs $25k-50k, 1352.5% for AGIs $100k-200k)
Charity contributions: $12,760 (reported on 5.2% of returns)
Here:
$12,760
State:
$10,381
(% of AGI for various income ranges: 74.0% for AGIs $25k-50k, 612.5% for AGIs $100k-200k)
Taxes paid: $7,560 (reported on 5.2% of returns)
24324:
$7,560
State:
$8,284
(% of AGI for various income ranges: 60.0% for AGIs $25k-50k, 322.5% for AGIs $100k-200k)
Earned income credit: $2,207 (reported on 14.4% of returns)
Here:
$2,207
State:
$2,214
(% of AGI for various income ranges: 89.5% for AGIs below $25k, 56.0% for AGIs $25k-50k)
Percentage of individuals using paid preparers for their 2020 taxes: 92.8%
Here:
93%
State:
92%
(% for various income ranges: 90.0% for AGIs below $25k, 92.3% for AGIs $25k-50k, 93.8% for AGIs $50k-75k, 100.0% for AGIs $75k-100k, 92.3% for AGIs $100k-200k, 100.0% for AGIs over 200k)
Averages for the 2012 tax year for zip code 24324, filed in 2013:
Average Adjusted Gross Income (AGI) in 2012: $53,960 (Individual Income Tax Returns)
Here:
$53,960
State:
$71,192
Salary/wage: $46,436 (reported on 85.4% of returns)
Here:
$46,436
State:
$59,229
(% of AGI for various income ranges: 71.0% for AGIs below $25k, 78.5% for AGIs $25k-50k, 81.0% for AGIs $50k-75k, 78.9% for AGIs $75k-100k, 101.4% for AGIs $100k-200k)
Taxable interest for individuals: $777 (reported on 33.7% of returns)
This zip code:
$777
Virginia:
$1,600
(% of AGI for various income ranges: 1.6% for AGIs below $25k, 0.5% for AGIs $25k-50k, 0.1% for AGIs $50k-75k, 0.5% for AGIs $75k-100k, 0.6% for AGIs $100k-200k)
Ordinary dividends: $2,000 (reported on 16.9% of returns)
Here:
$2,000
State:
$6,959
(% of AGI for various income ranges: 1.2% for AGIs below $25k, 0.3% for AGIs $25k-50k, 1.2% for AGIs $75k-100k, 0.9% for AGIs $100k-200k)
Net capital gain/loss in AGI: +$5,155 (reported on 12.4% of returns)
Here:
+$5,155
State:
+$16,672
(% of AGI for various income ranges: 0.2% for AGIs $75k-100k, 4.9% for AGIs $100k-200k)
Profit/loss from business: +$8,018 (reported on 12.4% of returns)
Here:
+$8,018
State:
+$14,116
(% of AGI for various income ranges: 3.9% for AGIs below $25k, 2.1% for AGIs $25k-50k, 6.2% for AGIs $75k-100k)
Taxable individual retirement arrangement distribution: $14,455 (reported on 12.4% of returns)
24324:
$14,455
Virginia:
$16,667
(% of AGI for various income ranges: 2.2% for AGIs below $25k, 3.5% for AGIs $25k-50k, 5.6% for AGIs $50k-75k, 6.2% for AGIs $100k-200k)
Total itemized deductions: $20,212 (21% of AGI, reported on 28.1% of returns)
Here:
$20,212
State:
$26,596
Here:
20.9% of AGI
State:
20.1% of AGI
(% of AGI for various income ranges: 11.6% for AGIs below $25k, 7.7% for AGIs $25k-50k, 8.0% for AGIs $50k-75k, 10.4% for AGIs $75k-100k, 12.7% for AGIs $100k-200k, 12.7% for AGIs over 200k)
Charity contributions: $4,928 (reported on 20.2% of returns)
Here:
$4,928
State:
$4,443
(% of AGI for various income ranges: 1.7% for AGIs $25k-50k, 1.0% for AGIs $50k-75k, 1.6% for AGIs $75k-100k, 4.4% for AGIs $100k-200k)
Taxes paid: $6,421 (reported on 27.0% of returns)
24324:
$6,421
State:
$9,951
(% of AGI for various income ranges: 0.9% for AGIs below $25k, 1.4% for AGIs $25k-50k, 2.1% for AGIs $50k-75k, 3.3% for AGIs $75k-100k, 4.3% for AGIs $100k-200k, 6.2% for AGIs over 200k)
Earned income credit: $2,036 (reported on 15.7% of returns)
Here:
$2,036
State:
$2,211
(% of AGI for various income ranges: 4.9% for AGIs below $25k, 1.1% for AGIs $25k-50k)
Percentage of individuals using paid preparers for their 2012 taxes: 60.7%
Here:
61%
State:
46%
(% for various income ranges: 59.4% for AGIs below $25k, 57.1% for AGIs $25k-50k, 66.7% for AGIs $50k-75k, 60.0% for AGIs $75k-100k, 77.8% for AGIs $100k-200k)
Averages for the 2004 tax year for zip code 24324, filed in 2005:
Average Adjusted Gross Income (AGI) in 2004: $40,426 (Individual Income Tax Returns)
Here:
$40,426
State:
$56,704
Salary/wage: $37,850 (reported on 86.4% of returns)
Here:
$37,850
State:
$48,441
(% of AGI for various income ranges: 128.2% for AGIs below $10k, 75.6% for AGIs $10k-25k, 83.2% for AGIs $25k-50k, 86.8% for AGIs $50k-75k, 80.8% for AGIs $75k-100k, 69.9% for AGIs over 100k)
Taxable interest for individuals: $1,054 (reported on 39.3% of returns)
This zip code:
$1,054
Virginia:
$1,688
(% of AGI for various income ranges: 3.8% for AGIs below $10k, 2.7% for AGIs $10k-25k, 0.6% for AGIs $25k-50k, 0.3% for AGIs $50k-75k, 1.1% for AGIs $75k-100k, 1.4% for AGIs over 100k)
Taxable dividends: $2,079 (reported on 16.7% of returns)
Here:
$2,079
State:
$4,028
(% of AGI for various income ranges: 3.3% for AGIs below $10k, 1.1% for AGIs $10k-25k, 0.5% for AGIs $25k-50k, 0.4% for AGIs $50k-75k, 0.4% for AGIs $75k-100k, 2.0% for AGIs over 100k)
Net capital gain/loss: +$3,664 (reported on 12.8% of returns)
Here:
+$3,664
State:
+$14,375
(% of AGI for various income ranges: -2.8% for AGIs below $10k, -0.3% for AGIs $10k-25k, 0.6% for AGIs $25k-50k, 1.0% for AGIs $50k-75k, 0.0% for AGIs $75k-100k, 3.9% for AGIs over 100k)
Profit/loss from business: +$8,838 (reported on 12.3% of returns)
Here:
+$8,838
State:
+$13,342
(% of AGI for various income ranges: 8.5% for AGIs below $10k, 4.1% for AGIs $10k-25k, 1.5% for AGIs $25k-50k, 0.5% for AGIs $50k-75k, 10.5% for AGIs $75k-100k)
IRA payment deduction: $2,765 (reported on 1.9% of returns)
24324:
$2,765
Virginia:
$2,943
Total itemized deductions: $16,432 (22% of AGI, reported on 26.1% of returns)
Here:
$16,432
State:
$21,492
Here:
22.0% of AGI
State:
21.0% of AGI
(% of AGI for various income ranges: 8.0% for AGIs $10k-25k, 9.2% for AGIs $25k-50k, 9.4% for AGIs $50k-75k, 11.5% for AGIs $75k-100k, 15.3% for AGIs over 100k)
Charity contributions deductions: $4,005 (5% of AGI, reported on 21.4% of returns)
Here:
$4,005
State:
$3,794
Here:
5.0% of AGI
State:
3.5% of AGI
(% of AGI for various income ranges: 0.6% for AGIs $10k-25k, 1.3% for AGIs $25k-50k, 1.6% for AGIs $50k-75k, 1.6% for AGIs $75k-100k, 5.0% for AGIs over 100k)
Total tax: $5,046 (reported on 77.9% of returns)
24324:
$5,046
State:
$9,537
(% of AGI for various income ranges: 2.6% for AGIs below $10k, 4.2% for AGIs $10k-25k, 6.7% for AGIs $25k-50k, 8.6% for AGIs $50k-75k, 10.6% for AGIs $75k-100k, 17.3% for AGIs over 100k)
Earned income credit: $1,482 (reported on 12.6% of returns)
Here:
$1,482
State:
$1,734
Percentage of individuals using paid preparers for their 2004 taxes: 63.1%
Here:
63%
State:
52%
(% for various income ranges: 55.6% for AGIs below $10k, 70.0% for AGIs $10k-25k, 60.9% for AGIs $25k-50k, 59.4% for AGIs $50k-75k, 69.2% for AGIs $75k-100k, 72.9% for AGIs over 100k)
Churches in zip code 24324 include: Clarks Mill Church (A), Draper Valley Church (B), Draper Slaughter Chapel (C), Pine Run Church (D), New Bethel Church (E), Pilgrims Rest Church (F). Display/hide their locations on the map
Size of family households: 220 2-persons, 113 3-persons, 161 4-persons, 8 5-persons
Size of nonfamily households: 357 1-person, 95 2-persons, 31 7-or-more-persons
158 married couples with children.
0 single-parent households ().
96.5% of residents of 24324 zip code speak English at home.
3.9% of residents speak other language at home (100% very well).
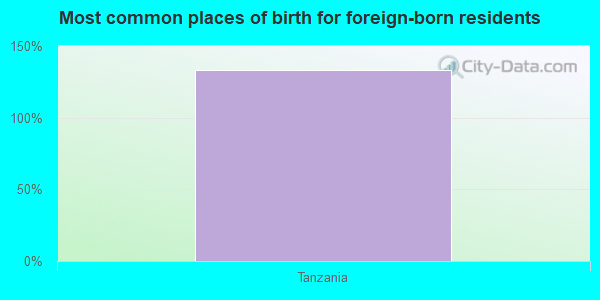
Foreign born population: 83 (3.7%) (100.0% of them are naturalized citizens)
This zip code:
3.7%
Whole state:
12.7%
132%Tanzania
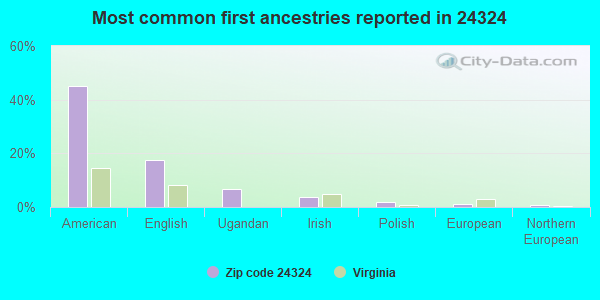
45%American
18%English
7%Ugandan
4%Irish
2%Polish
1%European
1%Northern European
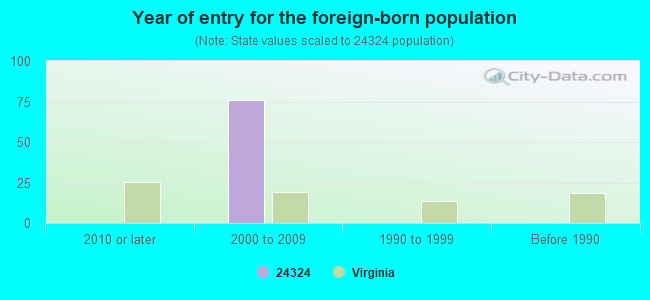
Year of entry for the foreign-born population
02010 or later
762000 to 2009
01990 to 1999
0Before 1990
Facilities with environmental interests located in this zip code:
DRAPER ELEM. (3165 OLD GREENBRIER ROAD in DRAPER, VA)
(National Center for Education Statistics) - STATE ID-0770130 Organizations: PULASKI COUNTY PUBLIC SCHOOLS (SCHOOL DISTRICT)
DRAPER ELEMENTARY SCHOOL (RT 100 in DRAPER, VA)
AIR MINOR (AIRS/AFS) Business SIC classification: ELEMENTARY AND SECONDARY SCHOOLS
Housing units lacking complete plumbing facilities: 2.0%
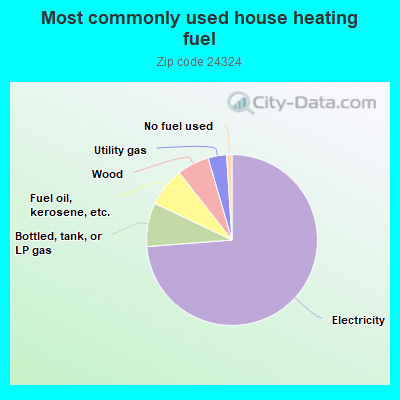
74.0%Electricity
8.3%Bottled, tank, or LP gas
7.4%Fuel oil, kerosene, etc.
6.1%Wood
3.5%Utility gas
1.0%No fuel used
Population in 1990: 1,161. Population change in the 1990s: +1,202 (+103.5%).
Place of birth for U.S.-born residents:
This state: 1,773
Northeast: 89
Midwest: 41
South: 266
West: 22
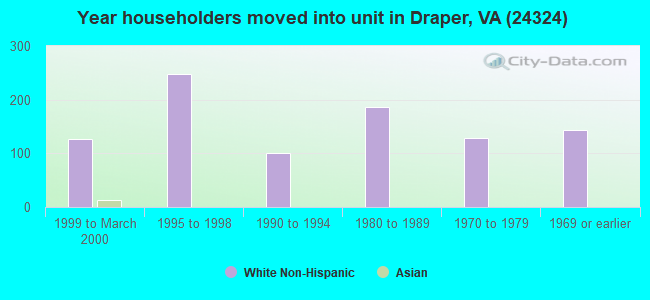
60% of the 24324 zip code residents lived in the same house 5 years ago. Out of people who lived in different houses, 74% lived in this county. Out of people who lived in different counties, 50% lived in Virginia.
94% of the 24324 zip code residents lived in the same house 1 year ago. Out of people who lived in different houses, 82% moved from this county. Out of people who lived in different houses, 15% moved from different state.
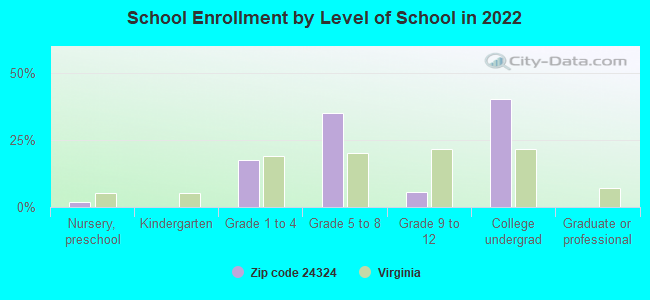
Private vs. public school enrollment:
Students in private schools in grades 1 to 8 (elementary and middle school): 9
Here:
4.1%
Virginia:
13.2%
Students in private schools in grades 9 to 12 (high school):
Here:
0.0%
Virginia:
10.2%
Students in private undergraduate colleges: 68
Here:
40.1%
Virginia:
18.7%
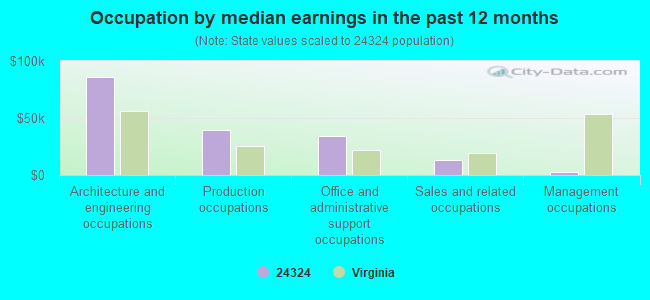
Occupation by median earnings in the past 12 months ($)
85,661Architecture and engineering occupations
39,739Production occupations
34,343Office and administrative support occupations
13,152Sales and related occupations
2,452Management occupations
Companies with federal contracts located in this zip code:
ALLEN MEEK (FO 64 RR 1 in DRAPER, VA; small business) 5 employees, $170000 revenue. : $95,000 in 3 contractsfrom 2000 to 2001
$64,000 with Forest Service (disused code: now 12C2) for Construction of Structures and Facilities -- Highways, Roads, Streets, Bridges, and Railways (includes resurfacing). Taking place in DC. Signed on 2000-02-15. Completion date: 2000-06-15.
$30,000 with Agricultural Research Service (disused code) for Fencing, Fences, Gates and Components. Taking place in WV. Signed on 2001-09-15. Completion date: 2001-11-15.
$1,000, same as above.Signed on 2001-12-15. Completion date: 2001-11-15.
Top industries in this zip code by the number of employees in 2005:
Arts, Entertainment, and Recreation: Golf Courses and Country Clubs (20-49 employees: 1 establishment)
Construction: Other Building Equipment Contractors (10-19: 1)
Professional, Scientific, and Technical Services: All Other Legal Services (5-9: 1)
Other Services (except Public Administration): Commercial and Industrial Machinery and Equipment (except Automotive and Electronic) Repair and Maintenance (5-9: 1)
Administrative and Support and Waste Management and Remediation Services: Landscaping Services (1-4: 2)
Accommodation and Food Services: Bed-and-Breakfast Inns (1-4: 1)
Other Services (except Public Administration): Religious Organizations (1-4: 1)
Construction: New Single-Family Housing Construction (except Operative Builders) (1-4: 1)
Wholesale Trade: Farm and Garden Machinery and Equipment Merchant Wholesalers (1-4: 1)
Fatal accident statistics in 2014:
Fatal accident count: 1
Vehicles involved in fatal accidents: 1
Fatal accidents caused by drunken drivers: 1
Fatalities: 1
Persons involved in fatal accidents: 1
Pedestrians involved in fatal accidents: 0
Fatal accident statistics in 2012:
Fatal accident count: 2
Vehicles involved in fatal accidents: 5
Fatal accidents caused by drunken drivers: 0
Fatalities: 2
Persons involved in fatal accidents: 10
Pedestrians involved in fatal accidents: 0
Home Mortgage Disclosure Act Aggregated Statistics For Year 2009 (Based on 2 partial tracts)
A) FHA, FSA/RHS & VA Home Purchase Loans
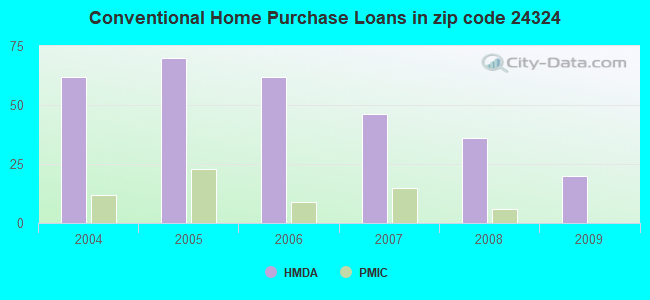
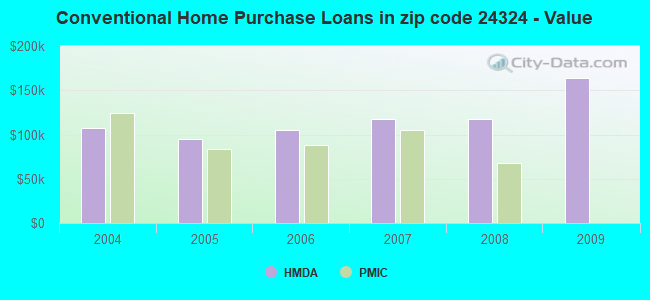
B) Conventional Home Purchase Loans
C) Refinancings
D) Home Improvement Loans
E) Loans on Dwellings For 5+ Families
F) Non-occupant Loans on < 5 Family Dwellings (A B C & D)
G) Loans On Manufactured Home Dwelling (A B C & D)
Number
Average Value
Number
Average Value
Number
Average Value
Number
Average Value
Number
Average Value
Number
Average Value
Number
Average Value
LOANS ORIGINATED
18
$94,286
20
$163,988
101
$156,035
10
$53,698
1
$325,140
14
$162,307
7
$89,907
APPLICATIONS APPROVED, NOT ACCEPTED
0
$0
2
$136,710
10
$91,015
0
$0
0
$0
0
$0
1
$64,040
APPLICATIONS DENIED
2
$125,625
6
$112,897
48
$171,731
5
$15,518
0
$0
4
$106,532
2
$77,590
APPLICATIONS WITHDRAWN
2
$77,590
2
$124,390
23
$102,812
0
$0
0
$0
0
$0
4
$77,898
FILES CLOSED FOR INCOMPLETENESS
0
$0
0
$0
6
$216,145
0
$0
0
$0
0
$0
0
$0
Aggregated Statistics For Year 2008 (Based on 2 partial tracts)
A) FHA, FSA/RHS & VA Home Purchase Loans
B) Conventional Home Purchase Loans
C) Refinancings
D) Home Improvement Loans
F) Non-occupant Loans on < 5 Family Dwellings (A B C & D)
G) Loans On Manufactured Home Dwelling (A B C & D)
Number
Average Value
Number
Average Value
Number
Average Value
Number
Average Value
Number
Average Value
Number
Average Value
LOANS ORIGINATED
11
$118,905
36
$117,276
90
$148,887
15
$28,409
17
$102,368
6
$89,497
APPLICATIONS APPROVED, NOT ACCEPTED
1
$71,430
0
$0
25
$119,268
0
$0
1
$270,950
2
$92,985
APPLICATIONS DENIED
6
$89,497
14
$104,862
117
$104,044
23
$70,255
10
$126,362
30
$90,646
APPLICATIONS WITHDRAWN
0
$0
1
$56,650
33
$106,477
6
$202,188
5
$73,896
2
$168,730
FILES CLOSED FOR INCOMPLETENESS
1
$160,110
1
$141,630
5
$234,250
1
$22,170
0
$0
1
$141,630
Aggregated Statistics For Year 2007 (Based on 2 partial tracts)
A) FHA, FSA/RHS & VA Home Purchase Loans
B) Conventional Home Purchase Loans
C) Refinancings
D) Home Improvement Loans
F) Non-occupant Loans on < 5 Family Dwellings (A B C & D)
G) Loans On Manufactured Home Dwelling (A B C & D)
Number
Average Value
Number
Average Value
Number
Average Value
Number
Average Value
Number
Average Value
Number
Average Value
LOANS ORIGINATED
20
$113,615
46
$117,939
100
$128,752
17
$45,279
21
$70,319
12
$91,754
APPLICATIONS APPROVED, NOT ACCEPTED
1
$68,970
7
$92,019
18
$62,059
1
$61,580
2
$56,655
1
$71,430
APPLICATIONS DENIED
4
$76,360
27
$58,433
115
$121,254
16
$62,504
2
$58,500
22
$76,359
APPLICATIONS WITHDRAWN
2
$83,750
7
$65,274
36
$112,828
0
$0
0
$0
1
$110,840
FILES CLOSED FOR INCOMPLETENESS
0
$0
1
$92,370
10
$99,390
0
$0
0
$0
0
$0
Aggregated Statistics For Year 2006 (Based on 2 partial tracts)
A) FHA, FSA/RHS & VA Home Purchase Loans
B) Conventional Home Purchase Loans
C) Refinancings
D) Home Improvement Loans
F) Non-occupant Loans on < 5 Family Dwellings (A B C & D)
G) Loans On Manufactured Home Dwelling (A B C & D)
Number
Average Value
Number
Average Value
Number
Average Value
Number
Average Value
Number
Average Value
Number
Average Value
LOANS ORIGINATED
27
$84,707
62
$104,765
103
$109,134
28
$45,657
25
$119,170
28
$71,389
APPLICATIONS APPROVED, NOT ACCEPTED
6
$80,670
5
$118,480
21
$63,867
2
$17,240
2
$86,210
2
$73,280
APPLICATIONS DENIED
1
$156,410
33
$52,585
90
$91,713
17
$18,909
6
$94,833
28
$69,629
APPLICATIONS WITHDRAWN
0
$0
4
$71,432
65
$105,406
2
$8,005
1
$347,310
2
$92,985
FILES CLOSED FOR INCOMPLETENESS
1
$68,970
2
$108,380
9
$171,329
0
$0
1
$277,110
1
$84,980
Aggregated Statistics For Year 2005 (Based on 2 partial tracts)
A) FHA, FSA/RHS & VA Home Purchase Loans
B) Conventional Home Purchase Loans
C) Refinancings
D) Home Improvement Loans
F) Non-occupant Loans on < 5 Family Dwellings (A B C & D)
G) Loans On Manufactured Home Dwelling (A B C & D)
Number
Average Value
Number
Average Value
Number
Average Value
Number
Average Value
Number
Average Value
Number
Average Value
LOANS ORIGINATED
20
$101,976
70
$95,167
90
$97,652
17
$27,095
26
$80,859
17
$63,174
APPLICATIONS APPROVED, NOT ACCEPTED
2
$86,210
15
$56,736
25
$62,467
4
$21,245
4
$26,480
9
$67,191
APPLICATIONS DENIED
1
$66,510
26
$52,817
101
$78,505
15
$12,398
6
$46,390
33
$63,372
APPLICATIONS WITHDRAWN
0
$0
7
$154,126
53
$101,805
14
$39,851
2
$88,060
2
$87,445
FILES CLOSED FOR INCOMPLETENESS
1
$86,210
2
$235,235
6
$81,902
0
$0
1
$73,900
0
$0
Aggregated Statistics For Year 2004 (Based on 2 partial tracts)
A) FHA, FSA/RHS & VA Home Purchase Loans
B) Conventional Home Purchase Loans
C) Refinancings
D) Home Improvement Loans
E) Loans on Dwellings For 5+ Families
F) Non-occupant Loans on < 5 Family Dwellings (A B C & D)
G) Loans On Manufactured Home Dwelling (A B C & D)
Detailed PMIC statistics for the following Tracts:2104.00
2003 - 2018 National Fire Incident Reporting System (NFIRS) incidents
Based on the data from the years 2003 - 2018 the average number of fires per year is 16. The highest number of fire incidents - 30 took place in 2004, and the least - 1 in 2016. The data has a decreasing trend.
When looking into fire subcategories, the most reports belonged to: Outside Fires (43.1%), and Structure Fires (28.2%).
Fire incident types reported to NFIRS in Zip Code 24324


 Nearest zip codes: 24313, 24301, 24347, 24360, 24084, 24312.


 Based on the data from the years 2003 - 2018 the average number of fires per year is 16. The highest number of fire incidents - 30 took place in 2004, and the least - 1 in 2016. The data has a decreasing trend.
 When looking into fire subcategories, the most reports belonged to: Outside Fires (43.1%), and Structure Fires (28.2%).