Estimated zip code population in 2022: 1,257 Zip code population in 2010: 1,931 Zip code population in 2000: 1,865
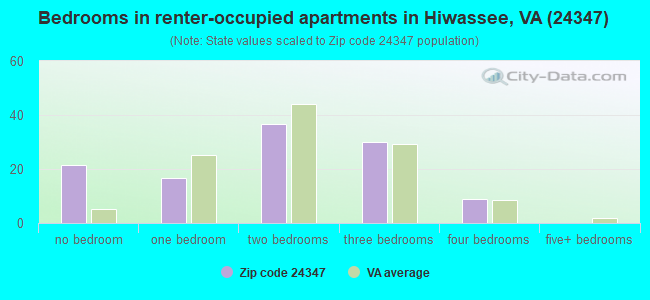
Houses and condos: 969 Renter-occupied apartments: 112
% of renters here:
17%
State:
33%
March 2022 cost of living index in zip code 24347: 82.8 (low, U.S. average is 100)
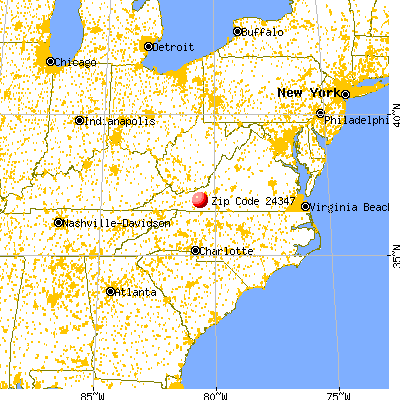
Land area: 79.4 sq. mi. Water area: 1.8 sq. mi.
Population density: 16 people per square mile
(very low).
OSM Map
General Map
Google Map
MSN Map
OSM Map
General Map
Google Map
MSN Map
OSM Map
General Map
Google Map
MSN Map
OSM Map
General Map
Google Map
MSN Map
Please wait while loading the map...
Real estate property taxes paid for housing units in 2022:
This zip code:
0.6% ($941)
Virginia:
0.7% ($2,617)
Median real estate property taxes paid for housing units with mortgages in 2022: $1,052 (0.6%) Median real estate property taxes paid for housing units with no mortgage in 2022: $751 (0.7%)
Business Search- 14 Million verified businesses
Males: 686
(54.6%)
Females: 570
(45.4%)
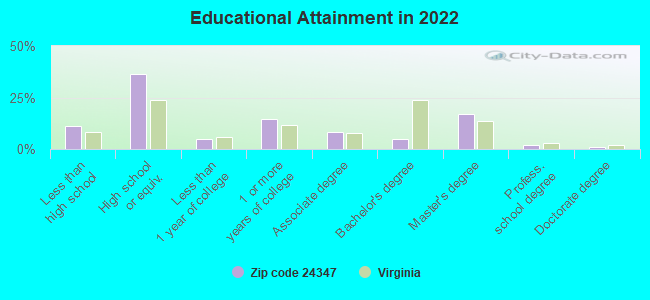
For population 25 years and over in 24347:
High school or higher: 87.8%
Bachelor's degree or higher: 24.5%
Graduate or professional degree: 19.9%
Unemployed: 2.1%
Mean travel time to work (commute): 30.2 minutes
For population 15 years and over in 24347:
Never married: 14.9%
Now married: 45.8%
Separated: 1.6%
Widowed: 18.9%
Divorced: 18.7%
Zip code 24347 compared to state average:
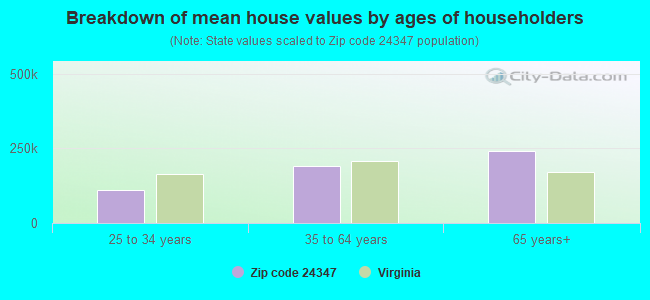
Median house value significantly below state average.
Unemployed percentage below state average.
Black race population percentage significantly below state average.
Hispanic race population percentage significantly below state average.
Median age above state average.
Foreign-born population percentage significantly below state average.
Renting percentage below state average.
Length of stay since moving in significantly above state average.
Number of college students significantly below state average.
Percentage of population with a bachelor's degree or higher below state average.
Averages for the 2020 tax year for zip code 24347, filed in 2021:
Average Adjusted Gross Income (AGI) in 2020: $52,952 (Individual Income Tax Returns)
Here:
$52,952
State:
$86,446
Salary/wage: $48,989 (reported on 82.5% of returns)
Here:
$48,989
State:
$71,185
(% of AGI for various income ranges: 1127.5% for AGIs below $25k, 3376.5% for AGIs $25k-50k, 6399.0% for AGIs $50k-75k, 10243.3% for AGIs $75k-100k, 19655.0% for AGIs $100k-200k)
Taxable interest for individuals: $506 (reported on 21.2% of returns)
This zip code:
$506
Virginia:
$1,805
(% of AGI for various income ranges: 20.5% for AGIs below $25k, 12.4% for AGIs $25k-50k, 7.0% for AGIs $50k-75k, 8.3% for AGIs $75k-100k, 20.0% for AGIs $100k-200k)
Ordinary dividends: $2,250 (reported on 10.0% of returns)
Here:
$2,250
State:
$8,327
(% of AGI for various income ranges: 26.5% for AGIs $25k-50k, 64.0% for AGIs $50k-75k, 118.3% for AGIs $100k-200k)
Net capital gain/loss in AGI: +$4,625 (reported on 10.0% of returns)
Here:
+$4,625
State:
+$24,644
(% of AGI for various income ranges: 221.0% for AGIs $50k-75k, 256.7% for AGIs $100k-200k)
Profit/loss from business: +$7,200 (reported on 10.0% of returns)
Here:
+$7,200
State:
+$12,836
(% of AGI for various income ranges: 129.5% for AGIs below $25k, 48.8% for AGIs $25k-50k, 390.0% for AGIs $100k-200k)
Taxable individual retirement arrangement distribution: $14,171 (reported on 8.8% of returns)
24347:
$14,171
Virginia:
$21,535
(% of AGI for various income ranges: 254.7% for AGIs $25k-50k, 559.0% for AGIs $50k-75k)
Total itemized deductions: $29,367 (reported on 3.8% of returns)
Here:
$29,367
State:
$33,287
(% of AGI for various income ranges: 1468.3% for AGIs $75k-100k)
Charity contributions: $13,250 (reported on 2.5% of returns)
Here:
$13,250
State:
$10,381
(% of AGI for various income ranges: 265.0% for AGIs $50k-75k)
Taxes paid: $6,025 (reported on 5.0% of returns)
24347:
$6,025
State:
$8,284
(% of AGI for various income ranges: 401.7% for AGIs $75k-100k)
Earned income credit: $2,215 (reported on 16.2% of returns)
Here:
$2,215
State:
$2,214
(% of AGI for various income ranges: 83.0% for AGIs below $25k, 71.8% for AGIs $25k-50k)
Percentage of individuals using paid preparers for their 2020 taxes: 95.0%
Here:
95%
State:
92%
(% for various income ranges: 96.3% for AGIs below $25k, 95.2% for AGIs $25k-50k, 92.3% for AGIs $50k-75k, 100.0% for AGIs $75k-100k, 90.0% for AGIs $100k-200k)
Averages for the 2012 tax year for zip code 24347, filed in 2013:
Average Adjusted Gross Income (AGI) in 2012: $44,284 (Individual Income Tax Returns)
Here:
$44,284
State:
$71,192
Salary/wage: $38,968 (reported on 85.5% of returns)
Here:
$38,968
State:
$59,229
(% of AGI for various income ranges: 73.4% for AGIs below $25k, 81.6% for AGIs $25k-50k, 82.7% for AGIs $50k-75k, 81.8% for AGIs $75k-100k, 57.1% for AGIs $100k-200k)
Taxable interest for individuals: $570 (reported on 30.3% of returns)
This zip code:
$570
Virginia:
$1,600
(% of AGI for various income ranges: 1.4% for AGIs below $25k, 0.2% for AGIs $25k-50k, 0.4% for AGIs $50k-75k, 0.1% for AGIs $75k-100k, 0.2% for AGIs $100k-200k)
Ordinary dividends: $1,088 (reported on 10.5% of returns)
Here:
$1,088
State:
$6,959
Net capital gain/loss in AGI: +$8,020 (reported on 6.6% of returns)
Here:
+$8,020
State:
+$16,672
Profit/loss from business: +$6,450 (reported on 13.2% of returns)
Here:
+$6,450
State:
+$14,116
Taxable individual retirement arrangement distribution: $13,171 (reported on 9.2% of returns)
24347:
$13,171
Virginia:
$16,667
(% of AGI for various income ranges: 2.4% for AGIs below $25k, 3.2% for AGIs $25k-50k, 7.0% for AGIs $50k-75k)
Total itemized deductions: $17,400 (22% of AGI, reported on 22.4% of returns)
Here:
$17,400
State:
$26,596
Here:
21.6% of AGI
State:
20.1% of AGI
(% of AGI for various income ranges: 9.2% for AGIs below $25k, 5.3% for AGIs $25k-50k, 8.1% for AGIs $50k-75k, 9.7% for AGIs $75k-100k, 11.5% for AGIs $100k-200k)
Charity contributions: $4,067 (reported on 15.8% of returns)
Here:
$4,067
State:
$4,443
(% of AGI for various income ranges: 1.9% for AGIs below $25k, 0.9% for AGIs $50k-75k, 1.8% for AGIs $75k-100k, 2.7% for AGIs $100k-200k)
Taxes paid: $5,235 (reported on 22.4% of returns)
24347:
$5,235
State:
$9,951
(% of AGI for various income ranges: 1.0% for AGIs below $25k, 1.2% for AGIs $25k-50k, 2.3% for AGIs $50k-75k, 2.9% for AGIs $75k-100k, 4.7% for AGIs $100k-200k)
Earned income credit: $2,293 (reported on 18.4% of returns)
Here:
$2,293
State:
$2,211
(% of AGI for various income ranges: 6.4% for AGIs below $25k, 1.1% for AGIs $25k-50k)
Percentage of individuals using paid preparers for their 2012 taxes: 64.5%
Here:
64%
State:
46%
(% for various income ranges: 61.3% for AGIs below $25k, 64.7% for AGIs $25k-50k, 66.7% for AGIs $50k-75k, 62.5% for AGIs $75k-100k, 80.0% for AGIs $100k-200k)
Averages for the 2004 tax year for zip code 24347, filed in 2005:
Average Adjusted Gross Income (AGI) in 2004: $36,005 (Individual Income Tax Returns)
Here:
$36,005
State:
$56,704
Salary/wage: $33,189 (reported on 87.7% of returns)
Here:
$33,189
State:
$48,441
(% of AGI for various income ranges: 84.6% for AGIs below $10k, 76.3% for AGIs $10k-25k, 86.8% for AGIs $25k-50k, 90.3% for AGIs $50k-75k, 99.3% for AGIs $75k-100k)
Taxable interest for individuals: $976 (reported on 34.4% of returns)
This zip code:
$976
Virginia:
$1,688
(% of AGI for various income ranges: 1.1% for AGIs below $10k, 3.1% for AGIs $10k-25k, 0.6% for AGIs $25k-50k, 0.3% for AGIs $50k-75k, 1.4% for AGIs $75k-100k)
Taxable dividends: $1,381 (reported on 11.3% of returns)
Here:
$1,381
State:
$4,028
(% of AGI for various income ranges: 0.4% for AGIs $10k-25k, 0.2% for AGIs $25k-50k, 0.1% for AGIs $50k-75k, 1.9% for AGIs $75k-100k)
Net capital gain/loss: +$3,273 (reported on 8.9% of returns)
Here:
+$3,273
State:
+$14,375
(% of AGI for various income ranges: 0.0% for AGIs $10k-25k, 0.2% for AGIs $25k-50k, 0.0% for AGIs $50k-75k, 4.7% for AGIs $75k-100k)
Profit/loss from business: +$6,063 (reported on 10.6% of returns)
Here:
+$6,063
State:
+$13,342
IRA payment deduction: $2,800 (reported on 1.3% of returns)
24347:
$2,800
Virginia:
$2,943
Total itemized deductions: $14,639 (22% of AGI, reported on 21.3% of returns)
Here:
$14,639
State:
$21,492
Here:
22.5% of AGI
State:
21.0% of AGI
(% of AGI for various income ranges: 6.0% for AGIs $10k-25k, 6.2% for AGIs $25k-50k, 9.8% for AGIs $50k-75k, 11.9% for AGIs $75k-100k, 14.2% for AGIs over 100k)
Charity contributions deductions: $3,213 (5% of AGI, reported on 16.4% of returns)
Here:
$3,213
State:
$3,794
Here:
4.7% of AGI
State:
3.5% of AGI
(% of AGI for various income ranges: 0.6% for AGIs $10k-25k, 0.8% for AGIs $25k-50k, 1.5% for AGIs $50k-75k, 2.2% for AGIs $75k-100k, 4.1% for AGIs over 100k)
Total tax: $3,883 (reported on 75.1% of returns)
24347:
$3,883
State:
$9,537
(% of AGI for various income ranges: 2.0% for AGIs below $10k, 4.0% for AGIs $10k-25k, 6.3% for AGIs $25k-50k, 8.0% for AGIs $50k-75k, 10.3% for AGIs $75k-100k, 19.0% for AGIs over 100k)
Earned income credit: $1,624 (reported on 15.8% of returns)
Here:
$1,624
State:
$1,734
Percentage of individuals using paid preparers for their 2004 taxes: 65.8%
Here:
66%
State:
52%
(% for various income ranges: 52.4% for AGIs below $10k, 65.6% for AGIs $10k-25k, 72.3% for AGIs $25k-50k, 65.4% for AGIs $50k-75k, 85.7% for AGIs $75k-100k)
Household received Food Stamps/SNAP in the past 12 months: 77 Household did not receive Food Stamps/SNAP in the past 12 months: 588
Women who had a birth in the past 12 months: 44 (45 now married, 0 unmarried) Women who did not have a birth in the past 12 months: 153 (38 now married, 116 unmarried)
Housing units in zip code 24347 with a mortgage: 316 (15 second mortgage) Median monthly owner costs for units with a mortgage: $917 Median monthly owner costs for units without a mortgage: $289
Residents with income below the poverty level in 2022:
This zip code:
18.8%
Whole state:
10.6%
Residents with income below 50% of the poverty level in 2022:
This zip code:
16.1%
Whole state:
5.2%
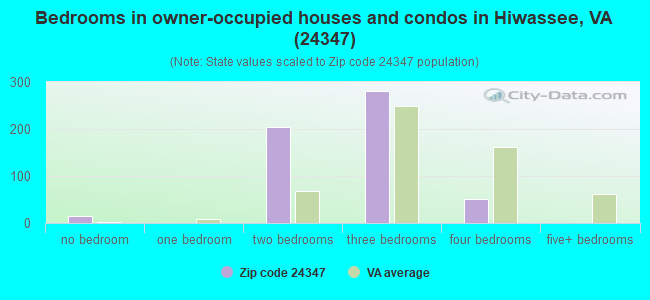
Median number of rooms in houses and condos:
Here:
5.3
State:
7.0
Median number of rooms in apartments:
Here:
4.7
State:
4.3
Notable locations in this zip code not listed on our city pages
Churches in zip code 24347 include: Reed Island Church (A), Bethel Church (B), Cecils Church (C), Snowville Church (D), Cypress Grove Church (E), Dry Pond Church (F), Farris Mines Church (G), Johnson Chapel (H), Wilson Grove Church (I). Display/hide their locations on the map
Cemeteries: Cecil Cemetery (1), Dry Pond Cemetery (2), Hurst Cemetery (3), Snowville Cemetery (4), Cecil Chapel Cemetery (5). Display/hide their locations on the map
Streams, rivers, and creeks: Wolf Spring Branch (A), White Oak Camp Branch (B), Sugar Run (C), Spencer Branch (D), Rock Creek (E), Puncheoncamp Branch (F), Maple Branch (G), Little Macks Creek (H), Little Laurel Creek (I). Display/hide their locations on the map
Size of family households: 293 2-persons, 46 3-persons, 66 4-persons
Size of nonfamily households: 243 1-person, 14 2-persons
96 married couples with children.
80 single-parent households (42 men, 38 women).
99.2% of residents of 24347 zip code speak English at home.
0.8% of residents speak other Indo-European language at home (100% very well).
Foreign born population: 0 (0.0%)
:
0.0%
Whole state:
12.7%
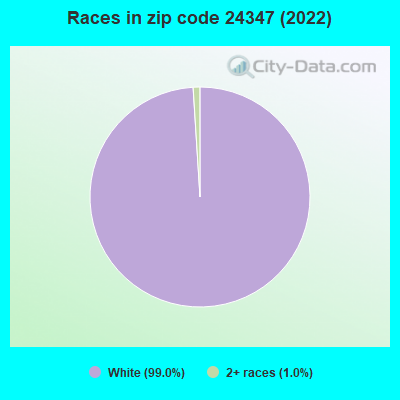
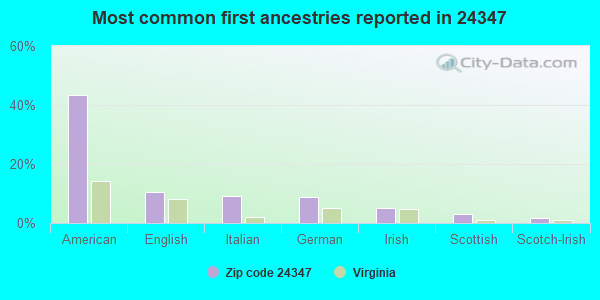
43%American
11%English
9%Italian
9%German
5%Irish
3%Scottish
2%Scotch-Irish
Housing units lacking complete plumbing facilities: 17.7% Housing units lacking complete kitchen facilities: 12.4%
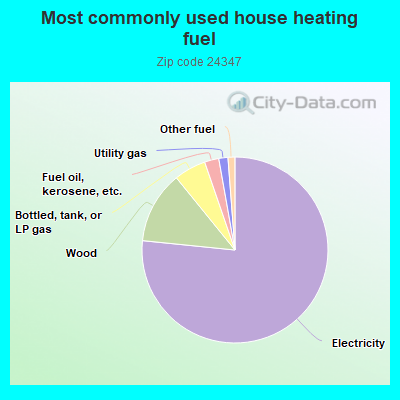
77.0%Electricity
12.6%Wood
5.6%Bottled, tank, or LP gas
2.5%Fuel oil, kerosene, etc.
1.6%Utility gas
1.2%Other fuel
Population in 1990: 2,062.
Place of birth for U.S.-born residents:
This state: 841
Northeast: 39
Midwest: 121
South: 216
West: 31
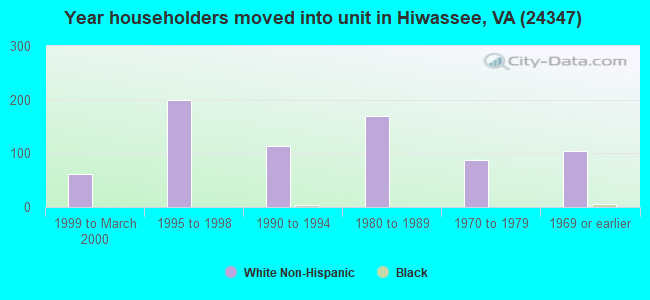
69% of the 24347 zip code residents lived in the same house 5 years ago. Out of people who lived in different houses, 59% lived in this county. Out of people who lived in different counties, 50% lived in Virginia.
89% of the 24347 zip code residents lived in the same house 1 year ago. Out of people who lived in different houses, 90% moved from this county.
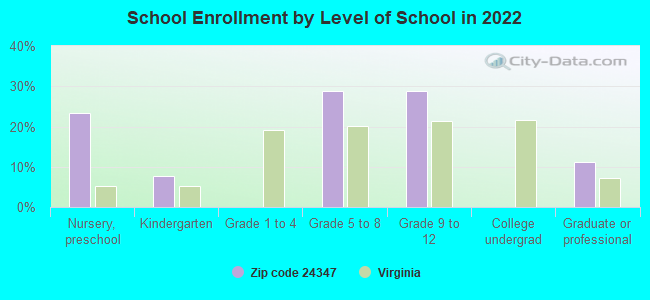
Private vs. public school enrollment:
Students in private schools in grades 1 to 8 (elementary and middle school):
Here:
0.0%
Virginia:
13.2%
Students in private schools in grades 9 to 12 (high school):
Here:
0.0%
Virginia:
10.2%
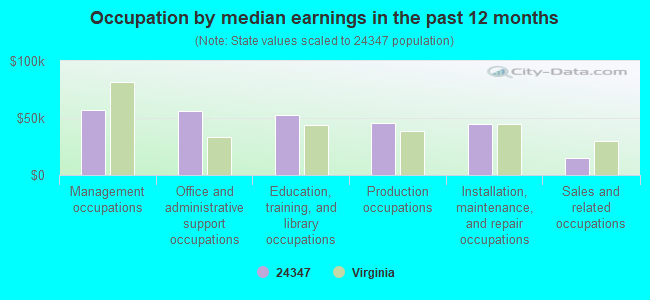
Occupation by median earnings in the past 12 months ($)
57,327Management occupations
55,899Office and administrative support occupations
52,598Education, training, and library occupations
45,874Production occupations
44,577Installation, maintenance, and repair occupations
14,877Sales and related occupations
Top industries in this zip code by the number of employees in 2005:
Accommodation and Food Services: Recreational and Vacation Camps (except Campgrounds) (10-19 employees: 1 establishment, 5-9 employees: 1 establishment)
Construction: Poured Concrete Foundation and Structure Contractors (10-19: 1)
Other Services (except Public Administration): Religious Organizations (5-9: 1)
Construction: Highway, Street, and Bridge Construction (5-9: 1)
Construction: Site Preparation Contractors (1-4: 1)
Construction: New Single-Family Housing Construction (except Operative Builders) (1-4: 1)
Other Services (except Public Administration): Commercial and Industrial Machinery and Equipment (except Automotive and Electronic) Repair and Maintenance (1-4: 1)
Home Mortgage Disclosure Act Aggregated Statistics For Year 2009 (Based on 2 partial tracts)
A) FHA, FSA/RHS & VA Home Purchase Loans
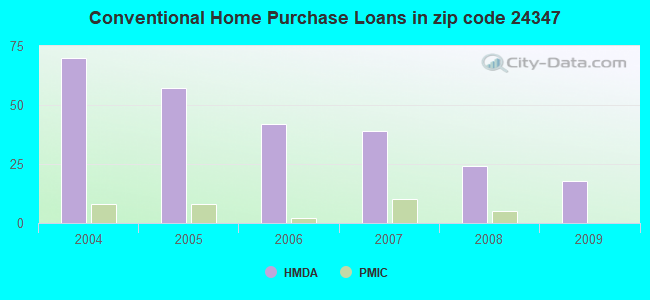
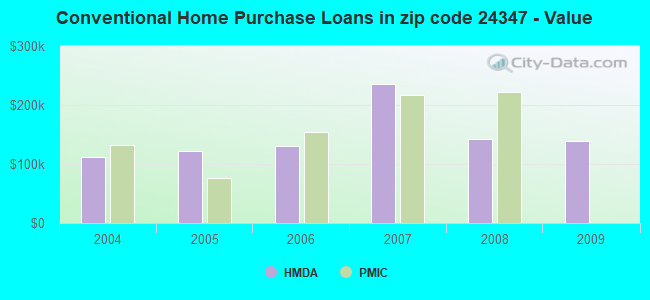
B) Conventional Home Purchase Loans
C) Refinancings
D) Home Improvement Loans
F) Non-occupant Loans on < 5 Family Dwellings (A B C & D)
G) Loans On Manufactured Home Dwelling (A B C & D)
Number
Average Value
Number
Average Value
Number
Average Value
Number
Average Value
Number
Average Value
Number
Average Value
LOANS ORIGINATED
11
$175,026
18
$139,048
91
$178,257
13
$47,568
29
$196,073
16
$118,189
APPLICATIONS APPROVED, NOT ACCEPTED
0
$0
2
$99,530
5
$78,970
0
$0
2
$99,530
0
$0
APPLICATIONS DENIED
3
$138,143
0
$0
47
$146,358
2
$32,630
5
$161,528
7
$85,776
APPLICATIONS WITHDRAWN
0
$0
3
$68,527
21
$192,607
2
$48,950
3
$57,650
2
$62,815
FILES CLOSED FOR INCOMPLETENESS
0
$0
0
$0
5
$75,380
0
$0
0
$0
2
$67,710
Aggregated Statistics For Year 2008 (Based on 2 partial tracts)
A) FHA, FSA/RHS & VA Home Purchase Loans
B) Conventional Home Purchase Loans
C) Refinancings
D) Home Improvement Loans
F) Non-occupant Loans on < 5 Family Dwellings (A B C & D)
G) Loans On Manufactured Home Dwelling (A B C & D)
Number
Average Value
Number
Average Value
Number
Average Value
Number
Average Value
Number
Average Value
Number
Average Value
LOANS ORIGINATED
15
$116,496
24
$142,425
49
$149,474
10
$30,021
16
$195,180
15
$84,843
APPLICATIONS APPROVED, NOT ACCEPTED
0
$0
5
$292,056
16
$122,676
2
$134,605
5
$189,266
8
$46,909
APPLICATIONS DENIED
3
$81,037
2
$73,420
60
$146,871
10
$60,043
2
$106,055
10
$87,943
APPLICATIONS WITHDRAWN
0
$0
3
$97,897
11
$157,820
0
$0
5
$215,698
0
$0
FILES CLOSED FOR INCOMPLETENESS
0
$0
0
$0
0
$0
0
$0
0
$0
0
$0
Aggregated Statistics For Year 2007 (Based on 2 partial tracts)
A) FHA, FSA/RHS & VA Home Purchase Loans
B) Conventional Home Purchase Loans
C) Refinancings
D) Home Improvement Loans
F) Non-occupant Loans on < 5 Family Dwellings (A B C & D)
G) Loans On Manufactured Home Dwelling (A B C & D)
Number
Average Value
Number
Average Value
Number
Average Value
Number
Average Value
Number
Average Value
Number
Average Value
LOANS ORIGINATED
7
$108,384
39
$236,247
82
$141,054
20
$25,780
24
$231,551
16
$98,712
APPLICATIONS APPROVED, NOT ACCEPTED
0
$0
7
$167,356
18
$95,992
2
$18,765
0
$0
8
$75,258
APPLICATIONS DENIED
2
$116,660
10
$155,655
69
$114,969
11
$35,747
2
$48,950
24
$75,393
APPLICATIONS WITHDRAWN
3
$82,123
2
$61,185
24
$118,155
0
$0
0
$0
2
$24,475
FILES CLOSED FOR INCOMPLETENESS
0
$0
0
$0
5
$195,466
0
$0
0
$0
0
$0
Aggregated Statistics For Year 2006 (Based on 2 partial tracts)
A) FHA, FSA/RHS & VA Home Purchase Loans
B) Conventional Home Purchase Loans
C) Refinancings
D) Home Improvement Loans
F) Non-occupant Loans on < 5 Family Dwellings (A B C & D)
G) Loans On Manufactured Home Dwelling (A B C & D)
Number
Average Value
Number
Average Value
Number
Average Value
Number
Average Value
Number
Average Value
Number
Average Value
LOANS ORIGINATED
10
$104,912
42
$130,839
90
$136,293
21
$60,525
21
$198,356
28
$77,093
APPLICATIONS APPROVED, NOT ACCEPTED
0
$0
7
$40,557
13
$79,572
3
$95,720
0
$0
8
$46,705
APPLICATIONS DENIED
3
$84,843
7
$45,684
70
$92,232
16
$42,014
2
$212,110
34
$44,629
APPLICATIONS WITHDRAWN
0
$0
8
$104,626
38
$85,187
0
$0
2
$66,080
13
$59,867
FILES CLOSED FOR INCOMPLETENESS
0
$0
0
$0
3
$104,423
2
$73,420
0
$0
0
$0
Aggregated Statistics For Year 2005 (Based on 2 partial tracts)
A) FHA, FSA/RHS & VA Home Purchase Loans
B) Conventional Home Purchase Loans
C) Refinancings
D) Home Improvement Loans
F) Non-occupant Loans on < 5 Family Dwellings (A B C & D)
G) Loans On Manufactured Home Dwelling (A B C & D)
Number
Average Value
Number
Average Value
Number
Average Value
Number
Average Value
Number
Average Value
Number
Average Value
LOANS ORIGINATED
8
$103,810
57
$122,055
82
$121,136
20
$41,769
26
$147,848
18
$54,387
APPLICATIONS APPROVED, NOT ACCEPTED
0
$0
11
$87,068
21
$124,312
3
$59,827
2
$208,845
10
$54,006
APPLICATIONS DENIED
2
$142,765
16
$50,070
75
$89,542
8
$39,770
2
$55,475
41
$70,796
APPLICATIONS WITHDRAWN
2
$63,630
0
$0
36
$118,019
3
$15,227
0
$0
8
$77,909
FILES CLOSED FOR INCOMPLETENESS
0
$0
3
$116,930
11
$116,140
0
$0
0
$0
2
$110,135
Aggregated Statistics For Year 2004 (Based on 2 partial tracts)
A) FHA, FSA/RHS & VA Home Purchase Loans
B) Conventional Home Purchase Loans
C) Refinancings
D) Home Improvement Loans
F) Non-occupant Loans on < 5 Family Dwellings (A B C & D)
G) Loans On Manufactured Home Dwelling (A B C & D)
Detailed PMIC statistics for the following Tracts:2105.00
2002 - 2018 National Fire Incident Reporting System (NFIRS) incidents
Based on the data from the years 2002 - 2018 the average number of fire incidents per year is 8. The highest number of reported fires - 14 took place in 2007, and the least - 1 in 2015. The data has an increasing trend.
When looking into fire subcategories, the most incidents belonged to: Structure Fires (45.6%), and Outside Fires (37.5%).
Fire incident types reported to NFIRS in Zip Code 24347


 Nearest zip codes: 24105, 24324, 24141, 24325, 24313, 24380.


 Based on the data from the years 2002 - 2018 the average number of fire incidents per year is 8. The highest number of reported fires - 14 took place in 2007, and the least - 1 in 2015. The data has an increasing trend.
 When looking into fire subcategories, the most incidents belonged to: Structure Fires (45.6%), and Outside Fires (37.5%).