Estimated zip code population in 2022: 8,095 Zip code population in 2010: 7,258 Zip code population in 2000: 7,193
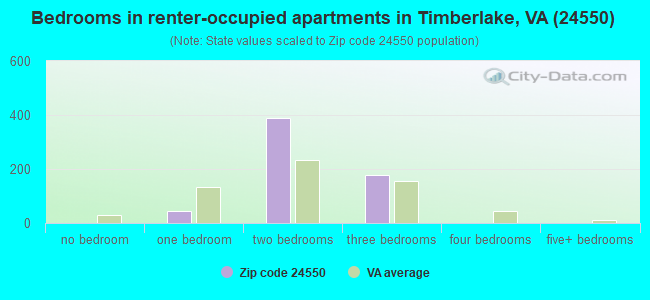
Houses and condos: 3,369 Renter-occupied apartments: 618
% of renters here:
20%
State:
33%
March 2022 cost of living index in zip code 24550: 83.7 (less than average, U.S. average is 100)
Land area: 65.1 sq. mi. Water area: 0.2 sq. mi.
Population density: 124 people per square mile
(very low).
OSM Map
General Map
Google Map
MSN Map
OSM Map
General Map
Google Map
MSN Map
OSM Map
General Map
Google Map
MSN Map
OSM Map
General Map
Google Map
MSN Map
Please wait while loading the map...
Real estate property taxes paid for housing units in 2022:
This zip code:
0.5% ($927)
Virginia:
0.7% ($2,617)
Median real estate property taxes paid for housing units with mortgages in 2022: $956 (0.5%) Median real estate property taxes paid for housing units with no mortgage in 2022: $900 (0.6%)
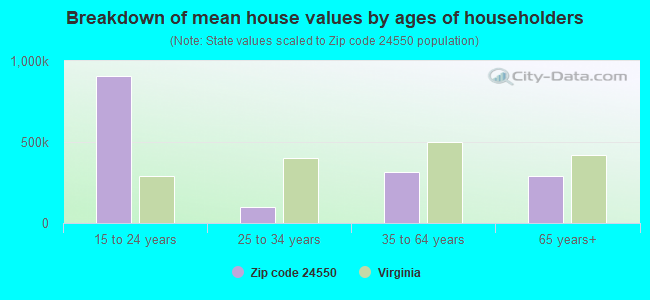
Estimated median house/condo value in 2022: $193,720
24550:
$193,720
Virginia:
$365,700
According to our research of Virginia and other state lists, there were 21 registered sex offenders living in 24550 zip code as of May 12, 2024. The ratio of all residents to sex offenders in zip code 24550 is 381 to 1. The ratio of registered sex offenders to all residents in this zip code is near the state average.
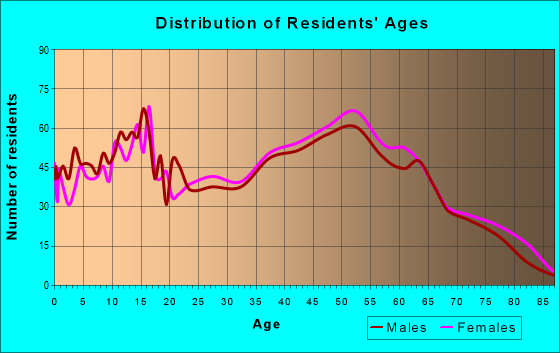
Median resident age:
This zip code:
42.6 years
Virginia median age:
39.0 years
Average household size:
This zip code:
2.6 people
Virginia:
2.5 people
Averages for the 2020 tax year for zip code 24550, filed in 2021:
Average Adjusted Gross Income (AGI) in 2020: $59,528 (Individual Income Tax Returns)
Here:
$59,528
State:
$86,446
Salary/wage: $52,589 (reported on 86.1% of returns)
Here:
$52,589
State:
$71,185
(% of AGI for various income ranges: 1191.1% for AGIs below $25k, 3698.7% for AGIs $25k-50k, 6509.5% for AGIs $50k-75k, 9124.4% for AGIs $75k-100k, 18297.7% for AGIs $100k-200k, 66233.3% for AGIs over 200k)
Taxable interest for individuals: $850 (reported on 26.7% of returns)
This zip code:
$850
Virginia:
$1,805
(% of AGI for various income ranges: 8.5% for AGIs below $25k, 10.3% for AGIs $25k-50k, 21.0% for AGIs $50k-75k, 74.0% for AGIs $75k-100k, 90.0% for AGIs $100k-200k, 390.0% for AGIs over 200k)
Ordinary dividends: $3,922 (reported on 15.0% of returns)
Here:
$3,922
State:
$8,327
(% of AGI for various income ranges: 15.4% for AGIs below $25k, 23.6% for AGIs $25k-50k, 46.2% for AGIs $50k-75k, 68.0% for AGIs $75k-100k, 238.4% for AGIs $100k-200k, 2386.7% for AGIs over 200k)
Net capital gain/loss in AGI: +$8,774 (reported on 12.8% of returns)
Here:
+$8,774
State:
+$24,644
(% of AGI for various income ranges: 6.1% for AGIs below $25k, 22.1% for AGIs $25k-50k, 45.9% for AGIs $50k-75k, 155.2% for AGIs $75k-100k, 475.2% for AGIs $100k-200k, 5933.3% for AGIs over 200k)
Profit/loss from business: +$8,716 (reported on 12.3% of returns)
Here:
+$8,716
State:
+$12,836
(% of AGI for various income ranges: 96.2% for AGIs below $25k, 74.2% for AGIs $25k-50k, 59.7% for AGIs $50k-75k, 149.6% for AGIs $75k-100k, 580.3% for AGIs $100k-200k)
Taxable individual retirement arrangement distribution: $16,361 (reported on 8.6% of returns)
24550:
$16,361
Virginia:
$21,535
(% of AGI for various income ranges: 47.3% for AGIs below $25k, 75.6% for AGIs $25k-50k, 183.8% for AGIs $50k-75k, 380.8% for AGIs $75k-100k, 780.3% for AGIs $100k-200k)
Total itemized deductions: $30,905 (reported on 5.8% of returns)
Here:
$30,905
State:
$33,287
(% of AGI for various income ranges: 101.8% for AGIs $25k-50k, 153.8% for AGIs $50k-75k, 322.8% for AGIs $75k-100k, 835.8% for AGIs $100k-200k, 5863.3% for AGIs over 200k)
Charity contributions: $12,171 (reported on 4.7% of returns)
Here:
$12,171
State:
$10,381
(% of AGI for various income ranges: 32.9% for AGIs $25k-50k, 95.6% for AGIs $75k-100k, 271.0% for AGIs $100k-200k, 2510.0% for AGIs over 200k)
Taxes paid: $7,348 (reported on 5.8% of returns)
24550:
$7,348
State:
$8,284
(% of AGI for various income ranges: 13.1% for AGIs $25k-50k, 30.8% for AGIs $50k-75k, 70.4% for AGIs $75k-100k, 222.6% for AGIs $100k-200k, 1543.3% for AGIs over 200k)
Earned income credit: $2,147 (reported on 16.2% of returns)
Here:
$2,147
State:
$2,214
(% of AGI for various income ranges: 84.8% for AGIs below $25k, 63.3% for AGIs $25k-50k)
Percentage of individuals using paid preparers for their 2020 taxes: 93.6%
Here:
94%
State:
92%
(% for various income ranges: 91.7% for AGIs below $25k, 94.4% for AGIs $25k-50k, 94.2% for AGIs $50k-75k, 94.1% for AGIs $75k-100k, 94.3% for AGIs $100k-200k, 100.0% for AGIs over 200k)
Averages for the 2012 tax year for zip code 24550, filed in 2013:
Average Adjusted Gross Income (AGI) in 2012: $46,602 (Individual Income Tax Returns)
Here:
$46,602
State:
$71,192
Salary/wage: $42,252 (reported on 88.4% of returns)
Here:
$42,252
State:
$59,229
(% of AGI for various income ranges: 80.7% for AGIs below $25k, 83.8% for AGIs $25k-50k, 82.7% for AGIs $50k-75k, 84.6% for AGIs $75k-100k, 80.9% for AGIs $100k-200k, 60.0% for AGIs over 200k)
Taxable interest for individuals: $752 (reported on 27.6% of returns)
This zip code:
$752
Virginia:
$1,600
(% of AGI for various income ranges: 0.6% for AGIs below $25k, 0.5% for AGIs $25k-50k, 0.5% for AGIs $50k-75k, 0.3% for AGIs $75k-100k, 0.4% for AGIs $100k-200k, 0.3% for AGIs over 200k)
Ordinary dividends: $1,595 (reported on 13.8% of returns)
Here:
$1,595
State:
$6,959
(% of AGI for various income ranges: 0.4% for AGIs below $25k, 0.4% for AGIs $25k-50k, 0.5% for AGIs $50k-75k, 0.3% for AGIs $75k-100k, 0.4% for AGIs $100k-200k, 0.9% for AGIs over 200k)
Net capital gain/loss in AGI: +$4,074 (reported on 9.7% of returns)
Here:
+$4,074
State:
+$16,672
(% of AGI for various income ranges: 0.4% for AGIs $25k-50k, 0.2% for AGIs $50k-75k, 0.7% for AGIs $75k-100k, 1.1% for AGIs $100k-200k, 3.2% for AGIs over 200k)
Profit/loss from business: +$6,818 (reported on 12.5% of returns)
Here:
+$6,818
State:
+$14,116
(% of AGI for various income ranges: 5.1% for AGIs below $25k, 2.4% for AGIs $25k-50k, 1.8% for AGIs $50k-75k, 0.7% for AGIs $75k-100k, 1.4% for AGIs $100k-200k)
Taxable individual retirement arrangement distribution: $11,282 (reported on 8.8% of returns)
24550:
$11,282
Virginia:
$16,667
(% of AGI for various income ranges: 2.0% for AGIs below $25k, 2.2% for AGIs $25k-50k, 1.8% for AGIs $50k-75k, 1.5% for AGIs $75k-100k, 3.5% for AGIs $100k-200k)
Total itemized deductions: $19,314 (20% of AGI, reported on 25.4% of returns)
Here:
$19,314
State:
$26,596
Here:
20.5% of AGI
State:
20.1% of AGI
(% of AGI for various income ranges: 5.3% for AGIs below $25k, 7.4% for AGIs $25k-50k, 9.5% for AGIs $50k-75k, 11.6% for AGIs $75k-100k, 14.4% for AGIs $100k-200k, 12.9% for AGIs over 200k)
Charity contributions: $4,651 (reported on 19.7% of returns)
Here:
$4,651
State:
$4,443
(% of AGI for various income ranges: 0.5% for AGIs below $25k, 1.1% for AGIs $25k-50k, 1.6% for AGIs $50k-75k, 1.8% for AGIs $75k-100k, 2.9% for AGIs $100k-200k, 3.8% for AGIs over 200k)
Taxes paid: $6,037 (reported on 25.4% of returns)
24550:
$6,037
State:
$9,951
(% of AGI for various income ranges: 0.6% for AGIs below $25k, 1.6% for AGIs $25k-50k, 2.5% for AGIs $50k-75k, 3.6% for AGIs $75k-100k, 5.3% for AGIs $100k-200k, 5.3% for AGIs over 200k)
Earned income credit: $2,146 (reported on 20.4% of returns)
Here:
$2,146
State:
$2,211
(% of AGI for various income ranges: 6.2% for AGIs below $25k, 1.2% for AGIs $25k-50k)
Percentage of individuals using paid preparers for their 2012 taxes: 45.5%
Here:
45%
State:
46%
(% for various income ranges: 39.8% for AGIs below $25k, 45.7% for AGIs $25k-50k, 51.1% for AGIs $50k-75k, 52.0% for AGIs $75k-100k, 53.3% for AGIs $100k-200k, 60.0% for AGIs over 200k)
Averages for the 2004 tax year for zip code 24550, filed in 2005:
Average Adjusted Gross Income (AGI) in 2004: $36,798 (Individual Income Tax Returns)
Here:
$36,798
State:
$56,704
Salary/wage: $34,981 (reported on 90.1% of returns)
Here:
$34,981
State:
$48,441
(% of AGI for various income ranges: 118.9% for AGIs below $10k, 84.9% for AGIs $10k-25k, 88.2% for AGIs $25k-50k, 88.6% for AGIs $50k-75k, 85.0% for AGIs $75k-100k, 75.4% for AGIs over 100k)
Taxable interest for individuals: $808 (reported on 33.9% of returns)
This zip code:
$808
Virginia:
$1,688
(% of AGI for various income ranges: 3.5% for AGIs below $10k, 1.1% for AGIs $10k-25k, 0.7% for AGIs $25k-50k, 0.6% for AGIs $50k-75k, 0.5% for AGIs $75k-100k, 0.7% for AGIs over 100k)
Taxable dividends: $1,452 (reported on 13.9% of returns)
Here:
$1,452
State:
$4,028
(% of AGI for various income ranges: 1.6% for AGIs below $10k, 0.4% for AGIs $10k-25k, 0.2% for AGIs $25k-50k, 0.6% for AGIs $50k-75k, 0.7% for AGIs $75k-100k, 0.8% for AGIs over 100k)
Net capital gain/loss: +$3,578 (reported on 11.6% of returns)
Here:
+$3,578
State:
+$14,375
(% of AGI for various income ranges: -0.7% for AGIs below $10k, 0.9% for AGIs $10k-25k, 0.3% for AGIs $25k-50k, 0.7% for AGIs $50k-75k, 1.7% for AGIs $75k-100k, 2.9% for AGIs over 100k)
Profit/loss from business: +$7,878 (reported on 11.5% of returns)
Here:
+$7,878
State:
+$13,342
(% of AGI for various income ranges: 11.2% for AGIs below $10k, 2.3% for AGIs $10k-25k, 2.7% for AGIs $25k-50k, 1.1% for AGIs $50k-75k, 2.1% for AGIs $75k-100k, 3.8% for AGIs over 100k)
IRA payment deduction: $2,510 (reported on 1.7% of returns)
24550:
$2,510
Virginia:
$2,943
(% of AGI for various income ranges: 0.2% for AGIs $10k-25k, 0.1% for AGIs $25k-50k, 0.1% for AGIs $50k-75k, 0.2% for AGIs $75k-100k)
Total itemized deductions: $14,660 (21% of AGI, reported on 25.6% of returns)
Here:
$14,660
State:
$21,492
Here:
21.1% of AGI
State:
21.0% of AGI
(% of AGI for various income ranges: 5.2% for AGIs $10k-25k, 7.7% for AGIs $25k-50k, 11.1% for AGIs $50k-75k, 14.7% for AGIs $75k-100k, 13.5% for AGIs over 100k)
Charity contributions deductions: $2,946 (4% of AGI, reported on 21.5% of returns)
Here:
$2,946
State:
$3,794
Here:
4.0% of AGI
State:
3.5% of AGI
(% of AGI for various income ranges: 0.6% for AGIs $10k-25k, 1.0% for AGIs $25k-50k, 1.7% for AGIs $50k-75k, 2.7% for AGIs $75k-100k, 2.9% for AGIs over 100k)
Total tax: $4,268 (reported on 74.1% of returns)
24550:
$4,268
State:
$9,537
(% of AGI for various income ranges: 2.9% for AGIs below $10k, 3.8% for AGIs $10k-25k, 6.4% for AGIs $25k-50k, 8.4% for AGIs $50k-75k, 9.8% for AGIs $75k-100k, 15.6% for AGIs over 100k)
Earned income credit: $1,710 (reported on 18.7% of returns)
Here:
$1,710
State:
$1,734
Percentage of individuals using paid preparers for their 2004 taxes: 49.4%
Here:
49%
State:
52%
(% for various income ranges: 42.2% for AGIs below $10k, 48.7% for AGIs $10k-25k, 51.1% for AGIs $25k-50k, 53.5% for AGIs $50k-75k, 49.0% for AGIs $75k-100k, 58.8% for AGIs over 100k)
Likely homosexual households (counted as self-reported same-sex unmarried-partner households)
Lesbian couples: 0.5% of all households
Gay men: 0.2% of all households
Household received Food Stamps/SNAP in the past 12 months: 255 Household did not receive Food Stamps/SNAP in the past 12 months: 2,806
Women who had a birth in the past 12 months: 55 (57 now married, 0 unmarried) Women who did not have a birth in the past 12 months: 1,811 (1,055 now married, 744 unmarried)
Housing units in zip code 24550 with a mortgage: 1,614 (178 second mortgage, 144 both second mortgage and home equity loan) Houses without a mortgage: 22
Median monthly owner costs for units with a mortgage: $1,070 Median monthly owner costs for units without a mortgage: $350
Residents with income below the poverty level in 2022:
This zip code:
8.3%
Whole state:
10.6%
Residents with income below 50% of the poverty level in 2022:
This zip code:
5.7%
Whole state:
5.2%
Median number of rooms in houses and condos:
Here:
6.2
State:
7.0
Median number of rooms in apartments:
Here:
3.9
State:
4.3
Notable locations in this zip code not listed on our city pages
Churches in zip code 24550 include: Bethlehem Baptist Church (A), Salem Church (B), Chapel Grove Church (C), Crossroads Church (D), Good Shepherd Church (E), Langhorne Chapel (F), Leesville Road Church (G), Liberty Church (H), Mount Evergreen Church (I). Display/hide their locations on the map
Creeks: Troublesome Creek (A), Orrix Creek (B), Mill Creek (C), Johnson Creek (D), Flat Creek (E), Buffalo Creek (F). Display/hide their locations on the map
Size of family households: 1,128 2-persons, 353 3-persons, 340 4-persons, 212 5-persons, 98 6-persons, 51 7-or-more-persons
Size of nonfamily households: 704 1-person, 161 2-persons, 21 3-persons
1,288 married couples with children.
302 single-parent households (123 men, 179 women).
91.3% of residents of 24550 zip code speak English at home.
1.3% of residents speak Spanish at home (24% very well, 76% not well).
0.1% of residents speak other Indo-European language at home (100% very well).
2.4% of residents speak Asian or Pacific Island language at home (58% well, 26% not well, 16% not at all).
6.0% of residents speak other language at home (100% not at all).
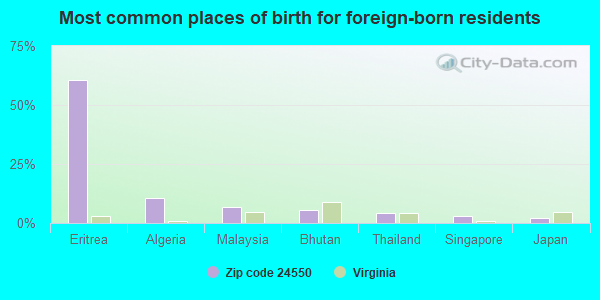
Foreign born population: 486 (6.0%) (24.0% of them are naturalized citizens)
This zip code:
6.0%
Whole state:
12.7%
60%Eritrea
10%Algeria
7%Malaysia
5%Bhutan
4%Thailand
3%Singapore
2%Japan
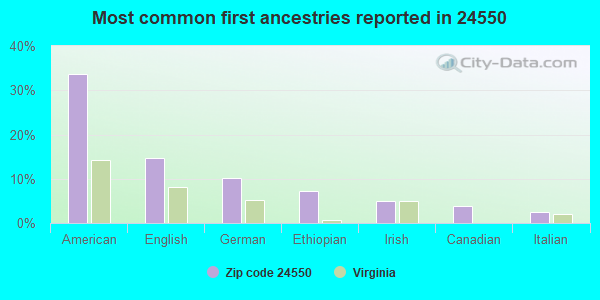
34%American
15%English
10%German
7%Ethiopian
5%Irish
4%Canadian
2%Italian
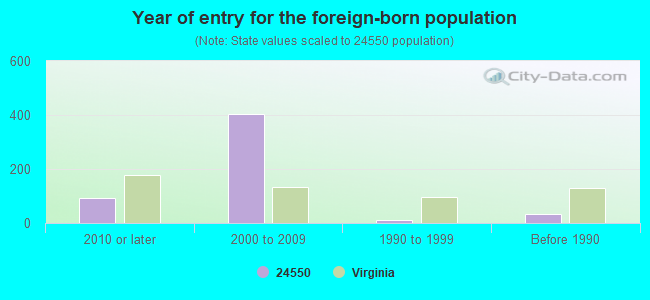
Year of entry for the foreign-born population
942010 or later
4022000 to 2009
101990 to 1999
35Before 1990
Housing units lacking complete plumbing facilities: 1.7% Housing units lacking complete kitchen facilities: 3.2%
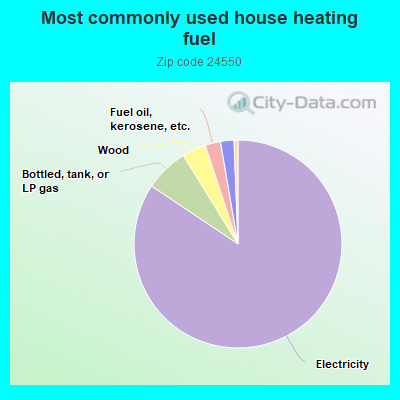
84.5%Electricity
6.8%Bottled, tank, or LP gas
3.7%Wood
2.4%Fuel oil, kerosene, etc.
2.1%Utility gas
0.6%No fuel used
Population in 1990: 4,961. Population change in the 1990s: +2,232 (+45.0%).
Place of birth for U.S.-born residents:
This state: 5,332
Northeast: 757
Midwest: 314
South: 1,009
West: 88
63% of the 24550 zip code residents lived in the same house 5 years ago. Out of people who lived in different houses, 43% lived in this county. Out of people who lived in different counties, 50% lived in Virginia.
92% of the 24550 zip code residents lived in the same house 1 year ago. Out of people who lived in different houses, 23% moved from this county. Out of people who lived in different houses, 71% moved from different county within same state. Out of people who lived in different houses, 9% moved from different state.
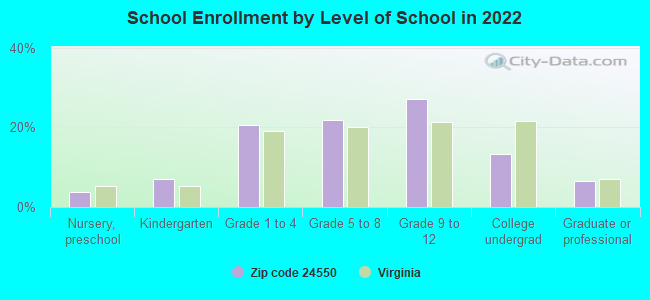
Private vs. public school enrollment:
Students in private schools in grades 1 to 8 (elementary and middle school): 162
Here:
18.0%
Virginia:
13.2%
Students in private schools in grades 9 to 12 (high school): 176
Here:
31.0%
Virginia:
10.2%
Students in private undergraduate colleges: 124
Here:
45.6%
Virginia:
18.7%
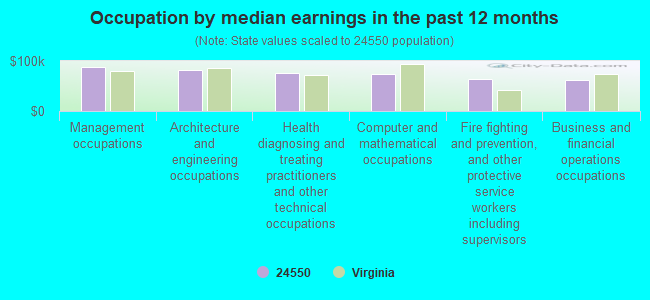
Occupation by median earnings in the past 12 months ($)
87,736Management occupations
81,718Architecture and engineering occupations
75,683Health diagnosing and treating practitioners and other technical occupations
74,734Computer and mathematical occupations
63,921Fire fighting and prevention, and other protective service workers including supervisors
62,979Business and financial operations occupations
Companies with federal contracts located in this zip code:
ROBERT POWELL, LLC (134 HUNTERS MILL LN in EVINGTON, VA; small business) : $121,621 in 7 contractsfrom 2004 to 2005
Contracts for Drafting, Surveying, and Mapping Instruments, Specialized Test and Handling Equipment, Nuclear Ordnance by Army Signed by year:2000: $0; 2001: $0; 2002: $0; 2003: $0; 2004: $107,271; 2005: $14,350; 2006: $0.
Biggest contracts:
$90,250 with Army for Drafting, Surveying, and Mapping Instruments. Signed on 2004-03-02. Completion date: 2004-03-11.
$13,950, same as above.Signed on 2005-01-20. Completion date: 2005-01-24.
$7,750 with Army for Specialized Test and Handling Equipment, Nuclear Ordnance. Signed on 2004-08-19. Completion date: 2004-08-30.
$4,650 with Army for Drafting, Surveying, and Mapping Instruments. Signed on 2004-12-01. Completion date: 2004-12-04.
SONNY MERRYMAN, INC (5120 WARDS ROAD in EVINGTON, VA) : $17,500 in 5 contractsfrom 2003 to 2004
Contracts for Passenger Motor Vehicles, Lease or Rental of Equipment -- Ground Effect Vehicles, Motor Vehicles, Trailers, and Cycles by Army Signed by year:2000: $0; 2001: $0; 2002: $0; 2003: $4,800; 2004: $12,700; 2005: $0; 2006: $0.
Biggest contracts:
$4,800 with Army for Passenger Motor Vehicles. Signed on 2003-03-31. Completion date: 2003-04-23.
$3,900 with Army for Lease or Rental of Equipment -- Ground Effect Vehicles, Motor Vehicles, Trailers, and Cycles. Signed on 2004-02-10. Completion date: 2004-02-29.
$3,200, same as above.Signed on 2004-06-24. Completion date: 2004-02-29.
$2,800, same as above.Signed on 2004-06-10. Completion date: 2004-02-29.
Top industries in this zip code by the number of employees in 2005:
Other Services (except Public Administration): Religious Organizations (10-19 employees: 2 establishments, 5-9 employees: 1 establishment, 1-4 employees: 3 establishments)
Professional, Scientific, and Technical Services: Direct Mail Advertising (20-49: 1)
Administrative and Support and Waste Management and Remediation Services: Landscaping Services (5-9: 2, 1-4: 8)
Construction: New Single-Family Housing Construction (except Operative Builders) (5-9: 1, 1-4: 8)
Other Services (except Public Administration): General Automotive Repair (5-9: 1, 1-4: 2)
Construction: Painting and Wall Covering Contractors (5-9: 1, 1-4: 1)
Construction: Site Preparation Contractors (5-9: 1, 1-4: 1)
Construction: All Other Specialty Trade Contractors (5-9: 1, 1-4: 1)
Fatal accident statistics in 2014:
Fatal accident count: 1
Vehicles involved in fatal accidents: 2
Fatal accidents caused by drunken drivers: 0
Fatalities: 1
Persons involved in fatal accidents: 2
Pedestrians involved in fatal accidents: 0
Fatal accident statistics in 2012:
Fatal accident count: 4
Vehicles involved in fatal accidents: 6
Fatal accidents caused by drunken drivers: 0
Fatalities: 5
Persons involved in fatal accidents: 8
Pedestrians involved in fatal accidents: 0
Home Mortgage Disclosure Act Aggregated Statistics For Year 2009 (Based on 6 partial tracts)
A) FHA, FSA/RHS & VA Home Purchase Loans
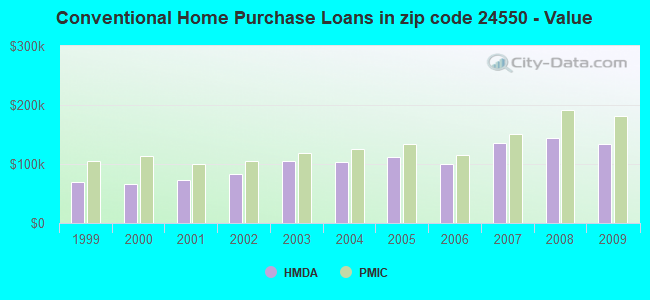
B) Conventional Home Purchase Loans
C) Refinancings
D) Home Improvement Loans
E) Loans on Dwellings For 5+ Families
F) Non-occupant Loans on < 5 Family Dwellings (A B C & D)
G) Loans On Manufactured Home Dwelling (A B C & D)
Number
Average Value
Number
Average Value
Number
Average Value
Number
Average Value
Number
Average Value
Number
Average Value
Number
Average Value
LOANS ORIGINATED
105
$141,858
98
$134,041
564
$150,848
49
$55,031
3
$7,229,480
34
$140,883
22
$66,079
APPLICATIONS APPROVED, NOT ACCEPTED
2
$108,000
6
$68,903
29
$158,647
2
$38,475
0
$0
1
$61,200
6
$61,113
APPLICATIONS DENIED
9
$159,573
16
$64,495
160
$142,636
22
$63,920
0
$0
9
$137,391
23
$45,790
APPLICATIONS WITHDRAWN
3
$149,440
8
$167,864
103
$148,854
4
$142,192
0
$0
1
$155,750
2
$115,950
FILES CLOSED FOR INCOMPLETENESS
4
$129,912
1
$553,130
30
$171,564
3
$44,347
0
$0
0
$0
0
$0
Aggregated Statistics For Year 2008 (Based on 6 partial tracts)
A) FHA, FSA/RHS & VA Home Purchase Loans
B) Conventional Home Purchase Loans
C) Refinancings
D) Home Improvement Loans
E) Loans on Dwellings For 5+ Families
F) Non-occupant Loans on < 5 Family Dwellings (A B C & D)
G) Loans On Manufactured Home Dwelling (A B C & D)
Number
Average Value
Number
Average Value
Number
Average Value
Number
Average Value
Number
Average Value
Number
Average Value
Number
Average Value
LOANS ORIGINATED
84
$151,950
171
$144,129
382
$126,799
46
$47,061
4
$5,105,880
51
$124,737
40
$46,822
APPLICATIONS APPROVED, NOT ACCEPTED
1
$105,650
18
$106,013
47
$107,093
5
$17,452
0
$0
2
$69,750
11
$25,658
APPLICATIONS DENIED
6
$152,610
22
$85,389
220
$128,373
37
$73,667
0
$0
10
$78,974
30
$65,397
APPLICATIONS WITHDRAWN
4
$172,630
11
$164,808
84
$151,423
11
$102,897
0
$0
4
$110,880
4
$77,252
FILES CLOSED FOR INCOMPLETENESS
0
$0
3
$184,377
13
$189,868
4
$57,000
0
$0
0
$0
0
$0
Aggregated Statistics For Year 2007 (Based on 6 partial tracts)
A) FHA, FSA/RHS & VA Home Purchase Loans
B) Conventional Home Purchase Loans
C) Refinancings
D) Home Improvement Loans
E) Loans on Dwellings For 5+ Families
F) Non-occupant Loans on < 5 Family Dwellings (A B C & D)
G) Loans On Manufactured Home Dwelling (A B C & D)
Number
Average Value
Number
Average Value
Number
Average Value
Number
Average Value
Number
Average Value
Number
Average Value
Number
Average Value
LOANS ORIGINATED
41
$151,033
325
$136,056
469
$125,157
71
$60,752
4
$434,498
87
$143,436
66
$55,961
APPLICATIONS APPROVED, NOT ACCEPTED
0
$0
20
$148,584
107
$116,080
21
$40,293
0
$0
6
$114,210
8
$67,315
APPLICATIONS DENIED
6
$115,150
53
$116,594
281
$114,941
57
$45,189
0
$0
18
$90,767
39
$56,267
APPLICATIONS WITHDRAWN
4
$71,835
19
$150,368
133
$109,025
18
$57,418
0
$0
1
$182,140
9
$54,150
FILES CLOSED FOR INCOMPLETENESS
0
$0
8
$164,668
24
$139,345
0
$0
0
$0
3
$189,007
1
$103,680
Aggregated Statistics For Year 2006 (Based on 6 partial tracts)
A) FHA, FSA/RHS & VA Home Purchase Loans
B) Conventional Home Purchase Loans
C) Refinancings
D) Home Improvement Loans
E) Loans on Dwellings For 5+ Families
F) Non-occupant Loans on < 5 Family Dwellings (A B C & D)
G) Loans On Manufactured Home Dwelling (A B C & D)
Number
Average Value
Number
Average Value
Number
Average Value
Number
Average Value
Number
Average Value
Number
Average Value
Number
Average Value
LOANS ORIGINATED
42
$135,330
419
$100,233
507
$105,049
71
$44,919
4
$282,022
88
$82,321
58
$49,517
APPLICATIONS APPROVED, NOT ACCEPTED
1
$57,600
76
$82,671
87
$81,510
15
$67,840
0
$0
13
$98,974
26
$58,841
APPLICATIONS DENIED
5
$112,968
106
$106,532
324
$101,769
53
$51,918
0
$0
24
$165,650
60
$54,798
APPLICATIONS WITHDRAWN
2
$91,335
39
$94,342
198
$125,321
14
$61,727
0
$0
7
$103,827
4
$84,970
FILES CLOSED FOR INCOMPLETENESS
1
$122,270
3
$143,240
23
$113,088
1
$168,850
0
$0
0
$0
0
$0
Aggregated Statistics For Year 2005 (Based on 6 partial tracts)
A) FHA, FSA/RHS & VA Home Purchase Loans
B) Conventional Home Purchase Loans
C) Refinancings
D) Home Improvement Loans
E) Loans on Dwellings For 5+ Families
F) Non-occupant Loans on < 5 Family Dwellings (A B C & D)
G) Loans On Manufactured Home Dwelling (A B C & D)
Number
Average Value
Number
Average Value
Number
Average Value
Number
Average Value
Number
Average Value
Number
Average Value
Number
Average Value
LOANS ORIGINATED
53
$130,156
415
$112,656
477
$100,656
47
$41,717
3
$364,387
73
$112,085
54
$47,663
APPLICATIONS APPROVED, NOT ACCEPTED
1
$254,730
52
$97,686
104
$88,061
16
$49,940
0
$0
5
$57,746
25
$57,557
APPLICATIONS DENIED
5
$94,652
96
$94,380
310
$103,786
67
$29,239
0
$0
10
$148,394
75
$58,388
APPLICATIONS WITHDRAWN
2
$120,845
54
$120,440
149
$111,568
18
$106,443
0
$0
12
$102,917
3
$118,657
FILES CLOSED FOR INCOMPLETENESS
1
$154,080
15
$122,991
42
$117,877
6
$35,648
0
$0
1
$196,510
0
$0
Aggregated Statistics For Year 2004 (Based on 6 partial tracts)
A) FHA, FSA/RHS & VA Home Purchase Loans
B) Conventional Home Purchase Loans
C) Refinancings
D) Home Improvement Loans
E) Loans on Dwellings For 5+ Families
F) Non-occupant Loans on < 5 Family Dwellings (A B C & D)
G) Loans On Manufactured Home Dwelling (A B C & D)
Number
Average Value
Number
Average Value
Number
Average Value
Number
Average Value
Number
Average Value
Number
Average Value
Number
Average Value
LOANS ORIGINATED
53
$110,021
307
$104,158
571
$96,498
59
$25,895
4
$874,452
59
$103,495
55
$41,470
APPLICATIONS APPROVED, NOT ACCEPTED
1
$108,720
38
$87,803
121
$88,227
11
$31,726
0
$0
5
$101,916
23
$50,741
APPLICATIONS DENIED
9
$106,383
64
$62,302
232
$92,181
82
$20,434
0
$0
19
$70,055
61
$51,071
APPLICATIONS WITHDRAWN
6
$87,093
21
$127,784
138
$103,413
18
$47,547
0
$0
6
$28,042
16
$78,181
FILES CLOSED FOR INCOMPLETENESS
1
$211,060
15
$95,644
19
$88,229
1
$32,400
0
$0
0
$0
2
$59,060
Aggregated Statistics For Year 2003 (Based on 6 partial tracts)
A) FHA, FSA/RHS & VA Home Purchase Loans
B) Conventional Home Purchase Loans
C) Refinancings
D) Home Improvement Loans
E) Loans on Dwellings For 5+ Families
F) Non-occupant Loans on < 5 Family Dwellings (A B C & D)
Number
Average Value
Number
Average Value
Number
Average Value
Number
Average Value
Number
Average Value
Number
Average Value
LOANS ORIGINATED
74
$114,336
320
$104,654
1,026
$96,977
63
$40,012
1
$620,090
93
$78,584
APPLICATIONS APPROVED, NOT ACCEPTED
3
$115,963
22
$74,702
114
$91,366
6
$40,272
0
$0
15
$81,689
APPLICATIONS DENIED
10
$107,950
80
$67,970
252
$93,265
37
$22,002
0
$0
15
$99,475
APPLICATIONS WITHDRAWN
7
$88,299
28
$118,560
146
$108,721
1
$50,950
0
$0
6
$84,928
FILES CLOSED FOR INCOMPLETENESS
0
$0
6
$93,370
34
$113,790
2
$21,850
0
$0
1
$88,790
Aggregated Statistics For Year 2002 (Based on 4 partial tracts)
A) FHA, FSA/RHS & VA Home Purchase Loans
B) Conventional Home Purchase Loans
C) Refinancings
D) Home Improvement Loans
F) Non-occupant Loans on < 5 Family Dwellings (A B C & D)
Number
Average Value
Number
Average Value
Number
Average Value
Number
Average Value
Number
Average Value
LOANS ORIGINATED
11
$91,545
58
$82,869
162
$92,249
15
$22,264
7
$44,677
APPLICATIONS APPROVED, NOT ACCEPTED
0
$0
25
$55,926
28
$82,979
4
$20,700
1
$33,340
APPLICATIONS DENIED
1
$98,290
49
$47,436
73
$80,363
10
$20,531
2
$21,885
APPLICATIONS WITHDRAWN
0
$0
6
$76,868
42
$92,994
1
$5,760
0
$0
FILES CLOSED FOR INCOMPLETENESS
0
$0
1
$120,460
6
$66,800
0
$0
0
$0
Aggregated Statistics For Year 2001 (Based on 4 partial tracts)
A) FHA, FSA/RHS & VA Home Purchase Loans
B) Conventional Home Purchase Loans
C) Refinancings
D) Home Improvement Loans
F) Non-occupant Loans on < 5 Family Dwellings (A B C & D)
Number
Average Value
Number
Average Value
Number
Average Value
Number
Average Value
Number
Average Value
LOANS ORIGINATED
19
$95,051
71
$73,112
124
$89,146
24
$27,169
9
$86,788
APPLICATIONS APPROVED, NOT ACCEPTED
0
$0
26
$55,151
25
$76,451
4
$70,560
1
$54,000
APPLICATIONS DENIED
2
$95,870
53
$44,210
85
$65,052
17
$15,938
2
$85,925
APPLICATIONS WITHDRAWN
3
$96,227
13
$54,806
46
$80,213
2
$18,720
0
$0
FILES CLOSED FOR INCOMPLETENESS
0
$0
1
$70,560
6
$86,468
0
$0
0
$0
Aggregated Statistics For Year 2000 (Based on 4 partial tracts)
A) FHA, FSA/RHS & VA Home Purchase Loans
B) Conventional Home Purchase Loans
C) Refinancings
D) Home Improvement Loans
F) Non-occupant Loans on < 5 Family Dwellings (A B C & D)
Number
Average Value
Number
Average Value
Number
Average Value
Number
Average Value
Number
Average Value
LOANS ORIGINATED
20
$82,221
83
$66,743
64
$56,806
19
$16,955
8
$46,600
APPLICATIONS APPROVED, NOT ACCEPTED
8
$44,910
16
$43,500
10
$41,672
9
$21,339
0
$0
APPLICATIONS DENIED
13
$58,570
73
$40,237
61
$58,375
18
$15,080
2
$69,840
APPLICATIONS WITHDRAWN
2
$75,615
5
$66,186
13
$51,631
1
$14,400
1
$27,510
FILES CLOSED FOR INCOMPLETENESS
0
$0
3
$58,307
7
$63,396
0
$0
0
$0
Aggregated Statistics For Year 1999 (Based on 3 partial tracts)
A) FHA, FSA/RHS & VA Home Purchase Loans
B) Conventional Home Purchase Loans
C) Refinancings
D) Home Improvement Loans
E) Loans on Dwellings For 5+ Families
F) Non-occupant Loans on < 5 Family Dwellings (A B C & D)
2002 - 2018 National Fire Incident Reporting System (NFIRS) incidents
According to the data from the years 2002 - 2018 the average number of fire incidents per year is 38. The highest number of reported fires - 87 took place in 2008, and the least - 19 in 2016. The data has a declining trend.
When looking into fire subcategories, the most incidents belonged to: Outside Fires (51.9%), and Structure Fires (35.1%).
Fire incident types reported to NFIRS in Zip Code 24550


 Nearest zip codes: 24517, 24502, 24551, 24588, 24501, 24571.


 : $121,621 in 7 contracts from 2004 to 2005

 According to the data from the years 2002 - 2018 the average number of fire incidents per year is 38. The highest number of reported fires - 87 took place in 2008, and the least - 19 in 2016. The data has a declining trend.
 When looking into fire subcategories, the most incidents belonged to: Outside Fires (51.9%), and Structure Fires (35.1%).