Estimated zip code population in 2022: 27,057 Zip code population in 2010: 20,667 Zip code population in 2000: 16,416
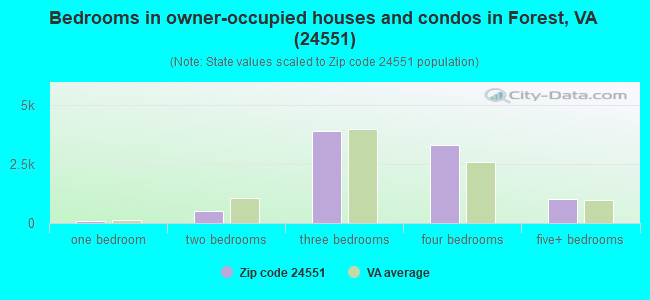
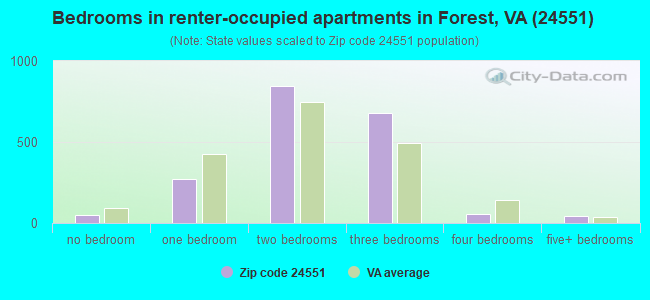
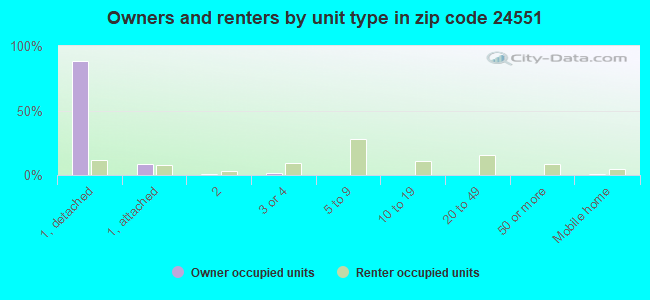
Houses and condos: 10,869 Renter-occupied apartments: 1,952
% of renters here:
18%
State:
33%
March 2022 cost of living index in zip code 24551: 84.9 (less than average, U.S. average is 100)
Land area: 68.1 sq. mi. Water area: 0.4 sq. mi.
Population density: 397 people per square mile
(very low).
OSM Map
General Map
Google Map
MSN Map
OSM Map
General Map
Google Map
MSN Map
OSM Map
General Map
Google Map
MSN Map
OSM Map
General Map
Google Map
MSN Map
Please wait while loading the map...
Real estate property taxes paid for housing units in 2022:
This zip code:
0.4% ($1,477)
Virginia:
0.7% ($2,617)
Median real estate property taxes paid for housing units with mortgages in 2022: $1,525 (0.4%) Median real estate property taxes paid for housing units with no mortgage in 2022: $1,435 (0.4%)
Estimated median house/condo value in 2022: $356,337
24551:
$356,337
Virginia:
$365,700
According to our research of Virginia and other state lists, there were 23 registered sex offenders living in 24551 zip code as of April 27, 2024. The ratio of all residents to sex offenders in zip code 24551 is 1,035 to 1. The ratio of registered sex offenders to all residents in this zip code is much lower than the state average.
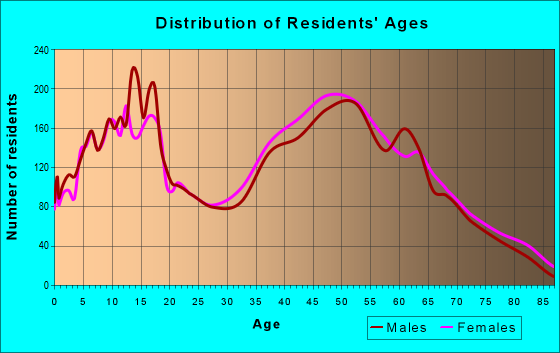
Median resident age:
This zip code:
42.4 years
Virginia median age:
39.0 years
Average household size:
This zip code:
2.5 people
Virginia:
2.5 people
Averages for the 2020 tax year for zip code 24551, filed in 2021:
Average Adjusted Gross Income (AGI) in 2020: $90,593 (Individual Income Tax Returns)
Here:
$90,593
State:
$86,446
Salary/wage: $73,709 (reported on 81.8% of returns)
Here:
$73,709
State:
$71,185
(% of AGI for various income ranges: 1160.4% for AGIs below $25k, 3431.0% for AGIs $25k-50k, 6248.5% for AGIs $50k-75k, 8866.6% for AGIs $75k-100k, 18582.1% for AGIs $100k-200k, 62663.8% for AGIs over 200k)
Taxable interest for individuals: $1,892 (reported on 39.8% of returns)
This zip code:
$1,892
Virginia:
$1,805
(% of AGI for various income ranges: 22.5% for AGIs below $25k, 41.4% for AGIs $25k-50k, 75.5% for AGIs $50k-75k, 85.9% for AGIs $75k-100k, 140.4% for AGIs $100k-200k, 1232.6% for AGIs over 200k)
Ordinary dividends: $7,176 (reported on 28.9% of returns)
Here:
$7,176
State:
$8,327
(% of AGI for various income ranges: 46.8% for AGIs below $25k, 85.4% for AGIs $25k-50k, 171.5% for AGIs $50k-75k, 208.4% for AGIs $75k-100k, 370.8% for AGIs $100k-200k, 3914.1% for AGIs over 200k)
Net capital gain/loss in AGI: +$19,119 (reported on 25.9% of returns)
Here:
+$19,119
State:
+$24,644
(% of AGI for various income ranges: 16.7% for AGIs below $25k, 52.5% for AGIs $25k-50k, 170.1% for AGIs $50k-75k, 191.1% for AGIs $75k-100k, 655.4% for AGIs $100k-200k, 13373.5% for AGIs over 200k)
Profit/loss from business: +$11,775 (reported on 16.9% of returns)
Here:
+$11,775
State:
+$12,836
(% of AGI for various income ranges: 82.1% for AGIs below $25k, 134.7% for AGIs $25k-50k, 173.9% for AGIs $50k-75k, 219.8% for AGIs $75k-100k, 351.7% for AGIs $100k-200k, 3174.7% for AGIs over 200k)
Taxable individual retirement arrangement distribution: $21,285 (reported on 13.3% of returns)
24551:
$21,285
Virginia:
$21,535
(% of AGI for various income ranges: 80.1% for AGIs below $25k, 199.8% for AGIs $25k-50k, 297.6% for AGIs $50k-75k, 568.8% for AGIs $75k-100k, 803.0% for AGIs $100k-200k, 2500.3% for AGIs over 200k)
Self-employed (Keogh) retirement plans: $20,280 (reported on 0.4% of returns)
24551:
$20,280
Virginia:
$31,172
(% of AGI for various income ranges: 298.2% for AGIs over 200k)
Total itemized deductions: $35,967 (reported on 13.5% of returns)
Here:
$35,967
State:
$33,287
(% of AGI for various income ranges: 71.7% for AGIs below $25k, 149.6% for AGIs $25k-50k, 388.5% for AGIs $50k-75k, 546.7% for AGIs $75k-100k, 1351.6% for AGIs $100k-200k, 7295.0% for AGIs over 200k)
Charity contributions: $15,285 (reported on 11.8% of returns)
Here:
$15,285
State:
$10,381
(% of AGI for various income ranges: 4.6% for AGIs below $25k, 29.3% for AGIs $25k-50k, 92.5% for AGIs $50k-75k, 134.4% for AGIs $75k-100k, 434.3% for AGIs $100k-200k, 3639.1% for AGIs over 200k)
Taxes paid: $7,771 (reported on 13.4% of returns)
24551:
$7,771
State:
$8,284
(% of AGI for various income ranges: 3.5% for AGIs below $25k, 17.4% for AGIs $25k-50k, 62.4% for AGIs $50k-75k, 122.4% for AGIs $75k-100k, 365.9% for AGIs $100k-200k, 1427.4% for AGIs over 200k)
Earned income credit: $1,922 (reported on 8.0% of returns)
Here:
$1,922
State:
$2,214
(% of AGI for various income ranges: 48.8% for AGIs below $25k, 43.7% for AGIs $25k-50k, 1.5% for AGIs $50k-75k)
Percentage of individuals using paid preparers for their 2020 taxes: 92.8%
Here:
93%
State:
92%
(% for various income ranges: 91.2% for AGIs below $25k, 93.0% for AGIs $25k-50k, 93.8% for AGIs $50k-75k, 93.0% for AGIs $75k-100k, 93.2% for AGIs $100k-200k, 95.0% for AGIs over 200k)
Averages for the 2012 tax year for zip code 24551, filed in 2013:
Average Adjusted Gross Income (AGI) in 2012: $76,699 (Individual Income Tax Returns)
Here:
$76,699
State:
$71,192
Salary/wage: $63,600 (reported on 85.5% of returns)
Here:
$63,600
State:
$59,229
(% of AGI for various income ranges: 77.3% for AGIs below $25k, 73.7% for AGIs $25k-50k, 72.3% for AGIs $50k-75k, 77.5% for AGIs $75k-100k, 80.4% for AGIs $100k-200k, 50.9% for AGIs over 200k)
Taxable interest for individuals: $1,800 (reported on 45.5% of returns)
This zip code:
$1,800
Virginia:
$1,600
(% of AGI for various income ranges: 1.8% for AGIs below $25k, 1.2% for AGIs $25k-50k, 1.0% for AGIs $50k-75k, 0.7% for AGIs $75k-100k, 0.7% for AGIs $100k-200k, 1.7% for AGIs over 200k)
Ordinary dividends: $4,115 (reported on 29.9% of returns)
Here:
$4,115
State:
$6,959
(% of AGI for various income ranges: 2.3% for AGIs below $25k, 1.7% for AGIs $25k-50k, 1.6% for AGIs $50k-75k, 1.4% for AGIs $75k-100k, 1.3% for AGIs $100k-200k, 2.0% for AGIs over 200k)
Net capital gain/loss in AGI: +$9,985 (reported on 22.8% of returns)
Here:
+$9,985
State:
+$16,672
(% of AGI for various income ranges: 0.2% for AGIs $25k-50k, 0.9% for AGIs $50k-75k, 0.5% for AGIs $75k-100k, 1.0% for AGIs $100k-200k, 9.6% for AGIs over 200k)
Profit/loss from business: +$11,754 (reported on 15.2% of returns)
Here:
+$11,754
State:
+$14,116
(% of AGI for various income ranges: 5.3% for AGIs below $25k, 2.7% for AGIs $25k-50k, 2.6% for AGIs $50k-75k, 1.5% for AGIs $75k-100k, 1.5% for AGIs $100k-200k, 3.1% for AGIs over 200k)
Taxable individual retirement arrangement distribution: $16,869 (reported on 13.0% of returns)
24551:
$16,869
Virginia:
$16,667
(% of AGI for various income ranges: 4.0% for AGIs below $25k, 4.3% for AGIs $25k-50k, 3.6% for AGIs $50k-75k, 3.1% for AGIs $75k-100k, 2.8% for AGIs $100k-200k, 1.8% for AGIs over 200k)
Self-employment retirement plans: $21,525 (reported on 0.4% of returns)
24551:
$21,525
Virginia:
$25,373
Total itemized deductions: $24,492 (19% of AGI, reported on 45.3% of returns)
Here:
$24,492
State:
$26,596
Here:
19.2% of AGI
State:
20.1% of AGI
(% of AGI for various income ranges: 9.1% for AGIs below $25k, 12.7% for AGIs $25k-50k, 14.6% for AGIs $50k-75k, 14.8% for AGIs $75k-100k, 15.8% for AGIs $100k-200k, 13.9% for AGIs over 200k)
Charity contributions: $6,446 (reported on 39.2% of returns)
Here:
$6,446
State:
$4,443
(% of AGI for various income ranges: 0.9% for AGIs below $25k, 1.9% for AGIs $25k-50k, 2.9% for AGIs $50k-75k, 2.7% for AGIs $75k-100k, 3.3% for AGIs $100k-200k, 4.7% for AGIs over 200k)
Taxes paid: $8,002 (reported on 45.2% of returns)
24551:
$8,002
State:
$9,951
(% of AGI for various income ranges: 1.2% for AGIs below $25k, 2.3% for AGIs $25k-50k, 3.3% for AGIs $50k-75k, 4.3% for AGIs $75k-100k, 5.6% for AGIs $100k-200k, 5.8% for AGIs over 200k)
Earned income credit: $1,852 (reported on 9.0% of returns)
Here:
$1,852
State:
$2,211
(% of AGI for various income ranges: 3.4% for AGIs below $25k, 0.8% for AGIs $25k-50k)
Percentage of individuals using paid preparers for their 2012 taxes: 45.7%
Here:
46%
State:
46%
(% for various income ranges: 38.7% for AGIs below $25k, 47.0% for AGIs $25k-50k, 48.2% for AGIs $50k-75k, 46.0% for AGIs $75k-100k, 47.9% for AGIs $100k-200k, 68.8% for AGIs over 200k)
Averages for the 2004 tax year for zip code 24551, filed in 2005:
Average Adjusted Gross Income (AGI) in 2004: $60,928 (Individual Income Tax Returns)
Here:
$60,928
State:
$56,704
Salary/wage: $51,944 (reported on 87.0% of returns)
Here:
$51,944
State:
$48,441
(% of AGI for various income ranges: 170.9% for AGIs below $10k, 74.8% for AGIs $10k-25k, 77.0% for AGIs $25k-50k, 79.7% for AGIs $50k-75k, 85.0% for AGIs $75k-100k, 65.5% for AGIs over 100k)
Taxable interest for individuals: $1,856 (reported on 54.0% of returns)
This zip code:
$1,856
Virginia:
$1,688
(% of AGI for various income ranges: 11.6% for AGIs below $10k, 2.7% for AGIs $10k-25k, 1.7% for AGIs $25k-50k, 1.2% for AGIs $50k-75k, 1.0% for AGIs $75k-100k, 1.8% for AGIs over 100k)
Taxable dividends: $3,041 (reported on 33.3% of returns)
Here:
$3,041
State:
$4,028
(% of AGI for various income ranges: 6.9% for AGIs below $10k, 2.4% for AGIs $10k-25k, 1.7% for AGIs $25k-50k, 1.2% for AGIs $50k-75k, 1.3% for AGIs $75k-100k, 1.8% for AGIs over 100k)
Net capital gain/loss: +$14,487 (reported on 28.0% of returns)
Here:
+$14,487
State:
+$14,375
(% of AGI for various income ranges: -1.2% for AGIs below $10k, 0.8% for AGIs $10k-25k, 0.6% for AGIs $25k-50k, 1.0% for AGIs $50k-75k, 1.3% for AGIs $75k-100k, 13.2% for AGIs over 100k)
Profit/loss from business: +$11,607 (reported on 14.2% of returns)
Here:
+$11,607
State:
+$13,342
(% of AGI for various income ranges: 10.5% for AGIs below $10k, 4.6% for AGIs $10k-25k, 3.5% for AGIs $25k-50k, 2.8% for AGIs $50k-75k, 1.8% for AGIs $75k-100k, 2.6% for AGIs over 100k)
IRA payment deduction: $3,278 (reported on 3.8% of returns)
24551:
$3,278
Virginia:
$2,943
(% of AGI for various income ranges: 0.4% for AGIs $10k-25k, 0.4% for AGIs $25k-50k, 0.2% for AGIs $50k-75k, 0.2% for AGIs $75k-100k, 0.1% for AGIs over 100k)
Self-employed pension: $12,059 (reported on 0.6% of returns)
Here:
$12,059
Virginia:
$17,430
Total itemized deductions: $18,642 (19% of AGI, reported on 49.4% of returns)
Here:
$18,642
State:
$21,492
Here:
19.4% of AGI
State:
21.0% of AGI
(% of AGI for various income ranges: 19.6% for AGIs below $10k, 12.7% for AGIs $10k-25k, 14.4% for AGIs $25k-50k, 16.4% for AGIs $50k-75k, 17.4% for AGIs $75k-100k, 14.1% for AGIs over 100k)
Charity contributions deductions: $4,034 (4% of AGI, reported on 45.0% of returns)
Here:
$4,034
State:
$3,794
Here:
4.1% of AGI
State:
3.5% of AGI
(% of AGI for various income ranges: 1.4% for AGIs below $10k, 1.6% for AGIs $10k-25k, 2.4% for AGIs $25k-50k, 2.9% for AGIs $50k-75k, 3.2% for AGIs $75k-100k, 3.2% for AGIs over 100k)
Total tax: $9,099 (reported on 80.9% of returns)
24551:
$9,099
State:
$9,537
(% of AGI for various income ranges: 3.7% for AGIs below $10k, 4.3% for AGIs $10k-25k, 7.0% for AGIs $25k-50k, 8.2% for AGIs $50k-75k, 9.4% for AGIs $75k-100k, 16.8% for AGIs over 100k)
Earned income credit: $1,549 (reported on 7.0% of returns)
Here:
$1,549
State:
$1,734
Percentage of individuals using paid preparers for their 2004 taxes: 47.5%
Here:
47%
State:
52%
(% for various income ranges: 39.4% for AGIs below $10k, 46.9% for AGIs $10k-25k, 51.5% for AGIs $25k-50k, 49.6% for AGIs $50k-75k, 43.5% for AGIs $75k-100k, 53.3% for AGIs over 100k)
Household received Food Stamps/SNAP in the past 12 months: 281 Household did not receive Food Stamps/SNAP in the past 12 months: 10,261
Women who had a birth in the past 12 months: 305 (301 now married, 11 unmarried) Women who did not have a birth in the past 12 months: 5,766 (2,920 now married, 2,828 unmarried)
Housing units in zip code 24551 with a mortgage: 5,814 (410 second mortgage, 362 both second mortgage and home equity loan) Houses without a mortgage: 500
Median monthly owner costs for units with a mortgage: $1,603 Median monthly owner costs for units without a mortgage: $444
Residents with income below the poverty level in 2022:
This zip code:
5.4%
Whole state:
10.6%
Residents with income below 50% of the poverty level in 2022:
This zip code:
2.9%
Whole state:
5.2%
Median number of rooms in houses and condos:
Here:
7.6
State:
7.0
Median number of rooms in apartments:
Here:
4.2
State:
4.3
Notable locations in this zip code not listed on our city pages
Notable locations in zip code 24551: Poplar Forest Golf Course (A), London Downs Golf Course (B), Camp Ruthers (C), Colonial Hills Golf Course (D), Ivy Hills Golf Club (E), Red House Volunteer Fire Department (F), Campbell County Rescue Squad Number 5 (G), Forest Fire Station Company Number5 (H). Display/hide their locations on the map
Churches in zip code 24551 include: Academy Presbyterian Church (A), Altha Grove Church (B), Bethany Church (C), Bethel Church (D), Saint Johns Church (E), Saint Pauls Church (F), Saint Stephens Church (G), Chestnut Grove Church (H), Terrace View Church (I). Display/hide their locations on the map
Cemeteries: Virginia Memorial Park (1), Callaway-Steptoe Cemetery (2), Grange Cemetery (3), North Cemetery (4), Norwood Cemetery (5). Display/hide their locations on the map
In group quarters: 73 (-1 institutionalized population)
Size of family households: 3,963 2-persons, 1,419 3-persons, 1,369 4-persons, 555 5-persons, 418 6-persons, 177 7-or-more-persons
Size of nonfamily households: 2,279 1-person, 377 2-persons, 112 3-persons
4,707 married couples with children.
744 single-parent households (186 men, 558 women).
96.7% of residents of 24551 zip code speak English at home.
1.6% of residents speak Spanish at home (54% very well, 17% well, 25% not well, 5% not at all).
0.6% of residents speak other Indo-European language at home (82% very well, 18% well).
0.5% of residents speak Asian or Pacific Island language at home (60% very well, 14% well, 22% not well, 4% not at all).
0.3% of residents speak other language at home (100% very well).
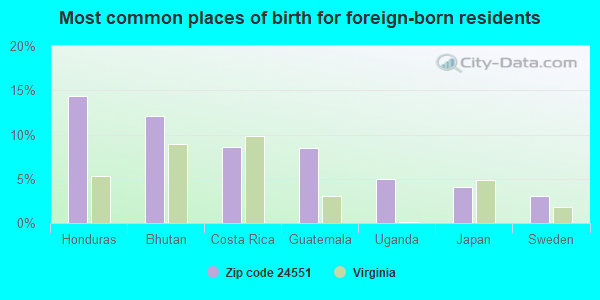
Foreign born population: 807 (3.0%) (60.4% of them are naturalized citizens)
This zip code:
3.0%
Whole state:
12.7%
14%Honduras
12%Bhutan
9%Costa Rica
8%Guatemala
5%Uganda
4%Japan
3%Sweden
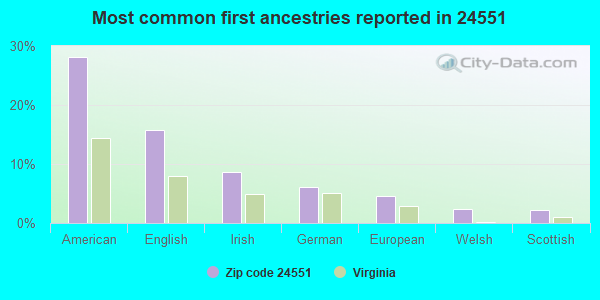
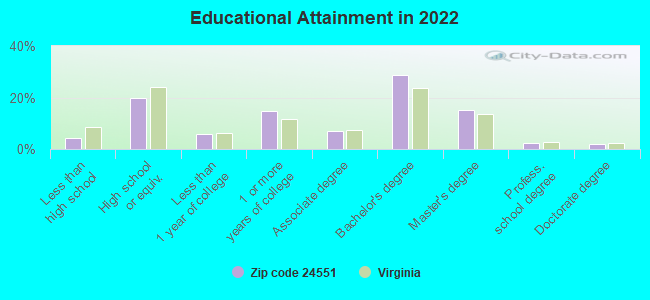
28%American
16%English
9%Irish
6%German
5%European
2%Welsh
2%Scottish
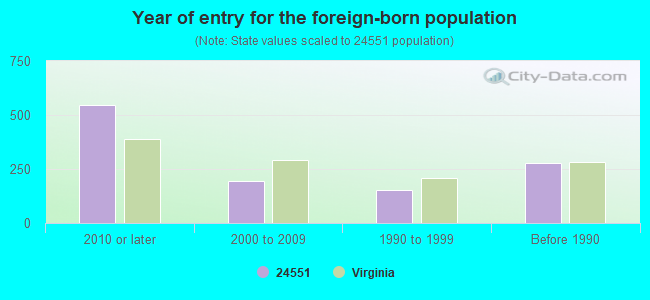
Year of entry for the foreign-born population
5482010 or later
1952000 to 2009
1521990 to 1999
276Before 1990
Facilities with environmental interests located in this zip code:
BEDFORD CO - NEW LONDON ACADEMY (12400 EAST LYNCHBURG SALEM TPKE in FOREST, VA)
AIR MINOR (AIRS/AFS) STATE MASTER (Virginia pollutants databases) - CEDS-30290, AIR PROGRAM (National Center for Education Statistics) - STATE ID-0100610 National Pollutant Discharge Elimination System NON-MAJOR (Tracking pollutant discharge elimination systems) - permit Business SIC classification: SEWERAGE SYSTEMS; ELEMENTARY AND SECONDARY SCHOOLS Business NAICS classification: ELEMENTARY AND SECONDARY SCHOOLS. Organizations: BEDFORD COUNTY PUBLIC SCHOOLS (SCHOOL DISTRICT)
Alternative names: BEDFORD CO.SCHOOL BD.,NEW LOND, NEW LOUDON ACADEMY
BEDFORD CO - JEFFERSON FOREST HIGH (ROUTE 221 in FOREST, VA)
AIR MINOR (AIRS/AFS) STATE MASTER (Virginia pollutants databases) - CEDS-30262, AIR PROGRAM Business SIC and NAICS classification: ELEMENTARY AND SECONDARY SCHOOLS Alternative names: JEFFERSON FOREST HIGH SCHOOL
BUFFALO AIR HANDLING - FOREST (12740 LYNCHBURG SALEM TURNPIKE in FOREST, VA)
AIR MINOR (AIRS/AFS) STATE MASTER (Virginia pollutants databases) - CEDS-31051, AIR PROGRAM Business SIC classification: SHEET METALWORK Business NAICS classification: SHEET METAL WORK MANUFACTURING.
ANDREW CORP (140 VISTA CENTRE DR in FOREST, VA)
TRI REPORTER (Tracking of toxic chemicals releasing facilities) Business SIC classification: RADIO AND TELEVISION BROADCASTING AND COMMUNICATIONS EQUIPMENT Alternative names: GRAYSON WIRELESS
Housing units lacking complete plumbing facilities: 0.4% Housing units lacking complete kitchen facilities: 0.4%
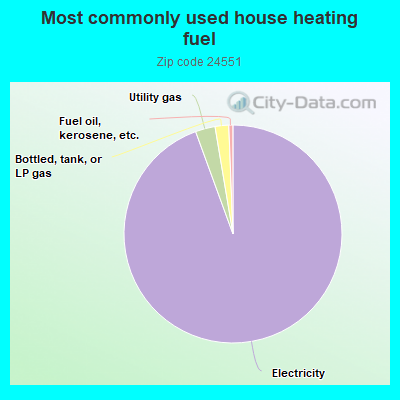
93.5%Electricity
2.9%Utility gas
2.0%Bottled, tank, or LP gas
0.6%Fuel oil, kerosene, etc.
Population in 1990: 12,905. Population change in the 1990s: +3,511 (+27.2%).
Place of birth for U.S.-born residents:
This state: 14,900
Northeast: 3,652
Midwest: 2,175
South: 4,221
West: 891
57% of the 24551 zip code residents lived in the same house 5 years ago. Out of people who lived in different houses, 29% lived in this county. Out of people who lived in different counties, 50% lived in Virginia.
87% of the 24551 zip code residents lived in the same house 1 year ago. Out of people who lived in different houses, 18% moved from this county. Out of people who lived in different houses, 61% moved from different county within same state. Out of people who lived in different houses, 23% moved from different state.
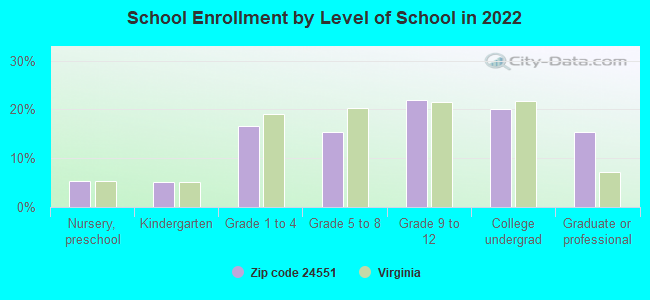
Private vs. public school enrollment:
Students in private schools in grades 1 to 8 (elementary and middle school): 698
Here:
31.8%
Virginia:
13.2%
Students in private schools in grades 9 to 12 (high school): 345
Here:
23.4%
Virginia:
10.2%
Students in private undergraduate colleges: 668
Here:
51.4%
Virginia:
18.7%
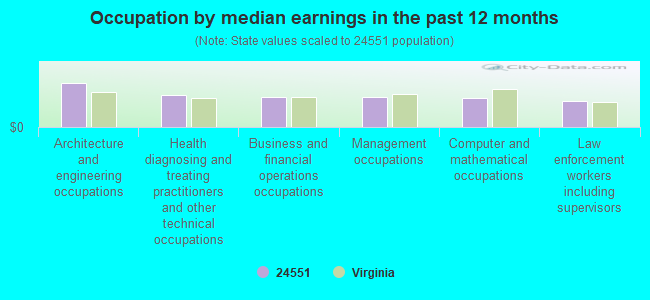
Occupation by median earnings in the past 12 months ($)
111,691Architecture and engineering occupations
80,383Health diagnosing and treating practitioners and other technical occupations
75,618Business and financial operations occupations
75,218Management occupations
73,543Computer and mathematical occupations
64,782Law enforcement workers including supervisors
Companies with federal contracts located in this zip code (FOREST, VA):
INNOVATIVE WIRELESS TECHNOLOGI (1047 VISTA PARK DR STE A; small business) : $4,566,751 in 14 contractsfrom 2002 to 2006
Contracts for Defense Electronics and Communication Equipment -- Basic Research (R&D), Other Defense -- Management and Support (R&D), Other Medical -- Basic Research (R&D), Mathematical and Computer Sciences -- Engineering Development (R&D), and moreby Army, National Institute of Standards and Technology, NASA Signed by year:2000: $0; 2001: $0; 2002: $69,896; 2003: $609,141; 2004: $685,236; 2005: $1,191,325; 2006: $2,011,153.
Biggest contracts:
$2,011,153 with Army for Defense Electronics and Communication Equipment -- Basic Research (R&D). Signed on 2006-05-15. Completion date: 2007-09-04.
$500,000, same as above.Signed on 2005-11-14. Completion date: 2005-11-20.
$489,261, same as above.Signed on 2003-11-13. Completion date: 2005-11-20.
$372,401 with Army for Other Defense -- Management and Support (R&D). Signed on 2004-12-01. Completion date: 2006-12-15.
FMR-INC (752 ALUM SPRINGS ROAD; small business) : $72,585 in 2 contractsfrom 2003 to 2004
$40,725 with Navy for Radio and Television Communication Equipment, Except Airborne. Signed on 2004-04-01. Completion date: 2004-04-08.
$31,860, same as above.Signed on 2003-08-23. Completion date: 2003-09-05.
M/A-COM, INC (12860 E LYNCHBURG SALEM T; small business)
$59,245 with Navy for Radio and Television Communication Equipment, Except Airborne. Signed on 2006-04-18. Completion date: 2006-09-18.
DETECTION MONITORING TECHNOLOG (5106 WATERLICK RD; small business)
$59,116 with Navy for Miscellaneous Items. Signed on 2005-05-23. Completion date: 2005-10-28.
ATCO PRODUCTS, INC (1002 PERFORMANCE ROAD; small business)
$6,708 with Defense Logistics Agency for O-Ring. Taking place in PA. Signed on 2004-10-06. Completion date: 2004-12-06.
TECHNICAL PUBLICATIONS SERVICE (110 VISTA CENTRE DRIVE; small business)
$4,890 with Army for Advertising Services. Signed on 2004-09-02. Completion date: 2004-09-30.
Top industries in this zip code by the number of employees in 2005:
Administrative and Support and Waste Management and Remediation Services: Temporary Help Services (250-499 employees: 1 establishment, 100-249 employees: 1 establishment, 50-99 employees: 1 establishment, 1-4 employees: 2 establishments)
Administrative and Support and Waste Management and Remediation Services: Telemarketing Bureaus (250-499: 1)
Other Services (except Public Administration): Religious Organizations (100-249: 1, 50-99: 1, 10-19: 1, 5-9: 4, 1-4: 7)
Administrative and Support and Waste Management and Remediation Services: Office Administrative Services (100-249: 1, 20-49: 2)
Construction: Commercial and Institutional Building Construction (100-249: 1, 5-9: 1)
Professional, Scientific, and Technical Services: Direct Mail Advertising (100-249: 1, 5-9: 1)
Construction: Other Building Equipment Contractors (100-249: 1)
People in group quarters in 2010:
22 people in group homes intended for adults
6 people in residential treatment centers for adults
People in group quarters in 2000:
22 people in homes or halfway houses for drug/alcohol abuse
Fatal accident statistics in 2011:
Fatal accident count: 2
Vehicles involved in fatal accidents: 2
Fatal accidents caused by drunken drivers: 0
Fatalities: 2
Persons involved in fatal accidents: 4
Pedestrians involved in fatal accidents: 1
Home Mortgage Disclosure Act Aggregated Statistics For Year 2009 (Based on 10 partial tracts)
A) FHA, FSA/RHS & VA Home Purchase Loans
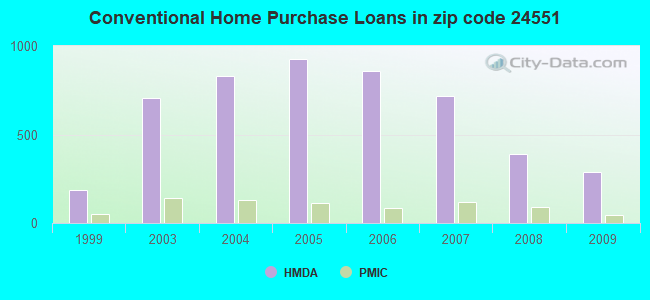
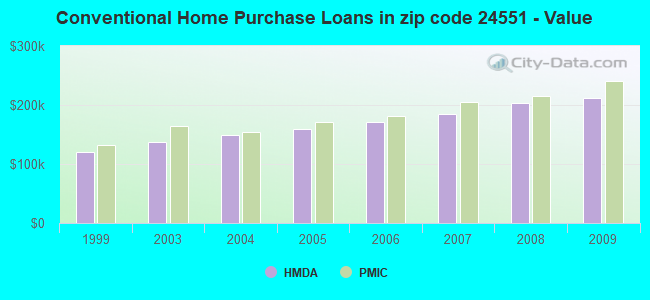
B) Conventional Home Purchase Loans
C) Refinancings
D) Home Improvement Loans
E) Loans on Dwellings For 5+ Families
F) Non-occupant Loans on < 5 Family Dwellings (A B C & D)
G) Loans On Manufactured Home Dwelling (A B C & D)
Number
Average Value
Number
Average Value
Number
Average Value
Number
Average Value
Number
Average Value
Number
Average Value
Number
Average Value
LOANS ORIGINATED
146
$183,226
289
$211,989
1,192
$196,370
62
$97,130
6
$519,513
34
$147,175
3
$110,080
APPLICATIONS APPROVED, NOT ACCEPTED
6
$150,240
17
$167,990
79
$200,385
2
$301,355
0
$0
2
$176,625
1
$117,180
APPLICATIONS DENIED
15
$167,167
27
$249,112
221
$211,040
19
$81,668
0
$0
20
$159,133
2
$171,015
APPLICATIONS WITHDRAWN
6
$294,120
17
$194,624
133
$192,409
6
$156,093
0
$0
13
$138,565
0
$0
FILES CLOSED FOR INCOMPLETENESS
7
$215,461
5
$251,416
57
$214,089
1
$173,770
0
$0
8
$195,908
0
$0
Aggregated Statistics For Year 2008 (Based on 10 partial tracts)
A) FHA, FSA/RHS & VA Home Purchase Loans
B) Conventional Home Purchase Loans
C) Refinancings
D) Home Improvement Loans
E) Loans on Dwellings For 5+ Families
F) Non-occupant Loans on < 5 Family Dwellings (A B C & D)
G) Loans On Manufactured Home Dwelling (A B C & D)
Number
Average Value
Number
Average Value
Number
Average Value
Number
Average Value
Number
Average Value
Number
Average Value
Number
Average Value
LOANS ORIGINATED
99
$184,282
389
$204,221
680
$180,819
67
$94,152
6
$1,071,748
68
$238,194
8
$110,069
APPLICATIONS APPROVED, NOT ACCEPTED
5
$197,482
32
$223,673
97
$183,933
6
$21,268
0
$0
7
$238,486
3
$68,950
APPLICATIONS DENIED
6
$174,033
27
$233,608
297
$213,608
47
$141,054
0
$0
12
$208,841
3
$79,177
APPLICATIONS WITHDRAWN
11
$167,669
40
$194,226
125
$188,344
13
$104,304
0
$0
4
$102,785
1
$124,610
FILES CLOSED FOR INCOMPLETENESS
2
$136,810
9
$201,157
29
$193,786
6
$29,273
0
$0
0
$0
1
$115,460
Aggregated Statistics For Year 2007 (Based on 10 partial tracts)
A) FHA, FSA/RHS & VA Home Purchase Loans
B) Conventional Home Purchase Loans
C) Refinancings
D) Home Improvement Loans
E) Loans on Dwellings For 5+ Families
F) Non-occupant Loans on < 5 Family Dwellings (A B C & D)
G) Loans On Manufactured Home Dwelling (A B C & D)
Number
Average Value
Number
Average Value
Number
Average Value
Number
Average Value
Number
Average Value
Number
Average Value
Number
Average Value
LOANS ORIGINATED
44
$163,867
718
$184,145
709
$169,082
89
$70,348
9
$471,854
78
$165,177
15
$80,595
APPLICATIONS APPROVED, NOT ACCEPTED
3
$169,063
44
$205,238
113
$180,322
17
$50,425
0
$0
8
$286,486
0
$0
APPLICATIONS DENIED
2
$120,040
66
$183,719
261
$197,125
49
$64,293
0
$0
14
$125,324
8
$93,006
APPLICATIONS WITHDRAWN
1
$222,580
34
$171,926
149
$196,740
14
$104,001
0
$0
6
$166,337
0
$0
FILES CLOSED FOR INCOMPLETENESS
3
$183,353
16
$153,352
41
$241,674
2
$39,475
0
$0
0
$0
0
$0
Aggregated Statistics For Year 2006 (Based on 10 partial tracts)
A) FHA, FSA/RHS & VA Home Purchase Loans
B) Conventional Home Purchase Loans
C) Refinancings
D) Home Improvement Loans
E) Loans on Dwellings For 5+ Families
F) Non-occupant Loans on < 5 Family Dwellings (A B C & D)
G) Loans On Manufactured Home Dwelling (A B C & D)
Number
Average Value
Number
Average Value
Number
Average Value
Number
Average Value
Number
Average Value
Number
Average Value
Number
Average Value
LOANS ORIGINATED
53
$155,787
856
$170,703
736
$140,731
108
$48,038
6
$986,027
99
$113,178
12
$72,854
APPLICATIONS APPROVED, NOT ACCEPTED
2
$162,845
77
$143,772
118
$135,564
21
$46,766
0
$0
4
$163,815
2
$83,140
APPLICATIONS DENIED
12
$189,073
104
$157,103
324
$134,956
61
$54,915
0
$0
18
$150,174
28
$69,481
APPLICATIONS WITHDRAWN
1
$128,800
73
$134,458
253
$161,091
17
$116,545
0
$0
9
$133,972
4
$137,608
FILES CLOSED FOR INCOMPLETENESS
2
$151,800
20
$156,100
45
$160,332
2
$47,320
0
$0
2
$121,095
0
$0
Aggregated Statistics For Year 2005 (Based on 10 partial tracts)
A) FHA, FSA/RHS & VA Home Purchase Loans
B) Conventional Home Purchase Loans
C) Refinancings
D) Home Improvement Loans
E) Loans on Dwellings For 5+ Families
F) Non-occupant Loans on < 5 Family Dwellings (A B C & D)
G) Loans On Manufactured Home Dwelling (A B C & D)
Number
Average Value
Number
Average Value
Number
Average Value
Number
Average Value
Number
Average Value
Number
Average Value
Number
Average Value
LOANS ORIGINATED
59
$158,999
926
$158,526
870
$140,537
65
$40,149
6
$384,550
78
$138,311
8
$44,102
APPLICATIONS APPROVED, NOT ACCEPTED
2
$129,325
79
$153,482
152
$113,435
13
$34,883
0
$0
8
$81,409
11
$91,546
APPLICATIONS DENIED
6
$159,128
93
$153,792
346
$150,229
58
$37,094
0
$0
26
$145,512
22
$66,752
APPLICATIONS WITHDRAWN
2
$130,340
56
$165,875
221
$154,900
39
$126,119
0
$0
5
$93,738
2
$101,135
FILES CLOSED FOR INCOMPLETENESS
4
$127,568
19
$163,211
55
$163,606
11
$69,207
0
$0
4
$101,685
0
$0
Aggregated Statistics For Year 2004 (Based on 10 partial tracts)
A) FHA, FSA/RHS & VA Home Purchase Loans
B) Conventional Home Purchase Loans
C) Refinancings
D) Home Improvement Loans
E) Loans on Dwellings For 5+ Families
F) Non-occupant Loans on < 5 Family Dwellings (A B C & D)
G) Loans On Manufactured Home Dwelling (A B C & D)
Number
Average Value
Number
Average Value
Number
Average Value
Number
Average Value
Number
Average Value
Number
Average Value
Number
Average Value
LOANS ORIGINATED
49
$140,317
830
$148,647
868
$128,710
58
$25,738
3
$1,580,690
66
$120,960
7
$62,883
APPLICATIONS APPROVED, NOT ACCEPTED
0
$0
47
$152,171
141
$108,214
13
$156,872
0
$0
4
$28,830
5
$91,366
APPLICATIONS DENIED
7
$111,876
66
$140,111
258
$119,563
57
$35,576
0
$0
15
$107,367
22
$68,545
APPLICATIONS WITHDRAWN
0
$0
41
$187,921
206
$134,392
22
$58,029
0
$0
5
$138,374
3
$153,740
FILES CLOSED FOR INCOMPLETENESS
0
$0
11
$120,925
20
$142,463
3
$68,020
0
$0
1
$64,300
0
$0
Aggregated Statistics For Year 2003 (Based on 10 partial tracts)
A) FHA, FSA/RHS & VA Home Purchase Loans
B) Conventional Home Purchase Loans
C) Refinancings
D) Home Improvement Loans
E) Loans on Dwellings For 5+ Families
F) Non-occupant Loans on < 5 Family Dwellings (A B C & D)
Number
Average Value
Number
Average Value
Number
Average Value
Number
Average Value
Number
Average Value
Number
Average Value
LOANS ORIGINATED
84
$124,600
709
$137,902
2,171
$132,176
89
$65,916
2
$825,490
77
$116,450
APPLICATIONS APPROVED, NOT ACCEPTED
2
$73,030
37
$108,115
192
$138,134
10
$30,227
0
$0
11
$118,192
APPLICATIONS DENIED
9
$94,471
63
$129,220
302
$131,802
25
$57,195
0
$0
18
$122,513
APPLICATIONS WITHDRAWN
4
$152,282
36
$180,332
181
$134,271
3
$116,843
0
$0
3
$147,237
FILES CLOSED FOR INCOMPLETENESS
0
$0
15
$144,309
67
$157,876
2
$13,005
0
$0
0
$0
Aggregated Statistics For Year 1999 (Based on 3 partial tracts)
A) FHA, FSA/RHS & VA Home Purchase Loans
B) Conventional Home Purchase Loans
C) Refinancings
D) Home Improvement Loans
E) Loans on Dwellings For 5+ Families
F) Non-occupant Loans on < 5 Family Dwellings (A B C & D)
2002 - 2018 National Fire Incident Reporting System (NFIRS) incidents
According to the data from the years 2002 - 2018 the average number of fire incidents per year is 54. The highest number of reported fires - 95 took place in 2010, and the least - 26 in 2017. The data has a rising trend.
When looking into fire subcategories, the most incidents belonged to: Structure Fires (48.4%), and Outside Fires (34.9%).
Fire incident types reported to NFIRS in Zip Code 24551
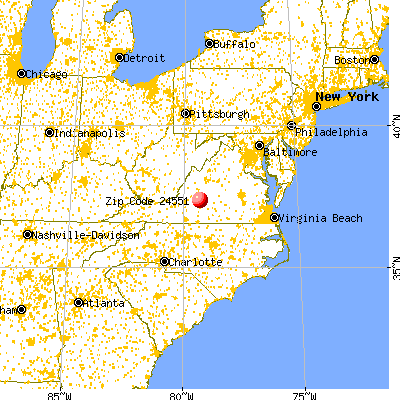


 Nearest zip codes: 24556, 24570, 24502, 24503, 24536, 24550.


 According to the data from the years 2002 - 2018 the average number of fire incidents per year is 54. The highest number of reported fires - 95 took place in 2010, and the least - 26 in 2017. The data has a rising trend.
 When looking into fire subcategories, the most incidents belonged to: Structure Fires (48.4%), and Outside Fires (34.9%).