Estimated zip code population in 2022: 20,154 Zip code population in 2010: 19,331 Zip code population in 2000: 17,633
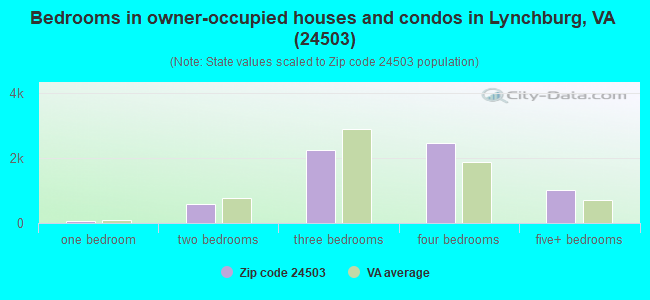
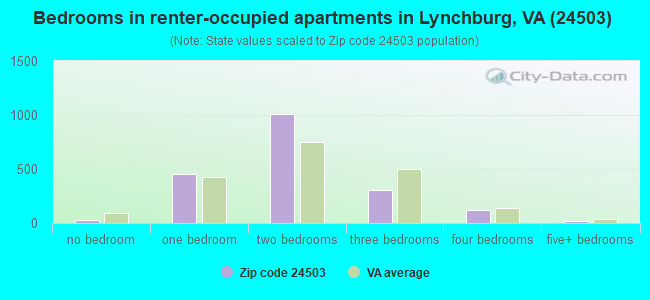
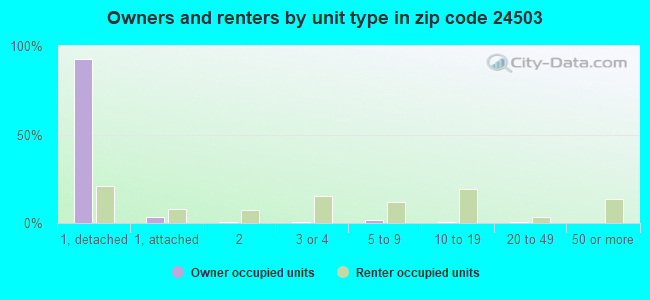
Houses and condos: 9,024 Renter-occupied apartments: 1,947
% of renters here:
23%
State:
33%
March 2022 cost of living index in zip code 24503: 84.0 (less than average, U.S. average is 100)
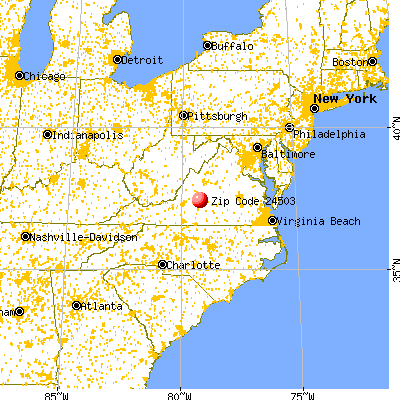
Land area: 41.8 sq. mi. Water area: 0.8 sq. mi.
Population density: 482 people per square mile
(low).
OSM Map
General Map
Google Map
MSN Map
OSM Map
General Map
Google Map
MSN Map
OSM Map
General Map
Google Map
MSN Map
OSM Map
General Map
Google Map
MSN Map
Please wait while loading the map...
Real estate property taxes paid for housing units in 2022:
This zip code:
0.7% ($2,215)
Virginia:
0.7% ($2,617)
Median real estate property taxes paid for housing units with mortgages in 2022: $2,278 (0.7%) Median real estate property taxes paid for housing units with no mortgage in 2022: $2,196 (0.7%)
Business Search- 14 Million verified businesses
Males: 9,399
(46.6%)
Females: 10,754
(53.4%)
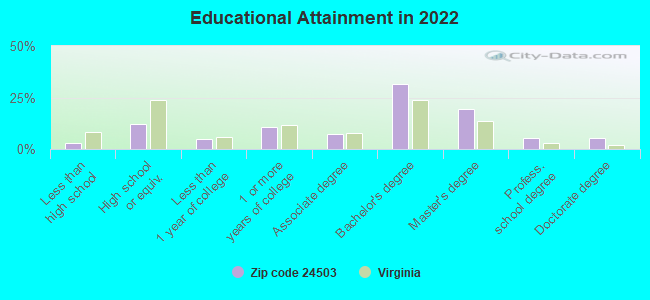
For population 25 years and over in 24503:
High school or higher: 97.8%
Bachelor's degree or higher: 62.3%
Graduate or professional degree: 30.6%
Unemployed: 2.7%
Mean travel time to work (commute): 18.6 minutes
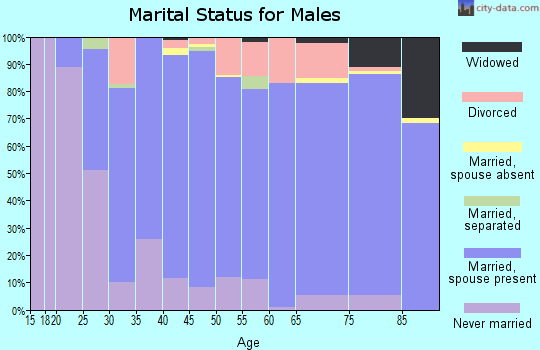
For population 15 years and over in 24503:
Never married: 28.7%
Now married: 54.8%
Separated: 1.2%
Widowed: 5.9%
Divorced: 9.4%
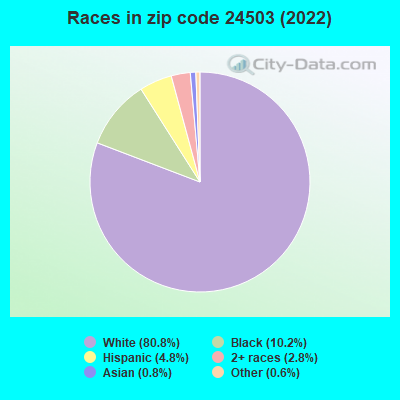
Zip code 24503 compared to state average:
Black race population percentage below state average.
Hispanic race population percentage below state average.
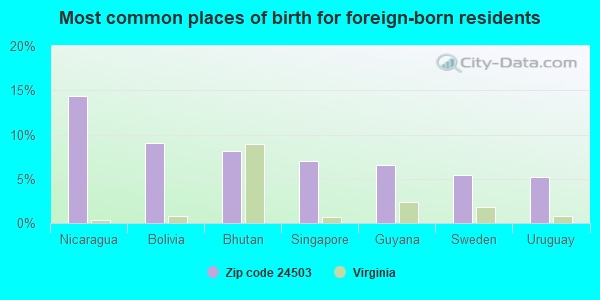
Foreign-born population percentage significantly below state average.
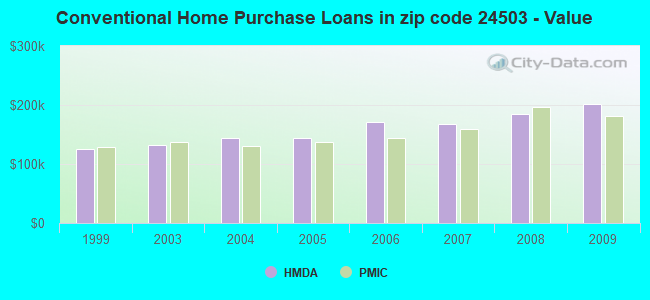
Estimated median house/condo value in 2022: $315,871
24503:
$315,871
Virginia:
$365,700
According to our research of Virginia and other state lists, there were 27 registered sex offenders living in 24503 zip code as of April 26, 2024. The ratio of all residents to sex offenders in zip code 24503 is 708 to 1. The ratio of registered sex offenders to all residents in this zip code is lower than the state average.
Median resident age:
This zip code:
42.6 years
Virginia median age:
39.0 years
Average household size:
This zip code:
2.3 people
Virginia:
2.5 people
Averages for the 2020 tax year for zip code 24503, filed in 2021:
Average Adjusted Gross Income (AGI) in 2020: $105,544 (Individual Income Tax Returns)
Here:
$105,544
State:
$86,446
Salary/wage: $78,329 (reported on 76.5% of returns)
Here:
$78,329
State:
$71,185
(% of AGI for various income ranges: 1190.6% for AGIs below $25k, 3394.7% for AGIs $25k-50k, 5994.1% for AGIs $50k-75k, 8711.5% for AGIs $75k-100k, 16644.8% for AGIs $100k-200k, 66762.4% for AGIs over 200k)
Taxable interest for individuals: $2,665 (reported on 42.0% of returns)
This zip code:
$2,665
Virginia:
$1,805
(% of AGI for various income ranges: 20.5% for AGIs below $25k, 27.1% for AGIs $25k-50k, 92.8% for AGIs $50k-75k, 139.1% for AGIs $75k-100k, 319.8% for AGIs $100k-200k, 1448.4% for AGIs over 200k)
Ordinary dividends: $13,604 (reported on 36.8% of returns)
Here:
$13,604
State:
$8,327
(% of AGI for various income ranges: 80.6% for AGIs below $25k, 135.1% for AGIs $25k-50k, 361.9% for AGIs $50k-75k, 654.1% for AGIs $75k-100k, 1365.6% for AGIs $100k-200k, 6690.3% for AGIs over 200k)
Net capital gain/loss in AGI: +$30,034 (reported on 33.0% of returns)
Here:
+$30,034
State:
+$24,644
(% of AGI for various income ranges: 28.2% for AGIs below $25k, 67.8% for AGIs $25k-50k, 234.6% for AGIs $50k-75k, 433.1% for AGIs $75k-100k, 1205.1% for AGIs $100k-200k, 20605.7% for AGIs over 200k)
Profit/loss from business: +$14,701 (reported on 17.6% of returns)
Here:
+$14,701
State:
+$12,836
(% of AGI for various income ranges: 91.3% for AGIs below $25k, 107.4% for AGIs $25k-50k, 236.4% for AGIs $50k-75k, 461.3% for AGIs $75k-100k, 574.3% for AGIs $100k-200k, 3145.7% for AGIs over 200k)
Taxable individual retirement arrangement distribution: $30,528 (reported on 15.4% of returns)
24503:
$30,528
Virginia:
$21,535
(% of AGI for various income ranges: 57.5% for AGIs below $25k, 174.1% for AGIs $25k-50k, 374.9% for AGIs $50k-75k, 688.9% for AGIs $75k-100k, 1683.4% for AGIs $100k-200k, 5022.2% for AGIs over 200k)
Self-employed (Keogh) retirement plans: $20,800 (reported on 1.0% of returns)
24503:
$20,800
Virginia:
$31,172
(% of AGI for various income ranges: 50.0% for AGIs $75k-100k, 433.0% for AGIs over 200k)
Total itemized deductions: $41,952 (reported on 16.4% of returns)
Here:
$41,952
State:
$33,287
(% of AGI for various income ranges: 70.9% for AGIs below $25k, 232.9% for AGIs $25k-50k, 594.1% for AGIs $50k-75k, 972.6% for AGIs $75k-100k, 1982.4% for AGIs $100k-200k, 8593.0% for AGIs over 200k)
Charity contributions: $17,570 (reported on 14.8% of returns)
Here:
$17,570
State:
$10,381
(% of AGI for various income ranges: 7.7% for AGIs below $25k, 25.9% for AGIs $25k-50k, 114.7% for AGIs $50k-75k, 205.2% for AGIs $75k-100k, 596.2% for AGIs $100k-200k, 4412.2% for AGIs over 200k)
Taxes paid: $7,524 (reported on 16.4% of returns)
24503:
$7,524
State:
$8,284
(% of AGI for various income ranges: 7.2% for AGIs below $25k, 24.6% for AGIs $25k-50k, 88.5% for AGIs $50k-75k, 160.6% for AGIs $75k-100k, 416.5% for AGIs $100k-200k, 1539.7% for AGIs over 200k)
Earned income credit: $2,006 (reported on 10.3% of returns)
Here:
$2,006
State:
$2,214
(% of AGI for various income ranges: 63.5% for AGIs below $25k, 59.4% for AGIs $25k-50k, 1.9% for AGIs $50k-75k)
Percentage of individuals using paid preparers for their 2020 taxes: 92.7%
Here:
93%
State:
92%
(% for various income ranges: 91.4% for AGIs below $25k, 92.9% for AGIs $25k-50k, 94.1% for AGIs $50k-75k, 92.1% for AGIs $75k-100k, 92.3% for AGIs $100k-200k, 95.3% for AGIs over 200k)
Averages for the 2012 tax year for zip code 24503, filed in 2013:
Average Adjusted Gross Income (AGI) in 2012: $88,900 (Individual Income Tax Returns)
Here:
$88,900
State:
$71,192
Salary/wage: $68,722 (reported on 78.7% of returns)
Here:
$68,722
State:
$59,229
(% of AGI for various income ranges: 72.2% for AGIs below $25k, 71.6% for AGIs $25k-50k, 65.7% for AGIs $50k-75k, 66.2% for AGIs $75k-100k, 67.0% for AGIs $100k-200k, 52.0% for AGIs over 200k)
Taxable interest for individuals: $2,374 (reported on 46.7% of returns)
This zip code:
$2,374
Virginia:
$1,600
(% of AGI for various income ranges: 1.8% for AGIs below $25k, 1.3% for AGIs $25k-50k, 1.2% for AGIs $50k-75k, 1.3% for AGIs $75k-100k, 1.1% for AGIs $100k-200k, 1.2% for AGIs over 200k)
Ordinary dividends: $11,971 (reported on 39.0% of returns)
Here:
$11,971
State:
$6,959
(% of AGI for various income ranges: 4.7% for AGIs below $25k, 3.3% for AGIs $25k-50k, 4.2% for AGIs $50k-75k, 4.0% for AGIs $75k-100k, 4.9% for AGIs $100k-200k, 6.3% for AGIs over 200k)
Net capital gain/loss in AGI: +$17,831 (reported on 32.0% of returns)
Here:
+$17,831
State:
+$16,672
(% of AGI for various income ranges: 0.2% for AGIs $25k-50k, 0.9% for AGIs $50k-75k, 1.0% for AGIs $75k-100k, 2.8% for AGIs $100k-200k, 12.6% for AGIs over 200k)
Profit/loss from business: +$14,319 (reported on 15.1% of returns)
Here:
+$14,319
State:
+$14,116
(% of AGI for various income ranges: 5.1% for AGIs below $25k, 2.4% for AGIs $25k-50k, 2.7% for AGIs $50k-75k, 1.8% for AGIs $75k-100k, 2.2% for AGIs $100k-200k, 2.4% for AGIs over 200k)
Taxable individual retirement arrangement distribution: $23,674 (reported on 17.2% of returns)
24503:
$23,674
Virginia:
$16,667
(% of AGI for various income ranges: 4.3% for AGIs below $25k, 4.2% for AGIs $25k-50k, 4.4% for AGIs $50k-75k, 4.5% for AGIs $75k-100k, 5.5% for AGIs $100k-200k, 4.2% for AGIs over 200k)
Self-employment retirement plans: $13,567 (reported on 1.0% of returns)
24503:
$13,567
Virginia:
$25,373
(% of AGI for various income ranges: 0.2% for AGIs $100k-200k, 0.3% for AGIs over 200k)
Total itemized deductions: $29,441 (19% of AGI, reported on 45.9% of returns)
Here:
$29,441
State:
$26,596
Here:
18.9% of AGI
State:
20.1% of AGI
(% of AGI for various income ranges: 14.9% for AGIs below $25k, 14.9% for AGIs $25k-50k, 16.4% for AGIs $50k-75k, 16.7% for AGIs $75k-100k, 17.1% for AGIs $100k-200k, 13.6% for AGIs over 200k)
Charity contributions: $7,758 (reported on 40.6% of returns)
Here:
$7,758
State:
$4,443
(% of AGI for various income ranges: 1.1% for AGIs below $25k, 2.0% for AGIs $25k-50k, 3.0% for AGIs $50k-75k, 3.0% for AGIs $75k-100k, 3.6% for AGIs $100k-200k, 4.3% for AGIs over 200k)
Taxes paid: $10,831 (reported on 45.7% of returns)
24503:
$10,831
State:
$9,951
(% of AGI for various income ranges: 1.8% for AGIs below $25k, 2.7% for AGIs $25k-50k, 3.9% for AGIs $50k-75k, 5.0% for AGIs $75k-100k, 7.0% for AGIs $100k-200k, 6.1% for AGIs over 200k)
Earned income credit: $2,021 (reported on 11.5% of returns)
Here:
$2,021
State:
$2,211
(% of AGI for various income ranges: 4.7% for AGIs below $25k, 0.8% for AGIs $25k-50k)
Percentage of individuals using paid preparers for their 2012 taxes: 49.6%
Here:
50%
State:
46%
(% for various income ranges: 40.5% for AGIs below $25k, 43.5% for AGIs $25k-50k, 51.3% for AGIs $50k-75k, 51.8% for AGIs $75k-100k, 57.1% for AGIs $100k-200k, 78.9% for AGIs over 200k)
Averages for the 2004 tax year for zip code 24503, filed in 2005:
Average Adjusted Gross Income (AGI) in 2004: $73,275 (Individual Income Tax Returns)
Here:
$73,275
State:
$56,704
Salary/wage: $58,040 (reported on 77.8% of returns)
Here:
$58,040
State:
$48,441
(% of AGI for various income ranges: 157.7% for AGIs below $10k, 67.3% for AGIs $10k-25k, 71.3% for AGIs $25k-50k, 70.8% for AGIs $50k-75k, 69.0% for AGIs $75k-100k, 55.7% for AGIs over 100k)
Taxable interest for individuals: $2,754 (reported on 55.2% of returns)
This zip code:
$2,754
Virginia:
$1,688
(% of AGI for various income ranges: 15.0% for AGIs below $10k, 4.2% for AGIs $10k-25k, 2.5% for AGIs $25k-50k, 1.8% for AGIs $50k-75k, 2.0% for AGIs $75k-100k, 1.8% for AGIs over 100k)
Taxable dividends: $8,084 (reported on 44.7% of returns)
Here:
$8,084
State:
$4,028
(% of AGI for various income ranges: 17.8% for AGIs below $10k, 5.3% for AGIs $10k-25k, 4.1% for AGIs $25k-50k, 3.9% for AGIs $50k-75k, 4.3% for AGIs $75k-100k, 5.2% for AGIs over 100k)
Net capital gain/loss: +$12,235 (reported on 39.0% of returns)
Here:
+$12,235
State:
+$14,375
(% of AGI for various income ranges: -2.7% for AGIs below $10k, 2.1% for AGIs $10k-25k, 1.5% for AGIs $25k-50k, 1.8% for AGIs $50k-75k, 2.4% for AGIs $75k-100k, 9.3% for AGIs over 100k)
Profit/loss from business: +$14,304 (reported on 14.1% of returns)
Here:
+$14,304
State:
+$13,342
(% of AGI for various income ranges: -8.7% for AGIs below $10k, 3.4% for AGIs $10k-25k, 2.5% for AGIs $25k-50k, 3.2% for AGIs $50k-75k, 2.6% for AGIs $75k-100k, 2.8% for AGIs over 100k)
IRA payment deduction: $3,216 (reported on 3.4% of returns)
24503:
$3,216
Virginia:
$2,943
(% of AGI for various income ranges: 1.0% for AGIs below $10k, 0.3% for AGIs $10k-25k, 0.3% for AGIs $25k-50k, 0.3% for AGIs $50k-75k, 0.2% for AGIs $75k-100k, 0.1% for AGIs over 100k)
Self-employed pension: $13,767 (reported on 1.0% of returns)
Here:
$13,767
Virginia:
$17,430
Total itemized deductions: $23,281 (18% of AGI, reported on 48.1% of returns)
Here:
$23,281
State:
$21,492
Here:
18.5% of AGI
State:
21.0% of AGI
(% of AGI for various income ranges: 29.7% for AGIs below $10k, 16.6% for AGIs $10k-25k, 17.0% for AGIs $25k-50k, 18.0% for AGIs $50k-75k, 17.8% for AGIs $75k-100k, 13.8% for AGIs over 100k)
Charity contributions deductions: $6,369 (5% of AGI, reported on 43.6% of returns)
Here:
$6,369
State:
$3,794
Here:
4.8% of AGI
State:
3.5% of AGI
(% of AGI for various income ranges: 2.0% for AGIs below $10k, 1.9% for AGIs $10k-25k, 2.9% for AGIs $25k-50k, 3.1% for AGIs $50k-75k, 3.4% for AGIs $75k-100k, 4.3% for AGIs over 100k)
Total tax: $14,375 (reported on 79.0% of returns)
24503:
$14,375
State:
$9,537
(% of AGI for various income ranges: 4.2% for AGIs below $10k, 4.1% for AGIs $10k-25k, 6.9% for AGIs $25k-50k, 8.7% for AGIs $50k-75k, 10.0% for AGIs $75k-100k, 20.0% for AGIs over 100k)
Earned income credit: $1,520 (reported on 9.0% of returns)
Here:
$1,520
State:
$1,734
Percentage of individuals using paid preparers for their 2004 taxes: 54.4%
Here:
54%
State:
52%
(% for various income ranges: 49.1% for AGIs below $10k, 53.9% for AGIs $10k-25k, 51.3% for AGIs $25k-50k, 52.3% for AGIs $50k-75k, 51.6% for AGIs $75k-100k, 66.6% for AGIs over 100k)
Likely homosexual households (counted as self-reported same-sex unmarried-partner households)
Lesbian couples: 0.3% of all households
Gay men: 0.2% of all households
Household received Food Stamps/SNAP in the past 12 months: 388 Household did not receive Food Stamps/SNAP in the past 12 months: 7,854
Women who had a birth in the past 12 months: 262 (208 now married, 55 unmarried) Women who did not have a birth in the past 12 months: 4,331 (1,766 now married, 2,568 unmarried)
Housing units in zip code 24503 with a mortgage: 3,693 (453 second mortgage, 15 home equity loan, 390 both second mortgage and home equity loan) Houses without a mortgage: 320
Median monthly owner costs for units with a mortgage: $1,587 Median monthly owner costs for units without a mortgage: $524
Residents with income below the poverty level in 2022:
This zip code:
8.7%
Whole state:
10.6%
Residents with income below 50% of the poverty level in 2022:
This zip code:
5.9%
Whole state:
5.2%
Median number of rooms in houses and condos:
Here:
7.9
State:
7.0
Median number of rooms in apartments:
Here:
4.2
State:
4.3
Notable locations in this zip code not listed on our city pages
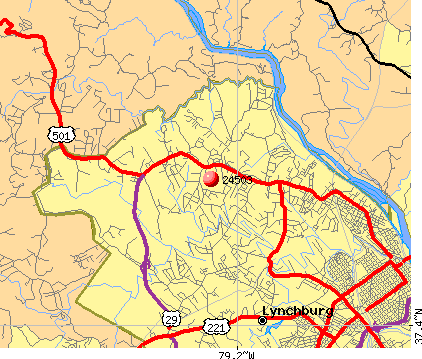
Notable locations in zip code 24503: Oakwood Country Club (A), Mabel K Whiteside Amphitheature (B), Boonsboro Country Club (C), Eagle Eyrie Virginia Baptist Assembly (D), Camp Sacajqwea (E), Holcomb Rock (F), Wright Residence Hall (G), Webb Residence Hall (H), Thoresen Theatre (I), Thoresen Hall (J), The Pines House (K), The Macon Bookshop (L), Terrell Health and Counseling Center (M), Norfolk House (N), Martin Science Building (O), Leggett Building (P), Houston Memorial Hall (Q), Darden Conference Center (R), Cheatham Dining Hall (S), Butler House (T). Display/hide their locations on the map
Churches in zip code 24503 include: Antioch Church (A), Boonsboro United Methodist Church (B), Frances Hundley Houston Chapel (C), First Christian Church (D), First Church of Christ Scientist (E), First Presbyterian Church (F), Peakland Baptist Church (G), Rivermont Baptist Church (H), Rivermont Presbyterian Church (I). Display/hide their locations on the map
3,623 married couples with children.
665 single-parent households (115 men, 550 women).
95.8% of residents of 24503 zip code speak English at home.
2.0% of residents speak Spanish at home (74% very well, 20% well, 6% not well).
1.8% of residents speak other Indo-European language at home (72% very well, 23% well, 5% not well).
0.3% of residents speak Asian or Pacific Island language at home (69% very well, 31% well).
0.2% of residents speak other language at home (100% very well).
Foreign born population: 513 (2.5%) (51.7% of them are naturalized citizens)
Facilities with environmental interests located in this zip code:
BUNCHER RAIL CAR SERVICE (3915 HYDRO STREET in LYNCHBURG, VA)
AIR SYNTHETIC MINOR (AIRS/AFS) STATE MASTER (Virginia pollutants databases) - CEDS-30697, AIR PROGRAM CRITERIA AND HAZARDOUS AIR POLLUTANT INVENTORY (Inventory of air pollution sources) HAZARDOUS WASTE BIENNIAL REPORTER (Resource Conservation and Recovery Act (tracking hazardous waste)) Large Quantity Generators, more that 1000 kg of hazardous waste/month (Resource Conservation and Recovery Act (tracking hazardous waste)) - notification Business SIC classification: TRANSPORTATION SERVICES Business NAICS classification: SUPPORT ACTIVITIES FOR RAIL TRANSPORTATION. Organizations: BUNCHER RAIL CAR SERVICE COMPANY (CONTACT/OPERATOR)
Alternative names: BRC RAIL CAR SERVICE COMPANY INC, BUNCHER RAILCAR SVC CO INC
BEDFORD CO - BOONSBORO ELEMENTARY (RT 501 NORTH in LYNCHBURG, VA)
AIR MINOR (AIRS/AFS) STATE MASTER (Virginia pollutants databases) - CEDS-30745, AIR PROGRAM Business SIC and NAICS classification: ELEMENTARY AND SECONDARY SCHOOLS Alternative names: BOONSBORO ELEMENTARY SCHOOL
BEDFORD HILLS ELEM. (4330 MORNINGSIDE DR in LYNCHBURG, VA)
(National Center for Education Statistics) - STATE ID-1150290 Organizations: LYNCHBURG CITY PUBLIC SCHOOLS (SCHOOL DISTRICT)
BOONSBORO ELEM. (1234 EAGLE CIRCLE in LYNCHBURG, VA)
(National Center for Education Statistics) - STATE ID-0100160 Organizations: BEDFORD COUNTY PUBLIC SCHOOLS (SCHOOL DISTRICT)
CHESAPEAKE & POTOMAC TELEPHONE CO (CLEARVIEW DR & BOONSBORO RD in LYNCHBURG, VA)
(Resource Conservation and Recovery Act (tracking hazardous waste)) Organizations: OPERNAME (CONTACT/OPERATOR)
, CHESAPEAKE & POTOMAC TELEPHONE COMPANY (CONTACT/OWNER)
7-ELEVEN #11972 (2315 BEDFORD AVE in LYNCHBURG, VA)
Small Quantity Generators, between 100 kg and 1000 kg of hazardous waste/month (Resource Conservation and Recovery Act (tracking hazardous waste)) - notification Organizations: OPERNAME (CONTACT/OPERATOR)
, SOUTHLAND CORPORATION THE (CONTACT/OWNER)
ACCURATE APPLIANCE SERVICE (401 BROOKFIELD ROAD in LYNCHBURG, VA)
AIR MINOR (AIRS/AFS) Business SIC classification: REFRIGERATION AND AIR-CONDITIONING SERVICE AND REPAIR SHOPS
BOONSBORO BODY SHOP INC (5217 BOONSBORO RD in LYNCHBURG, VA)
Small Quantity Generators, between 100 kg and 1000 kg of hazardous waste/month (Resource Conservation and Recovery Act (tracking hazardous waste)) - notification Business NAICS classification: AUTOMOTIVE BODY, PAINT, AND INTERIOR REPAIR AND MAINTENANCE. Organizations: AHS-INC (CONTACT/OWNER)
Housing units lacking complete plumbing facilities: 0.9% Housing units lacking complete kitchen facilities: 1.0%
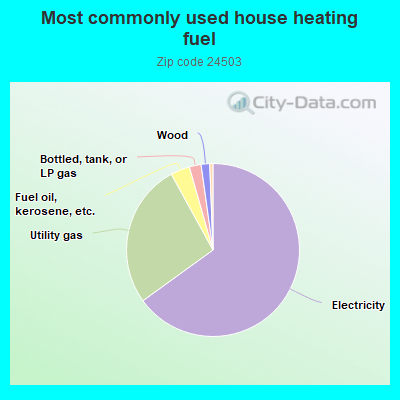
65.1%Electricity
27.0%Utility gas
3.6%Fuel oil, kerosene, etc.
2.2%Bottled, tank, or LP gas
1.6%Wood
Population in 1990: 17,816.
Place of birth for U.S.-born residents:
This state: 10,831
Northeast: 2,607
Midwest: 1,632
South: 3,221
West: 1,075
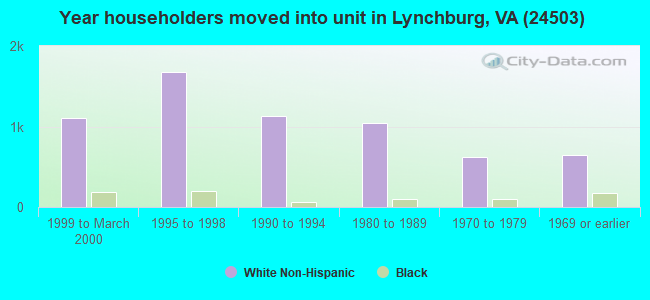
57% of the 24503 zip code residents lived in the same house 5 years ago. Out of people who lived in different houses, 40% lived in this county. Out of people who lived in different counties, 50% lived in Virginia.
91% of the 24503 zip code residents lived in the same house 1 year ago. Out of people who lived in different houses, 33% moved from this county. Out of people who lived in different houses, 38% moved from different county within same state. Out of people who lived in different houses, 29% moved from different state. Out of people who lived in different houses, 2% moved from abroad.
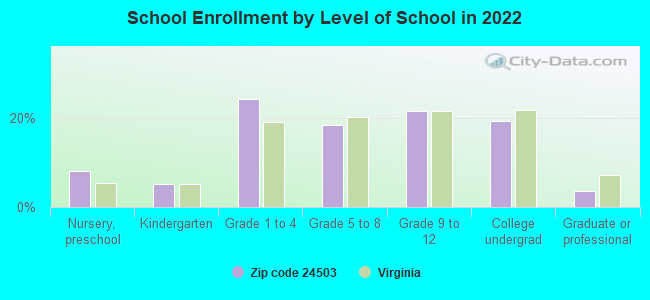
Private vs. public school enrollment:
Students in private schools in grades 1 to 8 (elementary and middle school): 723
Here:
34.2%
Virginia:
13.2%
Students in private schools in grades 9 to 12 (high school): 171
Here:
16.6%
Virginia:
10.2%
Students in private undergraduate colleges: 512
Here:
58.0%
Virginia:
18.7%
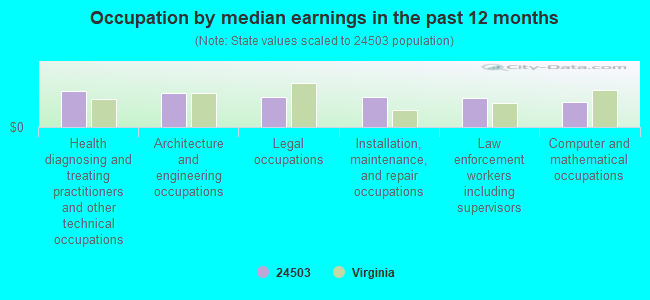
Occupation by median earnings in the past 12 months ($)
107,620Health diagnosing and treating practitioners and other technical occupations
102,869Architecture and engineering occupations
89,517Legal occupations
88,329Installation, maintenance, and repair occupations
86,376Law enforcement workers including supervisors
75,233Computer and mathematical occupations
Companies with federal contracts located in this zip code:
ACCESS REPORTS INC (1624 DOGWOOD LN in LYNCHBURG, VA; small business) : $5,750 in 2 contractsin 2005
$2,875 with Air Force for Newspapers and Periodicals. Signed on 2005-11-09. Completion date: 2006-12-31.
$2,875 with Air Force for Books and Pamphlets. Signed on 2005-01-01. Completion date: 2005-01-01.
Top industries in this zip code by the number of employees in 2005:
Health Care and Social Assistance: General Medical and Surgical Hospitals (over 1000 employees: 1 establishment)
Health Care and Social Assistance: Continuing Care Retirement Communities (250-499: 1, 20-49: 1)
Educational Services: Colleges, Universities, and Professional Schools (250-499: 1)
Other Services (except Public Administration): Religious Organizations (50-99: 2, 20-49: 3, 10-19: 3, 5-9: 4, 1-4: 8)
Educational Services: Elementary and Secondary Schools (100-249: 1, 50-99: 1)
2002 - 2018 National Fire Incident Reporting System (NFIRS) incidents
Based on the data from the years 2002 - 2018 the average number of fires per year is 44. The highest number of reported fires - 69 took place in 2007, and the least - 25 in 2018. The data has a declining trend.
When looking into fire subcategories, the most reports belonged to: Outside Fires (42.9%), and Structure Fires (39.1%).
Fire incident types reported to NFIRS in Zip Code 24503


 Nearest zip codes: 24536, 24502, 24574, 24551, 24501, 24572.


 Based on the data from the years 2002 - 2018 the average number of fires per year is 44. The highest number of reported fires - 69 took place in 2007, and the least - 25 in 2018. The data has a declining trend.
 When looking into fire subcategories, the most reports belonged to: Outside Fires (42.9%), and Structure Fires (39.1%).