Estimated zip code population in 2022: 5,493 Zip code population in 2010: 5,953 Zip code population in 2000: 7,073
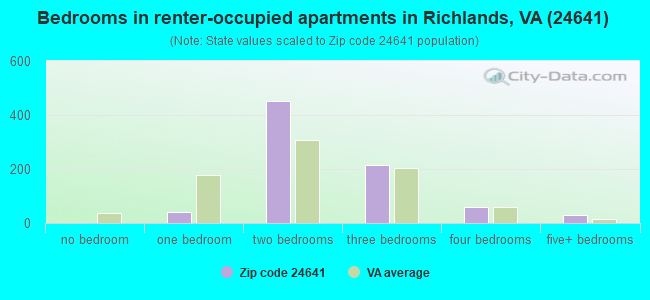
Houses and condos: 2,969 Renter-occupied apartments: 805
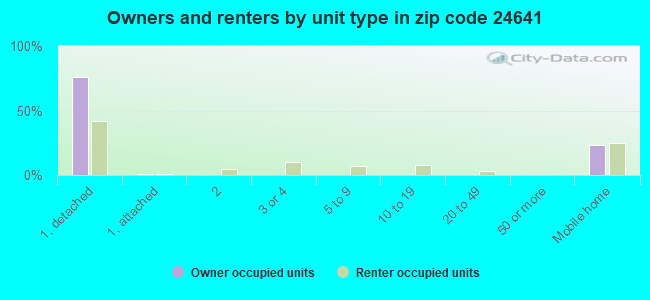
% of renters here:
33%
State:
33%
March 2022 cost of living index in zip code 24641: 77.6 (low, U.S. average is 100)
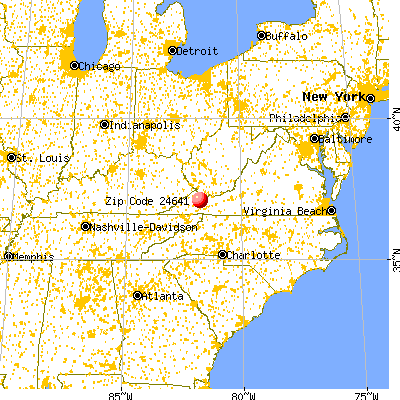
Land area: 19.1 sq. mi. Water area: 0.1 sq. mi.
Population density: 288 people per square mile
(very low).
OSM Map
General Map
Google Map
MSN Map
OSM Map
General Map
Google Map
MSN Map
OSM Map
General Map
Google Map
MSN Map
OSM Map
General Map
Google Map
MSN Map
Please wait while loading the map...
Real estate property taxes paid for housing units in 2022:
This zip code:
0.7% ($762)
Virginia:
0.7% ($2,617)
Median real estate property taxes paid for housing units with mortgages in 2022: $917 (0.6%) Median real estate property taxes paid for housing units with no mortgage in 2022: $727 (0.7%)
Averages for the 2020 tax year for zip code 24641, filed in 2021:
Average Adjusted Gross Income (AGI) in 2020: $47,822 (Individual Income Tax Returns)
Here:
$47,822
State:
$86,446
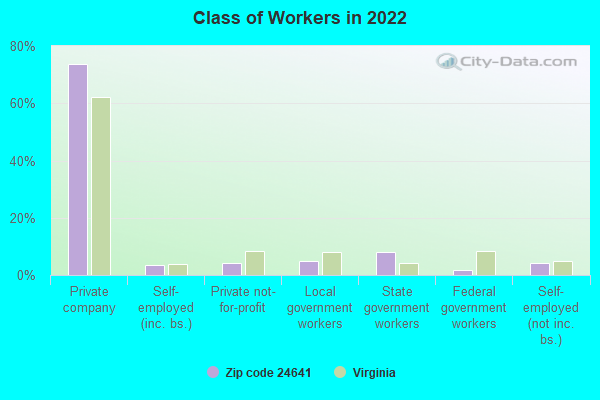
Salary/wage: $41,079 (reported on 81.9% of returns)
Here:
$41,079
State:
$71,185
(% of AGI for various income ranges: 1032.3% for AGIs below $25k, 3440.2% for AGIs $25k-50k, 6480.0% for AGIs $50k-75k, 8290.0% for AGIs $75k-100k, 14770.0% for AGIs $100k-200k)
Taxable interest for individuals: $1,116 (reported on 22.1% of returns)
This zip code:
$1,116
Virginia:
$1,805
(% of AGI for various income ranges: 12.1% for AGIs below $25k, 15.9% for AGIs $25k-50k, 76.5% for AGIs $50k-75k, 16.0% for AGIs $75k-100k, 86.4% for AGIs $100k-200k)
Ordinary dividends: $6,526 (reported on 9.3% of returns)
Here:
$6,526
State:
$8,327
(% of AGI for various income ranges: 15.3% for AGIs below $25k, 22.5% for AGIs $25k-50k, 72.5% for AGIs $50k-75k, 69.0% for AGIs $75k-100k, 121.8% for AGIs $100k-200k)
Net capital gain/loss in AGI: +$10,565 (reported on 8.3% of returns)
Here:
+$10,565
State:
+$24,644
(% of AGI for various income ranges: 7.3% for AGIs $25k-50k, 47.0% for AGIs $50k-75k, 9.0% for AGIs $75k-100k, 370.9% for AGIs $100k-200k)
Profit/loss from business: +$9,584 (reported on 12.3% of returns)
Here:
+$9,584
State:
+$12,836
(% of AGI for various income ranges: 77.9% for AGIs below $25k, 85.5% for AGIs $25k-50k, 76.5% for AGIs $50k-75k, 487.0% for AGIs $75k-100k, 759.1% for AGIs $100k-200k)
Taxable individual retirement arrangement distribution: $14,840 (reported on 7.4% of returns)
24641:
$14,840
Virginia:
$21,535
(% of AGI for various income ranges: 32.1% for AGIs below $25k, 74.5% for AGIs $25k-50k, 305.5% for AGIs $50k-75k, 965.5% for AGIs $100k-200k)
Total itemized deductions: $36,480 (reported on 2.5% of returns)
Here:
$36,480
State:
$33,287
(% of AGI for various income ranges: 127.7% for AGIs $25k-50k, 1147.3% for AGIs $100k-200k)
Charity contributions: $12,620 (reported on 2.5% of returns)
Here:
$12,620
State:
$10,381
(% of AGI for various income ranges: 573.6% for AGIs $100k-200k)
Taxes paid: $7,520 (reported on 2.5% of returns)
24641:
$7,520
State:
$8,284
(% of AGI for various income ranges: 15.7% for AGIs $25k-50k, 279.1% for AGIs $100k-200k)
Earned income credit: $2,282 (reported on 24.0% of returns)
Here:
$2,282
State:
$2,214
(% of AGI for various income ranges: 108.0% for AGIs below $25k, 82.3% for AGIs $25k-50k)
Percentage of individuals using paid preparers for their 2020 taxes: 95.1%
Here:
95%
State:
92%
(% for various income ranges: 97.6% for AGIs below $25k, 96.3% for AGIs $25k-50k, 92.9% for AGIs $50k-75k, 92.9% for AGIs $75k-100k, 88.9% for AGIs $100k-200k, 80.0% for AGIs over 200k)
Averages for the 2012 tax year for zip code 24641, filed in 2013:
Average Adjusted Gross Income (AGI) in 2012: $47,923 (Individual Income Tax Returns)
Here:
$47,923
State:
$71,192
Salary/wage: $41,269 (reported on 86.2% of returns)
Here:
$41,269
State:
$59,229
(% of AGI for various income ranges: 75.6% for AGIs below $25k, 79.1% for AGIs $25k-50k, 82.5% for AGIs $50k-75k, 78.5% for AGIs $75k-100k, 75.8% for AGIs $100k-200k, 55.0% for AGIs over 200k)
Taxable interest for individuals: $1,833 (reported on 28.0% of returns)
This zip code:
$1,833
Virginia:
$1,600
(% of AGI for various income ranges: 1.7% for AGIs below $25k, 0.9% for AGIs $25k-50k, 0.6% for AGIs $50k-75k, 0.6% for AGIs $75k-100k, 0.5% for AGIs $100k-200k, 2.5% for AGIs over 200k)
Ordinary dividends: $5,279 (reported on 12.8% of returns)
Here:
$5,279
State:
$6,959
(% of AGI for various income ranges: 1.6% for AGIs below $25k, 1.0% for AGIs $25k-50k, 0.5% for AGIs $50k-75k, 0.8% for AGIs $75k-100k, 1.2% for AGIs $100k-200k, 3.3% for AGIs over 200k)
Net capital gain/loss in AGI: +$5,381 (reported on 9.6% of returns)
Here:
+$5,381
State:
+$16,672
(% of AGI for various income ranges: 0.7% for AGIs $50k-75k, 1.8% for AGIs $100k-200k, 3.5% for AGIs over 200k)
Profit/loss from business: +$10,504 (reported on 12.4% of returns)
Here:
+$10,504
State:
+$14,116
(% of AGI for various income ranges: 5.8% for AGIs below $25k, 2.1% for AGIs $25k-50k, 1.3% for AGIs $50k-75k, 2.6% for AGIs $75k-100k, 4.8% for AGIs $100k-200k)
Taxable individual retirement arrangement distribution: $13,295 (reported on 9.6% of returns)
24641:
$13,295
Virginia:
$16,667
(% of AGI for various income ranges: 2.4% for AGIs below $25k, 3.0% for AGIs $25k-50k, 1.8% for AGIs $50k-75k, 1.8% for AGIs $75k-100k, 5.8% for AGIs $100k-200k)
Total itemized deductions: $22,065 (17% of AGI, reported on 17.0% of returns)
Here:
$22,065
State:
$26,596
Here:
17.4% of AGI
State:
20.1% of AGI
(% of AGI for various income ranges: 3.2% for AGIs below $25k, 3.4% for AGIs $25k-50k, 4.6% for AGIs $50k-75k, 9.4% for AGIs $75k-100k, 11.4% for AGIs $100k-200k, 12.7% for AGIs over 200k)
Charity contributions: $6,372 (reported on 13.3% of returns)
Here:
$6,372
State:
$4,443
(% of AGI for various income ranges: 0.7% for AGIs $25k-50k, 1.0% for AGIs $50k-75k, 2.1% for AGIs $75k-100k, 2.3% for AGIs $100k-200k, 3.8% for AGIs over 200k)
Taxes paid: $7,805 (reported on 17.0% of returns)
24641:
$7,805
State:
$9,951
(% of AGI for various income ranges: 0.4% for AGIs below $25k, 0.6% for AGIs $25k-50k, 1.2% for AGIs $50k-75k, 2.6% for AGIs $75k-100k, 4.8% for AGIs $100k-200k, 5.6% for AGIs over 200k)
Earned income credit: $2,064 (reported on 24.3% of returns)
Here:
$2,064
State:
$2,211
(% of AGI for various income ranges: 7.3% for AGIs below $25k, 1.2% for AGIs $25k-50k)
Percentage of individuals using paid preparers for their 2012 taxes: 60.6%
Here:
61%
State:
46%
(% for various income ranges: 56.1% for AGIs below $25k, 55.8% for AGIs $25k-50k, 60.7% for AGIs $50k-75k, 70.6% for AGIs $75k-100k, 77.8% for AGIs $100k-200k, 100.0% for AGIs over 200k)
Averages for the 2004 tax year for zip code 24641, filed in 2005:
Average Adjusted Gross Income (AGI) in 2004: $40,264 (Individual Income Tax Returns)
Here:
$40,264
State:
$56,704
Salary/wage: $35,346 (reported on 83.8% of returns)
Here:
$35,346
State:
$48,441
(% of AGI for various income ranges: 103.0% for AGIs below $10k, 75.9% for AGIs $10k-25k, 84.1% for AGIs $25k-50k, 86.6% for AGIs $50k-75k, 81.0% for AGIs $75k-100k, 54.9% for AGIs over 100k)
Taxable interest for individuals: $2,617 (reported on 39.1% of returns)
This zip code:
$2,617
Virginia:
$1,688
(% of AGI for various income ranges: 7.5% for AGIs below $10k, 4.3% for AGIs $10k-25k, 1.4% for AGIs $25k-50k, 1.1% for AGIs $50k-75k, 1.8% for AGIs $75k-100k, 3.4% for AGIs over 100k)
Taxable dividends: $4,067 (reported on 20.3% of returns)
Here:
$4,067
State:
$4,028
(% of AGI for various income ranges: 8.1% for AGIs below $10k, 1.3% for AGIs $10k-25k, 1.1% for AGIs $25k-50k, 0.3% for AGIs $50k-75k, 1.3% for AGIs $75k-100k, 3.7% for AGIs over 100k)
Net capital gain/loss: +$5,700 (reported on 14.4% of returns)
Here:
+$5,700
State:
+$14,375
(% of AGI for various income ranges: -3.9% for AGIs below $10k, -0.4% for AGIs $10k-25k, -0.1% for AGIs $25k-50k, 0.3% for AGIs $50k-75k, 0.7% for AGIs $75k-100k, 5.9% for AGIs over 100k)
Profit/loss from business: +$12,331 (reported on 13.4% of returns)
Here:
+$12,331
State:
+$13,342
(% of AGI for various income ranges: 5.2% for AGIs below $10k, 5.6% for AGIs $10k-25k, 2.0% for AGIs $25k-50k, 2.0% for AGIs $50k-75k, -0.4% for AGIs $75k-100k, 7.6% for AGIs over 100k)
IRA payment deduction: $3,450 (reported on 1.9% of returns)
24641:
$3,450
Virginia:
$2,943
Total itemized deductions: $19,303 (18% of AGI, reported on 17.3% of returns)
Here:
$19,303
State:
$21,492
Here:
18.0% of AGI
State:
21.0% of AGI
(% of AGI for various income ranges: 5.6% for AGIs $10k-25k, 4.7% for AGIs $25k-50k, 6.7% for AGIs $50k-75k, 10.5% for AGIs $75k-100k, 11.9% for AGIs over 100k)
Charity contributions deductions: $5,341 (5% of AGI, reported on 15.0% of returns)
Here:
$5,341
State:
$3,794
Here:
4.7% of AGI
State:
3.5% of AGI
(% of AGI for various income ranges: 0.6% for AGIs $10k-25k, 1.1% for AGIs $25k-50k, 1.5% for AGIs $50k-75k, 2.5% for AGIs $75k-100k, 3.2% for AGIs over 100k)
Total tax: $7,018 (reported on 69.4% of returns)
24641:
$7,018
State:
$9,537
(% of AGI for various income ranges: 3.5% for AGIs below $10k, 3.5% for AGIs $10k-25k, 6.3% for AGIs $25k-50k, 8.9% for AGIs $50k-75k, 11.6% for AGIs $75k-100k, 20.8% for AGIs over 100k)
Earned income credit: $1,544 (reported on 19.6% of returns)
Here:
$1,544
State:
$1,734
Percentage of individuals using paid preparers for their 2004 taxes: 63.9%
Here:
64%
State:
52%
(% for various income ranges: 58.6% for AGIs below $10k, 64.8% for AGIs $10k-25k, 60.7% for AGIs $25k-50k, 64.7% for AGIs $50k-75k, 78.1% for AGIs $75k-100k, 78.9% for AGIs over 100k)
Household received Food Stamps/SNAP in the past 12 months: 513 Household did not receive Food Stamps/SNAP in the past 12 months: 1,937
Women who had a birth in the past 12 months: 66 (66 now married, 0 unmarried) Women who did not have a birth in the past 12 months: 1,126 (513 now married, 611 unmarried)
Housing units in zip code 24641 with a mortgage: 627 (19 second mortgage, 19 both second mortgage and home equity loan) Houses without a mortgage: 92
Median monthly owner costs for units with a mortgage: $1,092 Median monthly owner costs for units without a mortgage: $424
Residents with income below the poverty level in 2022:
This zip code:
25.3%
Whole state:
10.6%
Residents with income below 50% of the poverty level in 2022:
This zip code:
17.0%
Whole state:
5.2%
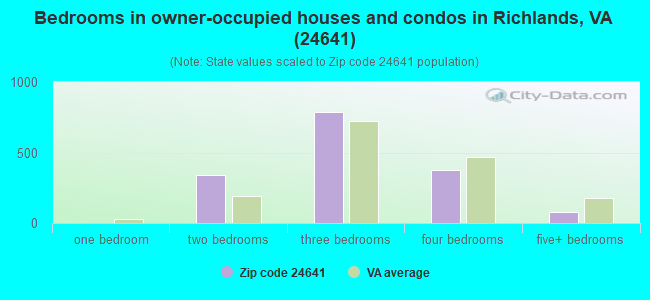
Median number of rooms in houses and condos:
Here:
6.2
State:
7.0
Median number of rooms in apartments:
Here:
4.6
State:
4.3
Notable locations in this zip code not listed on our city pages
Churches in zip code 24641 include: Hill Creek Church (A), Little Star Church (B), Apostolic Church of Jesus Christ (C), First Assembly of God Church (D), First Baptist Church (E), First United Methodist Church (F), Laymen Chapel Methodist Protestant Church (G), New Light Holiness Church (H), Pentecostal Holiness Church (I). Display/hide their locations on the map
In group quarters: 34 (-1 institutionalized population)
Size of family households: 716 2-persons, 428 3-persons, 226 4-persons, 39 5-persons, 34 6-persons
Size of nonfamily households: 844 1-person, 90 2-persons, 27 3-persons
615 married couples with children.
234 single-parent households (61 men, 173 women).
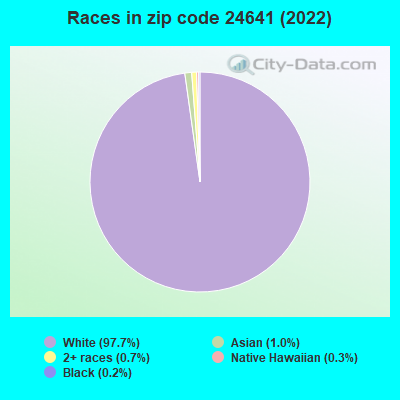
98.4% of residents of 24641 zip code speak English at home.
0.7% of residents speak other Indo-European language at home (100% very well).
0.3% of residents speak Asian or Pacific Island language at home (100% very well).
0.7% of residents speak other language at home (58% very well, 42% well).
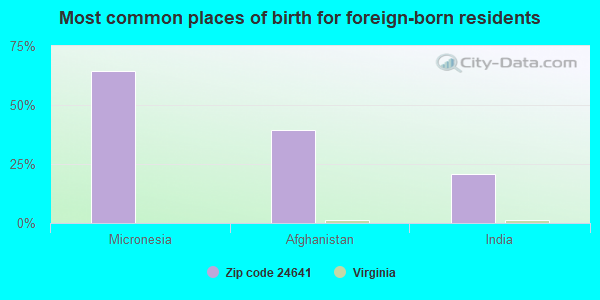
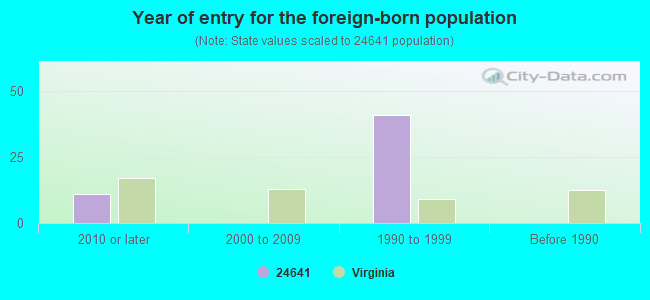
Foreign born population: 49 (0.9%) (80.9% of them are naturalized citizens)
This zip code:
0.9%
Whole state:
12.7%
65%Micronesia
40%Afghanistan
21%India
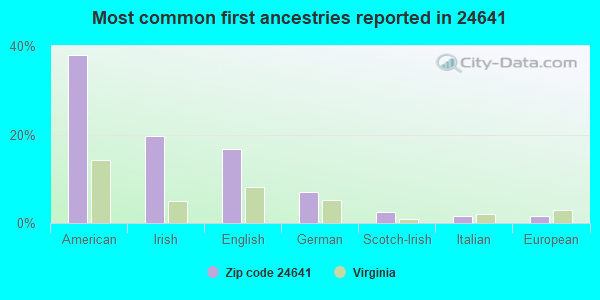
38%American
20%Irish
17%English
7%German
2%Scotch-Irish
2%Italian
2%European
Year of entry for the foreign-born population
112010 or later
02000 to 2009
411990 to 1999
0Before 1990
Facilities with environmental interests located in this zip code:
CLINCH VALLEY MILLWORKS, LLC (1515 2ND STREET in RICHLANDS, VA)
AIR MINOR (AIRS/AFS) STATE MASTER (Virginia pollutants databases) - CEDS-11403, AIR PROGRAM Business SIC and NAICS classification: WOODWORKING MACHINERY
Housing units lacking complete plumbing facilities: 6.6% Housing units lacking complete kitchen facilities: 9.1%
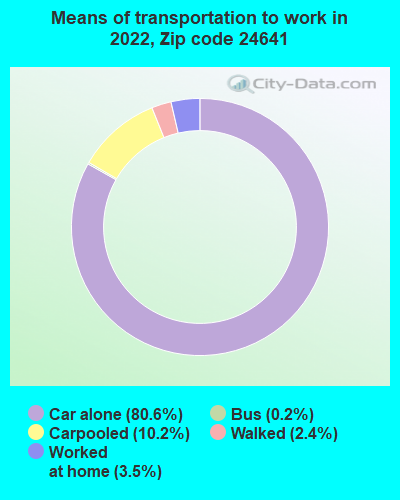
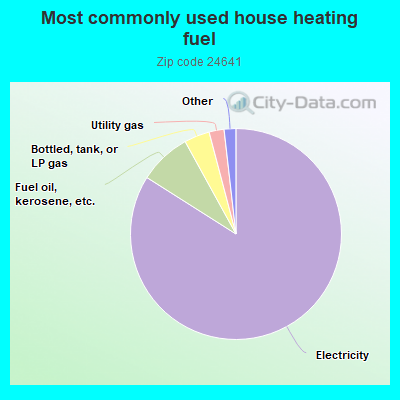
84.0%Electricity
8.0%Fuel oil, kerosene, etc.
3.9%Bottled, tank, or LP gas
2.3%Utility gas
0.9%Other fuel
0.6%No fuel used
Population in 1990: 8,026.
Place of birth for U.S.-born residents:
This state: 4,379
Northeast: 14
Midwest: 192
South: 741
West: 71
62% of the 24641 zip code residents lived in the same house 5 years ago. Out of people who lived in different houses, 66% lived in this county. Out of people who lived in different counties, 50% lived in Virginia.
97% of the 24641 zip code residents lived in the same house 1 year ago. Out of people who lived in different houses, 82% moved from this county. Out of people who lived in different houses, 19% moved from different county within same state. Out of people who lived in different houses, 4% moved from different state. Out of people who lived in different houses, 3% moved from abroad.
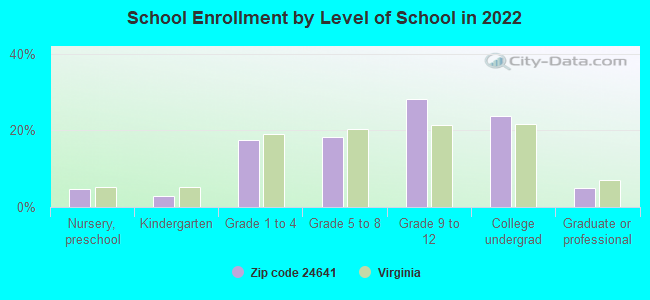
Private vs. public school enrollment:
Students in private schools in grades 1 to 8 (elementary and middle school): 21
Here:
6.7%
Virginia:
13.2%
Students in private schools in grades 9 to 12 (high school): 12
Here:
5.1%
Virginia:
10.2%
Students in private undergraduate colleges: 2
Here:
1.2%
Virginia:
18.7%
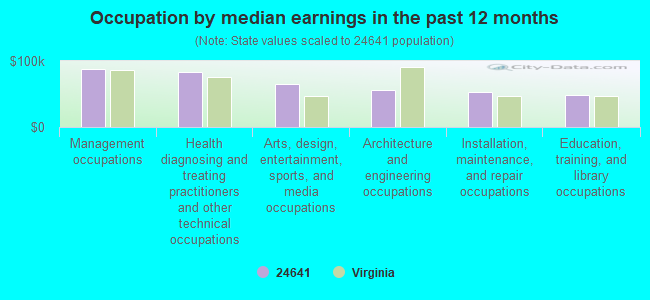
Occupation by median earnings in the past 12 months ($)
88,446Management occupations
82,997Health diagnosing and treating practitioners and other technical occupations
65,158Arts, design, entertainment, sports, and media occupations
55,312Architecture and engineering occupations
53,069Installation, maintenance, and repair occupations
48,397Education, training, and library occupations
Companies with federal contracts located in this zip code:
SPANDECK INC (2680 SOUTH FRONT STREET in RICHLANDS, TN; small business) : $1,122,003 in 10 contractsfrom 1999 to 2004
Contracts for Cranes and Crane-Shovels, Winches, Hoists, Cranes, and Derricks, Maintenance, Repair or Alteration of Real Property -- Restoration of real property, Valves, Powered by Defense Logistics Agency, U.S. Army Corps of Engineers - civil program financing only, Tennessee Valley Authority, Army, and others Signed by year:2000: $689,593; 2001: $0; 2002: $0; 2003: $0; 2004: $405,410; 2005: $0; 2006: $0.
Biggest contracts:
$399,594 with Defense Logistics Agency for Cranes and Crane-Shovels. Taking place in TN. Signed on 2004-01-01. Completion date: 2004-01-06.
$317,646 with U.S. Army Corps of Engineers - civil program financing only for Winches, Hoists, Cranes, and Derricks. Taking place in TN. Signed on 2000-11-22. Completion date: 2001-11-22.
$300,000, same as above.Signed on 2000-06-06. Completion date: 2001-06-06.
$45,947 with U.S. Army Corps of Engineers - civil program financing only for Maintenance, Repair or Alteration of Real Property -- Restoration of real property. Taking place in PA. Signed on 2000-08-09. Completion date: 2000-10-10.
Top industries in this zip code by the number of employees in 2005:
Health Care and Social Assistance: General Medical and Surgical Hospitals (500-999 employees: 1 establishment)
Health Care and Social Assistance: Offices of Physicians (except Mental Health Specialists) (100-249: 1, 20-49: 2, 10-19: 1, 5-9: 2, 1-4: 17)
Health Care and Social Assistance: Home Health Care Services (100-249: 1, 20-49: 1, 10-19: 1, 5-9: 2)
Real Estate and Rental and Leasing: Lessors of Nonresidential Buildings (except Miniwarehouses) (20-49: 1, 5-9: 2, 1-4: 3)
People in group quarters in 2010:
9 people in emergency and transitional shelters (with sleeping facilities) for people experiencing homelessness
5 people in nursing facilities/skilled-nursing facilities
Fatal accident statistics in 2010:
Fatal accident count: 1
Vehicles involved in fatal accidents: 1
Fatal accidents caused by drunken drivers: 0
Fatalities: 1
Persons involved in fatal accidents: 1
Pedestrians involved in fatal accidents: 0
2002 - 2018 National Fire Incident Reporting System (NFIRS) incidents
According to the data from the years 2002 - 2018 the average number of fire incidents per year is 17. The highest number of reported fires - 28 took place in 2005, and the least - 7 in 2018. The data has a dropping trend.
When looking into fire subcategories, the most incidents belonged to: Structure Fires (55.7%), and Outside Fires (30.5%).
Fire incident types reported to NFIRS in Zip Code 24641


 Nearest zip codes: 24612, 24639, 24637, 24609, 24622, 24649.


 According to the data from the years 2002 - 2018 the average number of fire incidents per year is 17. The highest number of reported fires - 28 took place in 2005, and the least - 7 in 2018. The data has a dropping trend.
 When looking into fire subcategories, the most incidents belonged to: Structure Fires (55.7%), and Outside Fires (30.5%).