Estimated zip code population in 2022: 3,437 Zip code population in 2010: 4,691 Zip code population in 2000: 5,145
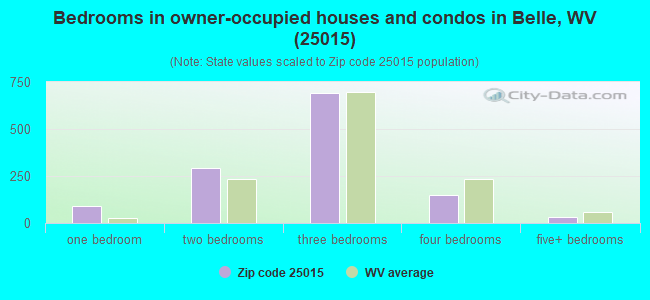
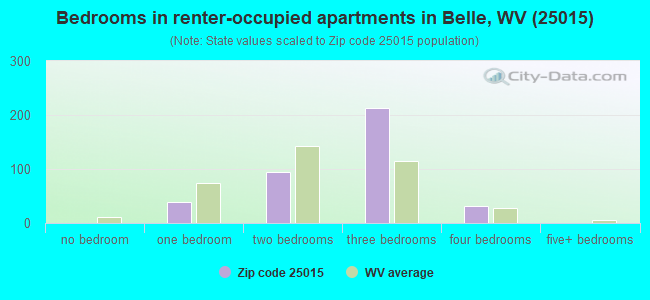
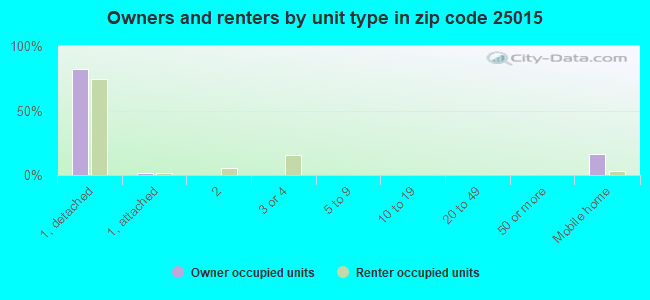
Houses and condos: 1,976 Renter-occupied apartments: 364
% of renters here:
22%
State:
26%
March 2022 cost of living index in zip code 25015: 85.1 (less than average, U.S. average is 100)
Land area: 25.7 sq. mi. Water area: 0.9 sq. mi.
Population density: 134 people per square mile
(very low).
OSM Map
General Map
Google Map
MSN Map
OSM Map
General Map
Google Map
MSN Map
OSM Map
General Map
Google Map
MSN Map
OSM Map
General Map
Google Map
MSN Map
Please wait while loading the map...
Real estate property taxes paid for housing units in 2022:
This zip code:
0.6% ($665)
West Virginia:
0.5% ($821)
Median real estate property taxes paid for housing units with mortgages in 2022: $819 (0.7%) Median real estate property taxes paid for housing units with no mortgage in 2022: $534 (0.5%)
Business Search- 14 Million verified businesses
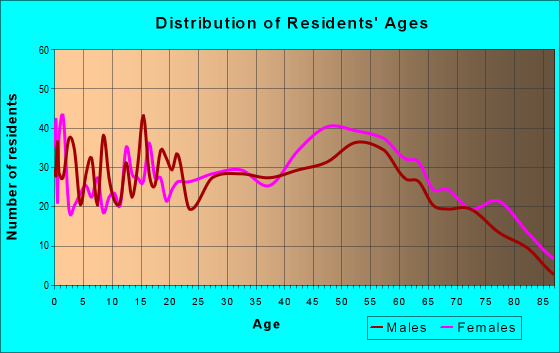
Males: 1,777
(51.7%)
Females: 1,659
(48.3%)
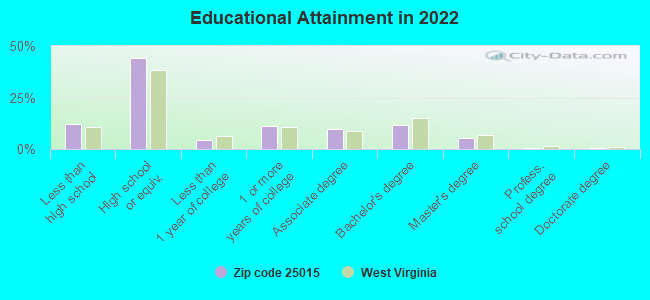
For population 25 years and over in 25015:
High school or higher: 86.5%
Bachelor's degree or higher: 17.6%
Graduate or professional degree: 6.3%
Unemployed: 5.5%
Mean travel time to work (commute): 25.6 minutes
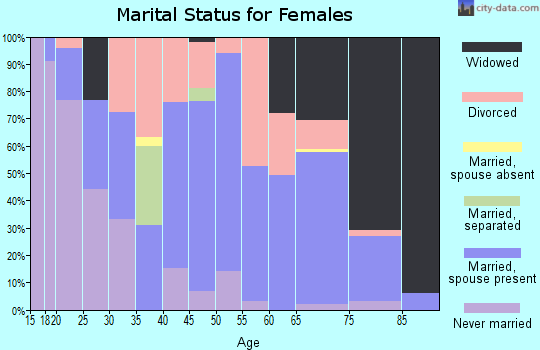
For population 15 years and over in 25015:
Never married: 29.6%
Now married: 49.3%
Separated: 1.4%
Widowed: 6.4%
Divorced: 13.3%
Zip code 25015 compared to state average:
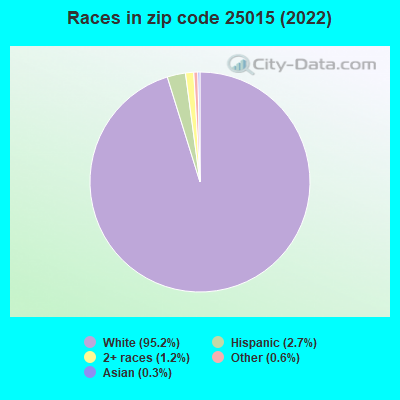
Black race population percentage significantly below state average.
Median age above state average.
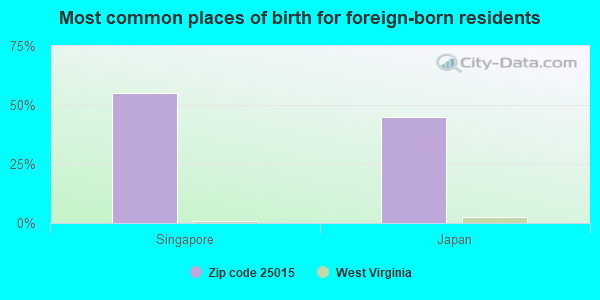
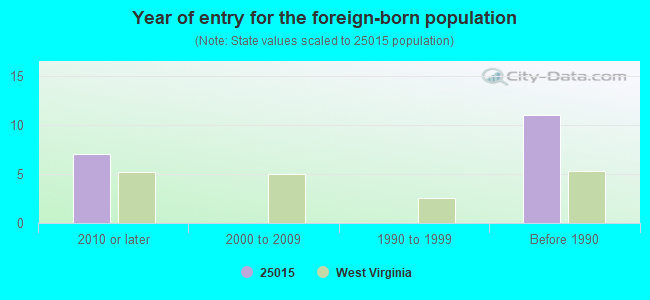
Foreign-born population percentage significantly below state average.
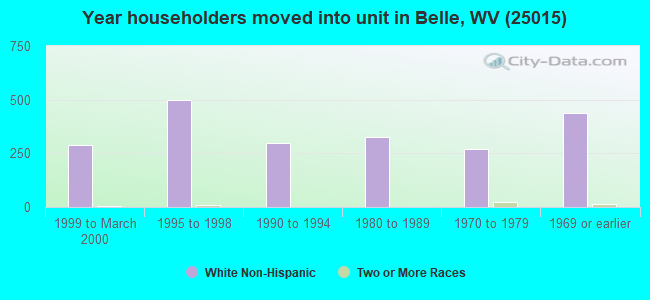
Length of stay since moving in significantly above state average.
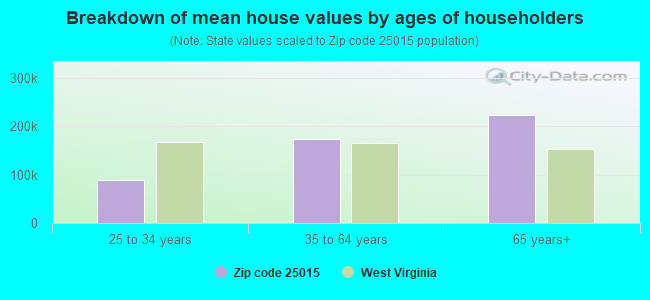
Estimated median house/condo value in 2022: $113,612
25015:
$113,612
West Virginia:
$155,100
According to our research of West Virginia and other state lists, there were 14 registered sex offenders living in 25015 zip code as of April 26, 2024. The ratio of all residents to sex offenders in zip code 25015 is 326 to 1. The ratio of registered sex offenders to all residents in this zip code is near the state average.
Median resident age:
This zip code:
47.9 years
West Virginia median age:
42.9 years
Average household size:
This zip code:
2.1 people
West Virginia:
2.3 people
Averages for the 2020 tax year for zip code 25015, filed in 2021:
Average Adjusted Gross Income (AGI) in 2020: $47,856 (Individual Income Tax Returns)
Here:
$47,856
State:
$56,292
Salary/wage: $42,801 (reported on 80.8% of returns)
Here:
$42,801
State:
$49,093
(% of AGI for various income ranges: 1004.9% for AGIs below $25k, 3094.2% for AGIs $25k-50k, 5628.1% for AGIs $50k-75k, 7501.7% for AGIs $75k-100k, 16761.4% for AGIs $100k-200k)
Taxable interest for individuals: $482 (reported on 18.7% of returns)
This zip code:
$482
West Virginia:
$1,141
(% of AGI for various income ranges: 3.8% for AGIs below $25k, 11.2% for AGIs $25k-50k, 20.5% for AGIs $50k-75k, 20.8% for AGIs $75k-100k, 20.0% for AGIs $100k-200k)
Ordinary dividends: $1,833 (reported on 8.2% of returns)
Here:
$1,833
State:
$5,456
(% of AGI for various income ranges: 4.7% for AGIs below $25k, 9.8% for AGIs $25k-50k, 26.7% for AGIs $50k-75k, 55.8% for AGIs $75k-100k, 60.7% for AGIs $100k-200k)
Net capital gain/loss in AGI: +$2,050 (reported on 5.5% of returns)
Here:
+$2,050
State:
+$11,656
(% of AGI for various income ranges: 7.2% for AGIs $25k-50k, 20.0% for AGIs $50k-75k, 102.9% for AGIs $100k-200k)
Profit/loss from business: +$5,883 (reported on 6.6% of returns)
Here:
+$5,883
State:
+$12,084
(% of AGI for various income ranges: 32.3% for AGIs below $25k, 2.1% for AGIs $25k-50k, 105.7% for AGIs $50k-75k, 217.1% for AGIs $100k-200k)
Taxable individual retirement arrangement distribution: $15,582 (reported on 9.3% of returns)
25015:
$15,582
West Virginia:
$15,311
(% of AGI for various income ranges: 46.6% for AGIs below $25k, 104.0% for AGIs $25k-50k, 254.3% for AGIs $50k-75k, 332.5% for AGIs $75k-100k, 730.0% for AGIs $100k-200k)
Total itemized deductions: $28,550 (reported on 1.1% of returns)
Here:
$28,550
State:
$31,950
(% of AGI for various income ranges: 271.9% for AGIs $50k-75k)
Charity contributions: $9,850 (reported on 1.1% of returns)
Here:
$9,850
State:
$12,364
(% of AGI for various income ranges: 45.8% for AGIs $25k-50k)
Taxes paid: $5,567 (reported on 1.6% of returns)
25015:
$5,567
State:
$7,665
(% of AGI for various income ranges: 79.5% for AGIs $50k-75k)
Earned income credit: $2,303 (reported on 18.1% of returns)
Here:
$2,303
State:
$2,258
(% of AGI for various income ranges: 83.8% for AGIs below $25k, 73.5% for AGIs $25k-50k)
Percentage of individuals using paid preparers for their 2020 taxes: 91.8%
Here:
92%
State:
93%
(% for various income ranges: 92.4% for AGIs below $25k, 94.1% for AGIs $25k-50k, 85.7% for AGIs $50k-75k, 93.3% for AGIs $75k-100k, 90.9% for AGIs $100k-200k)
Averages for the 2012 tax year for zip code 25015, filed in 2013:
Average Adjusted Gross Income (AGI) in 2012: $44,839 (Individual Income Tax Returns)
Here:
$44,839
State:
$48,628
Salary/wage: $40,753 (reported on 85.0% of returns)
Here:
$40,753
State:
$42,328
(% of AGI for various income ranges: 68.5% for AGIs below $25k, 79.7% for AGIs $25k-50k, 75.6% for AGIs $50k-75k, 79.6% for AGIs $75k-100k, 79.1% for AGIs $100k-200k)
Taxable interest for individuals: $913 (reported on 25.1% of returns)
This zip code:
$913
West Virginia:
$1,211
(% of AGI for various income ranges: 1.0% for AGIs below $25k, 0.8% for AGIs $25k-50k, 0.6% for AGIs $50k-75k, 0.4% for AGIs $100k-200k)
Ordinary dividends: $2,074 (reported on 10.2% of returns)
Here:
$2,074
State:
$4,262
(% of AGI for various income ranges: 0.5% for AGIs below $25k, 0.4% for AGIs $25k-50k, 1.0% for AGIs $100k-200k)
Net capital gain/loss in AGI: +$855 (reported on 5.9% of returns)
Here:
+$855
State:
+$8,875
(% of AGI for various income ranges: 0.2% for AGIs $50k-75k, 0.3% for AGIs $100k-200k)
Profit/loss from business: +$5,721 (reported on 7.5% of returns)
Here:
+$5,721
State:
+$13,636
(% of AGI for various income ranges: 4.3% for AGIs below $25k, 0.8% for AGIs $25k-50k, 0.8% for AGIs $50k-75k, 0.7% for AGIs $75k-100k)
Taxable individual retirement arrangement distribution: $11,644 (reported on 9.6% of returns)
25015:
$11,644
West Virginia:
$11,787
(% of AGI for various income ranges: 3.0% for AGIs below $25k, 1.3% for AGIs $25k-50k, 3.1% for AGIs $50k-75k, 3.4% for AGIs $75k-100k, 2.1% for AGIs $100k-200k)
Total itemized deductions: $16,815 (17% of AGI, reported on 14.4% of returns)
Here:
$16,815
State:
$21,148
Here:
17.5% of AGI
State:
18.1% of AGI
(% of AGI for various income ranges: 4.7% for AGIs $25k-50k, 3.8% for AGIs $50k-75k, 5.9% for AGIs $75k-100k, 8.9% for AGIs $100k-200k)
Charity contributions: $3,922 (reported on 9.6% of returns)
Here:
$3,922
State:
$4,508
(% of AGI for various income ranges: 0.7% for AGIs $25k-50k, 0.7% for AGIs $50k-75k, 0.7% for AGIs $75k-100k, 1.5% for AGIs $100k-200k)
Taxes paid: $6,389 (reported on 14.4% of returns)
25015:
$6,389
State:
$8,103
(% of AGI for various income ranges: 0.8% for AGIs $25k-50k, 1.0% for AGIs $50k-75k, 2.1% for AGIs $75k-100k, 4.5% for AGIs $100k-200k)
Earned income credit: $2,105 (reported on 20.9% of returns)
Here:
$2,105
State:
$2,140
(% of AGI for various income ranges: 6.5% for AGIs below $25k, 1.1% for AGIs $25k-50k)
Percentage of individuals using paid preparers for their 2012 taxes: 43.9%
Here:
44%
State:
49%
(% for various income ranges: 38.5% for AGIs below $25k, 42.2% for AGIs $25k-50k, 46.7% for AGIs $50k-75k, 52.9% for AGIs $75k-100k, 58.8% for AGIs $100k-200k)
Averages for the 2004 tax year for zip code 25015, filed in 2005:
Average Adjusted Gross Income (AGI) in 2004: $34,375 (Individual Income Tax Returns)
Here:
$34,375
State:
$37,498
Salary/wage: $33,366 (reported on 83.8% of returns)
Here:
$33,366
State:
$33,645
(% of AGI for various income ranges: 89.4% for AGIs below $10k, 70.9% for AGIs $10k-25k, 82.5% for AGIs $25k-50k, 81.5% for AGIs $50k-75k, 85.3% for AGIs $75k-100k, 83.8% for AGIs over 100k)
Taxable interest for individuals: $1,354 (reported on 35.8% of returns)
This zip code:
$1,354
West Virginia:
$1,465
(% of AGI for various income ranges: 2.3% for AGIs below $10k, 2.5% for AGIs $10k-25k, 1.7% for AGIs $25k-50k, 1.3% for AGIs $50k-75k, 0.9% for AGIs $75k-100k, 0.3% for AGIs over 100k)
Taxable dividends: $1,140 (reported on 14.9% of returns)
Here:
$1,140
State:
$2,913
(% of AGI for various income ranges: 0.8% for AGIs below $10k, 0.7% for AGIs $10k-25k, 0.3% for AGIs $25k-50k, 0.6% for AGIs $50k-75k, 0.6% for AGIs $75k-100k, 0.2% for AGIs over 100k)
Net capital gain/loss: +$852 (reported on 7.4% of returns)
Here:
+$852
State:
+$6,331
(% of AGI for various income ranges: 0.4% for AGIs below $10k, -0.3% for AGIs $10k-25k, 0.1% for AGIs $25k-50k, 0.4% for AGIs $50k-75k, 0.4% for AGIs $75k-100k, 0.2% for AGIs over 100k)
Profit/loss from business: +$5,646 (reported on 8.3% of returns)
Here:
+$5,646
State:
+$11,074
(% of AGI for various income ranges: 2.5% for AGIs below $10k, 2.2% for AGIs $10k-25k, 1.4% for AGIs $25k-50k, 0.9% for AGIs $50k-75k, 0.9% for AGIs $75k-100k, 1.5% for AGIs over 100k)
IRA payment deduction: $2,538 (reported on 1.4% of returns)
25015:
$2,538
West Virginia:
$2,796
Total itemized deductions: $14,102 (19% of AGI, reported on 12.8% of returns)
Here:
$14,102
State:
$16,976
Here:
19.1% of AGI
State:
19.0% of AGI
(% of AGI for various income ranges: 3.0% for AGIs $10k-25k, 3.1% for AGIs $25k-50k, 5.9% for AGIs $50k-75k, 8.0% for AGIs $75k-100k, 8.5% for AGIs over 100k)
Charity contributions deductions: $2,942 (4% of AGI, reported on 9.9% of returns)
Here:
$2,942
State:
$3,529
Here:
3.8% of AGI
State:
3.7% of AGI
(% of AGI for various income ranges: 0.6% for AGIs $10k-25k, 0.3% for AGIs $25k-50k, 1.2% for AGIs $50k-75k, 1.4% for AGIs $75k-100k, 1.2% for AGIs over 100k)
Total tax: $4,107 (reported on 73.7% of returns)
25015:
$4,107
State:
$5,372
(% of AGI for various income ranges: 2.2% for AGIs below $10k, 3.5% for AGIs $10k-25k, 6.9% for AGIs $25k-50k, 9.3% for AGIs $50k-75k, 10.8% for AGIs $75k-100k, 16.2% for AGIs over 100k)
Earned income credit: $1,738 (reported on 19.0% of returns)
Here:
$1,738
State:
$1,662
Percentage of individuals using paid preparers for their 2004 taxes: 47.5%
Here:
48%
State:
55%
(% for various income ranges: 39.7% for AGIs below $10k, 50.4% for AGIs $10k-25k, 50.3% for AGIs $25k-50k, 45.9% for AGIs $50k-75k, 49.6% for AGIs $75k-100k, 50.0% for AGIs over 100k)
Likely homosexual households (counted as self-reported same-sex unmarried-partner households)
Lesbian couples: 0.2% of all households
Gay men: 0.7% of all households
Household received Food Stamps/SNAP in the past 12 months: 240 Household did not receive Food Stamps/SNAP in the past 12 months: 1,376
Women who had a birth in the past 12 months: 32 (15 now married, 15 unmarried) Women who did not have a birth in the past 12 months: 606 (276 now married, 329 unmarried)
Housing units in zip code 25015 with a mortgage: 454 (24 second mortgage, 17 both second mortgage and home equity loan) Houses without a mortgage: 17
Median monthly owner costs for units with a mortgage: $1,011 Median monthly owner costs for units without a mortgage: $397
Residents with income below the poverty level in 2022:
This zip code:
12.6%
Whole state:
17.9%
Residents with income below 50% of the poverty level in 2022:
This zip code:
3.1%
Whole state:
9.7%
Median number of rooms in houses and condos:
Here:
6.4
State:
6.5
Median number of rooms in apartments:
Here:
5.7
State:
4.7
Notable locations in this zip code not listed on our city pages
Notable locations in zip code 25015: Belle Volunteer Fire Department (A), Kanawha County Emergency Ambulance Authority Station 59 (B), Belle Volunteer Fire Department Substation 2 (C). Display/hide their locations on the map
Churches in zip code 25015 include: Simmons Creek Church (A), Beulah Church (B), Witcher Baptist Church (C), Marmet Baptist Church (D), Judson Baptist Church (E), Church of Christ (F), Belle Presbyterian Church (G), Belle Church of the Nazarene (H), Naomi Church (I). Display/hide their locations on the map
Major facilities with environmental interests located in this zip code:
EI DUPONT DE NEMOURS & CO (901 WEST DU PONT AVENUE in BELLE, WV)
AIR MAJOR (AIRS/AFS) AIR PROGRAM (Clean Air Markets Division Business System) SUPERFUND (Superfund database) ENFORCEMENT/COMPLIANCE ACTIVITY (Integrated Compliance Information System) - ICIS-03-1997-0285, FORMAL ENFORCEMENT ACTION, ICIS-03-1998-0130, ICIS-03-1985-0043, (Integrated Compliance Information System) - ICIS-03-1997-0285, FORMAL ENFORCEMENT ACTION, ICIS-03-1998-0130, ICIS-03-1985-0043, ENFORCEMENT/COMPLIANCE ACTIVITY (Integrated Compliance Information System) COMPLIANCE ACTIVITY (Tracking inspections of insecticide, fungicide, and rodenticide, and toxic substances) CRITERIA AND HAZARDOUS AIR POLLUTANT INVENTORY (Inventory of air pollution sources) STATE MASTER (New Jersey environmental info) - NJEMS-003232, PESTICIDES - MANUFACTURE National Pollutant Discharge Elimination System MAJOR (Tracking pollutant discharge elimination systems) - permit HAZARDOUS WASTE BIENNIAL REPORTER (Resource Conservation and Recovery Act (tracking hazardous waste)) Large Quantity Generators, more that 1000 kg of hazardous waste/month (Resource Conservation and Recovery Act (tracking hazardous waste)) TSD (Resource Conservation and Recovery Act (tracking hazardous waste)) TRI REPORTER (Tracking of toxic chemicals releasing facilities) Business SIC classification: PLASTICS MATERIALS, SYNTHETIC RESINS, AND NONVULCANIZABLE ELASTOMERS; INDUSTRIAL ORGANIC CHEMICALS; PESTICIDES AND AGRICULTURAL CHEMICALS; ELECTRIC SERVICES Business NAICS classification: ALL OTHER BASIC INORGANIC CHEMICAL MANUFACTURING.; PLASTICS MATERIAL AND RESIN MANUFACTURING. Organizations: LEWIS & HARRISON LLC, EI DUPONT DE NEMOURS & CO INC, E. I. DU PONT DE NEMOURS & CO., INC. (CONTACT/OPERATOR)
, E I DUPONT DE NEMOURS & CO (CONTACT/OWNER)
, E.I. DUPONT DE NEMOURS AND COMPANY (OWNER/OPERATOR)
Alternative names: BELLE PLANT, DU PONT BELLE PLANT, DUPONT - BELLE, DUPONT BELLE PLANT, DUPONT CHEMICAL SOLUTIONS ENTERPRISE, E I DUPONT DE NEMOURS & CO, E I DUPONT DE NEMOURS & CO, MILLER SPRINGS REMEDIATION MAN
CECIL I. WALKER MACHINERY, INC. (112 CARBIDE DRIVE in BELLE, WV)
AIR MINOR (AIRS/AFS) CRITERIA AND HAZARDOUS AIR POLLUTANT INVENTORY (Inventory of air pollution sources) Small Quantity Generators, between 100 kg and 1000 kg of hazardous waste/month (Resource Conservation and Recovery Act (tracking hazardous waste)) - notification Small Quantity Generators, between 100 kg and 1000 kg of hazardous waste/month (Resource Conservation and Recovery Act (tracking hazardous waste)) - notification Business SIC classification: CONSTRUCTION AND MINING (EXCEPT PETROLEUM) MACHINERY AND EQUIPMENT Business NAICS classification: FLUID POWER PUMP AND MOTOR MANUFACTURING.; GENERAL AUTOMOTIVE REPAIR. Organizations: OPERNAME (CONTACT/OPERATOR)
, CECIL I WALKER MACHINERY CO (CONTACT/OWNER)
Alternative names: WALKER CECIL I MACHINERY CO
BELLE ELEMENTARY SCHOOL (401 E 6TH ST in BELLE, WV)
(Geographic Names Information System) (National Center for Education Statistics) - STATE ID-39206 Organizations: KANAWHA COUNTY SCHOOL DISTRICT (SCHOOL DISTRICT)
DUPONT MIDDLE SCHOOL (301 WEST 34TH STREET in BELLE, WV)
(National Center for Education Statistics) - STATE ID-39406 Organizations: KANAWHA COUNTY SCHOOL DISTRICT (SCHOOL DISTRICT)
CECIL I WALKER MACHINERY COMPANY (1450 DUPONT AVENUE EAST in BELLE, WV)
CRITERIA AND HAZARDOUS AIR POLLUTANT INVENTORY (Inventory of air pollution sources) HAZARDOUS WASTE BIENNIAL REPORTER (Resource Conservation and Recovery Act (tracking hazardous waste)) Large Quantity Generators, more that 1000 kg of hazardous waste/month (Resource Conservation and Recovery Act (tracking hazardous waste)) Business SIC classification: CONSTRUCTION AND MINING (EXCEPT PETROLEUM) MACHINERY AND EQUIPMENT Organizations: OPERNAME (CONTACT/OPERATOR)
, WALKER, CECIL I MACHINERY (CONTACT/OWNER)
BELLE TRACT #335 (2011 WEST DUPONT AVE in BELLE, WV) . Federal Facility. ARMY CORPS OF ENGINEERS
(Resource Conservation and Recovery Act (tracking hazardous waste)) Organizations: U. S. GOVERNMENT (CONTACT/OPERATOR)
, UNITED STATES (CONTACT/OWNER)
CON-WAY CENTRAL EXPRESS (1100 RIVER EADT DR in BELLE, WV)
(Resource Conservation and Recovery Act (tracking hazardous waste)) Organizations: OPERNAME (CONTACT/OPERATOR)
, CON-WAY TRANSPORTATION SVC (CONTACT/OWNER)
Alternative names: ARA - SMITHS TRANSFER CORP
CONRAIL DICKINSON YD CAR SHOP (1100 DAIRY LANE in QUINCY, WV)
AIR COMFORT AIR CONDITIONING SVC (1801 W DUPONT AVE in BELLE, WV)
(Resource Conservation and Recovery Act (tracking hazardous waste)) Organizations: JONES JOHNNIE (CONTACT/OWNER)
AIR LIQUIDE LARGE IND U.S. LP - BELLE (901 W DUPONT AVE - SITE B in BELLE, WV)
Conditionally Exempt Small Quantity Generators, less than 100 kg/month of hazardous waste (Resource Conservation and Recovery Act (tracking hazardous waste)) - notification Organizations: AIR LIQUIDE LARGE INDUSTRIES U.S. LP (CONTACT/OPERATOR)
, AIR LIQUIDE AMERICA CORP (CONTACT/OWNER)
Alternative names: AIR LIQUIDE BELL ASU
ARCH MINERALS SHREWSBURY HIX HOLLOW (SHREWSBURY in SHREWSBURY, WV)
BATTLE RIDGE COMPANIES (1000 RIVER EAST DRIVE in BELLE, WV)
(Resource Conservation and Recovery Act (tracking hazardous waste)) Organizations: CATTERTON GROUP LTD DRIVE (CONTACT/OWNER)
Housing units lacking complete plumbing facilities: 3.6% Housing units lacking complete kitchen facilities: 3.8%
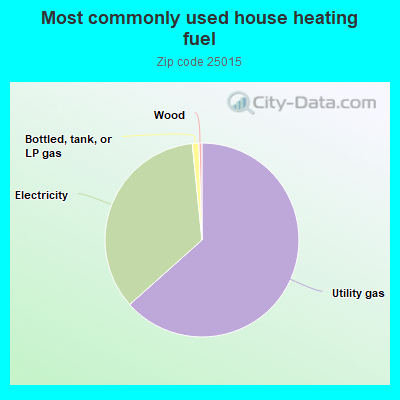
63.4%Utility gas
35.0%Electricity
1.1%Bottled, tank, or LP gas
0.5%Wood
Population in 1990: 7,120.
Place of birth for U.S.-born residents:
This state: 3,063
Northeast: 11
Midwest: 71
South: 143
West: 83
68% of the 25015 zip code residents lived in the same house 5 years ago. Out of people who lived in different houses, 84% lived in this county. Out of people who lived in different counties, 50% lived in West Virginia.
95% of the 25015 zip code residents lived in the same house 1 year ago. Out of people who lived in different houses, 81% moved from this county. Out of people who lived in different houses, 12% moved from different county within same state. Out of people who lived in different houses, 5% moved from different state.
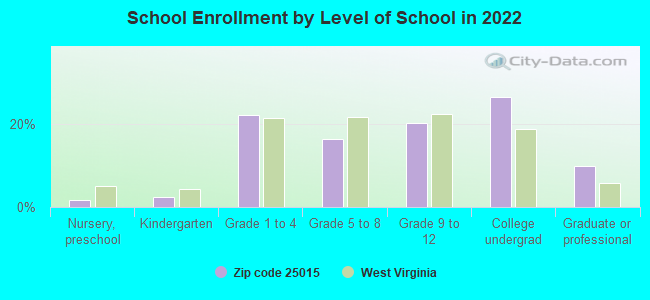
Private vs. public school enrollment:
Students in private schools in grades 1 to 8 (elementary and middle school): 6
Here:
2.2%
West Virginia:
12.2%
Students in private schools in grades 9 to 12 (high school):
Here:
0.0%
West Virginia:
8.8%
Students in private undergraduate colleges:
Here:
0.0%
West Virginia:
17.3%
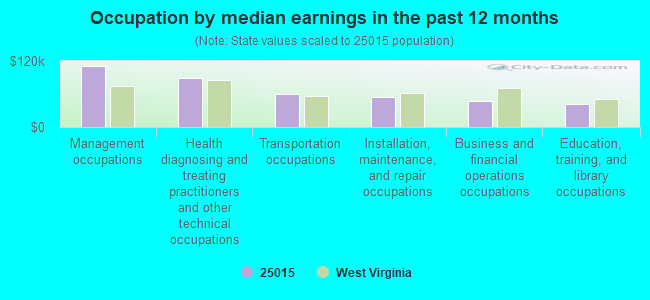
Occupation by median earnings in the past 12 months ($)
110,680Management occupations
88,242Health diagnosing and treating practitioners and other technical occupations
59,162Transportation occupations
53,842Installation, maintenance, and repair occupations
47,835Business and financial operations occupations
41,624Education, training, and library occupations
Companies with federal contracts located in this zip code (BELLE, WV):
PETROLEUM PRODUCTS, INC (500 RIVER EAST DR; small business) : $828,715 in 4 contractsfrom 2001 to 2005
$432,652 with Defense Logistics Agency for Fuel Oils. Signed on 2005-11-10. Completion date: 2010-07-31.
$138,643, same as above.Signed on 2002-07-29. Completion date: 2005-07-31.
$128,710, same as above.Signed on 2001-02-28. Completion date: 2002-07-31.
$128,710, same as above.Signed on 2001-02-28. Completion date: 2001-02-28.
CECIL I WALKER MACHINERY COMPA (1420 DUPONT AVENUE; small business) : $495,845 in 23 contractsfrom 2002 to 2006
Contracts for Diesel Engines and Components, Other Professional Services, Maintenance, Repair and Rebuilding of Equipment -- Engines, Turbines, and Components, Maintenance, Repair and Rebuilding of Equipment -- Electric Wire, and Power and Distribution Equipment, and moreby Army, Mine Safety and Health Administration, U.S. Army Corps of Engineers - civil program financing only, Bureau of Prisoners/Federal Prison System, and others Signed by year:2000: $0; 2001: $0; 2002: $77,571; 2003: $10,327; 2004: $37,739; 2005: $53,784; 2006: $316,424.
Biggest contracts:
$290,974 with Army for Diesel Engines and Components. Signed on 2006-05-19. Completion date: 2006-05-22.
$57,000 with Mine Safety and Health Administration for Other Professional Services. Signed on 2002-07-15. Completion date: 2002-08-15.
$16,626 with Army for Diesel Engines and Components. Taking place in OH. Signed on 2004-11-23. Completion date: 2004-10-20.
$16,626 with U.S. Army Corps of Engineers - civil program financing only for Diesel Engines and Components. Taking place in OH. Signed on 2004-11-23. Completion date: 2004-10-20.
TRAMCO SERVICES (2971 E DUPONT AVE; small business)
$322,840 with Army for Engine Electrical System Components, Nonaircraft. Signed on 2006-05-17. Completion date: 2006-05-18.
AIR LIQUIDE AMERICA CORPORATIO (E I DUPONT PLANT; small business)
$48,000 with Occupational Safety and Health Administration for Chemicals. Taking place in DC. Signed on 1999-11-15. Completion date: 1999-11-15.
E L JOHNSON LAWN CARE (142 DAIRY LANE; small business)
$11,550 with U.S. Army Corps of Engineers - civil program financing only for Landscaping/Groundskeeping Services. Signed on 2003-06-24. Completion date: 2003-12-31.
Top industries in this zip code by the number of employees in 2005:
Management of Companies and Enterprises: Corporate, Subsidiary, and Regional Managing Offices (50-99 employees: 2 establishments)
2002 - 2018 National Fire Incident Reporting System (NFIRS) incidents
According to the data from the years 2002 - 2018 the average number of fires per year is 24. The highest number of reported fire incidents - 41 took place in 2007, and the least - 2 in 2002. The data has an increasing trend.
When looking into fire subcategories, the most incidents belonged to: Structure Fires (43.5%), and Outside Fires (32.2%).
Fire incident types reported to NFIRS in Zip Code 25015
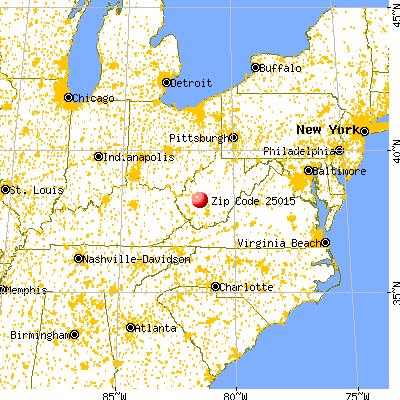


 Nearest zip codes: 25306, 25315, 25067, 25214, 25134, 25035.


 (Students: 198, Location: 200 FERRY ST, Grades: PK-5)
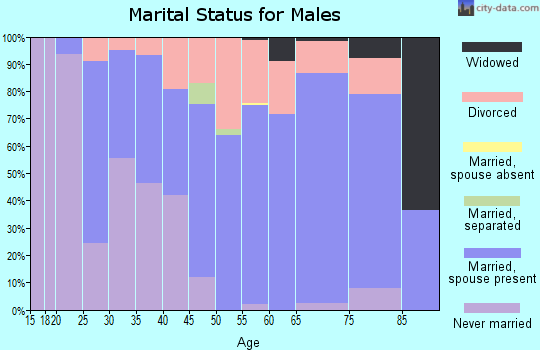
 According to the data from the years 2002 - 2018 the average number of fires per year is 24. The highest number of reported fire incidents - 41 took place in 2007, and the least - 2 in 2002. The data has an increasing trend.
 When looking into fire subcategories, the most incidents belonged to: Structure Fires (43.5%), and Outside Fires (32.2%).