Estimated zip code population in 2022: 5,526 Zip code population in 2010: 5,206 Zip code population in 2000: 6,943
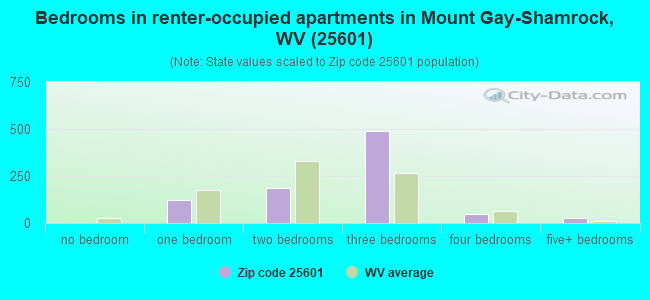
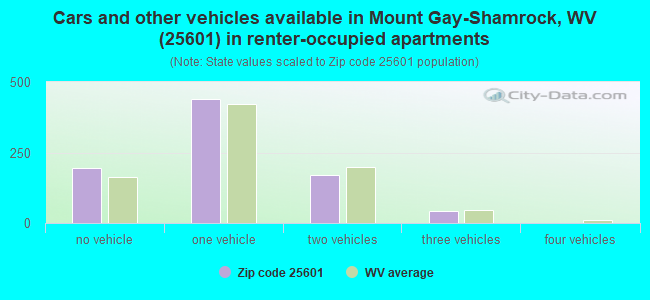
Houses and condos: 2,561 Renter-occupied apartments: 849
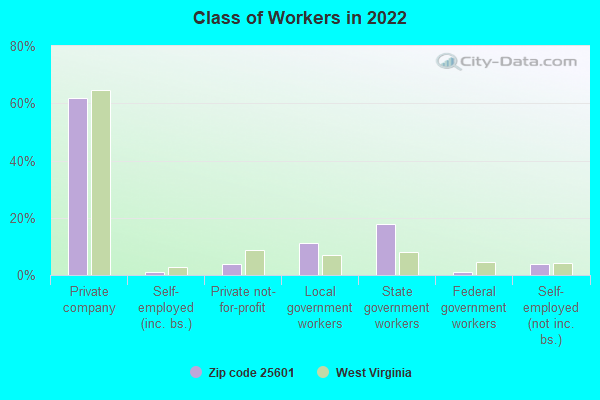
% of renters here:
39%
State:
26%
March 2022 cost of living index in zip code 25601: 81.1 (low, U.S. average is 100)
Land area: 19.8 sq. mi. Water area: 0.2 sq. mi.
Population density: 279 people per square mile
(very low).
OSM Map
General Map
Google Map
MSN Map
OSM Map
General Map
Google Map
MSN Map
OSM Map
General Map
Google Map
MSN Map
OSM Map
General Map
Google Map
MSN Map
Please wait while loading the map...
Real estate property taxes paid for housing units in 2022:
This zip code:
0.7% ($675)
West Virginia:
0.5% ($821)
Median real estate property taxes paid for housing units with mortgages in 2022: $780 (0.7%) Median real estate property taxes paid for housing units with no mortgage in 2022: $562 (0.6%)
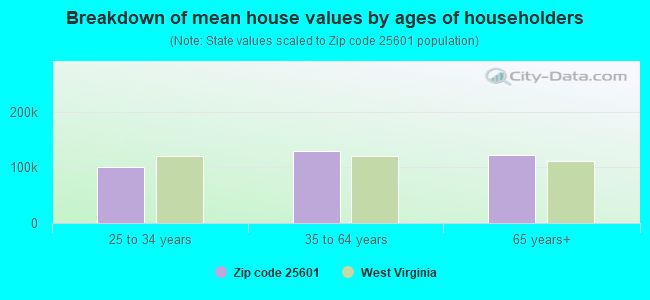
Estimated median house/condo value in 2022: $99,783
25601:
$99,783
West Virginia:
$155,100
According to our research of West Virginia and other state lists, there were 19 registered sex offenders living in 25601 zip code as of April 25, 2024. The ratio of all residents to sex offenders in zip code 25601 is 292 to 1. The ratio of registered sex offenders to all residents in this zip code is near the state average.
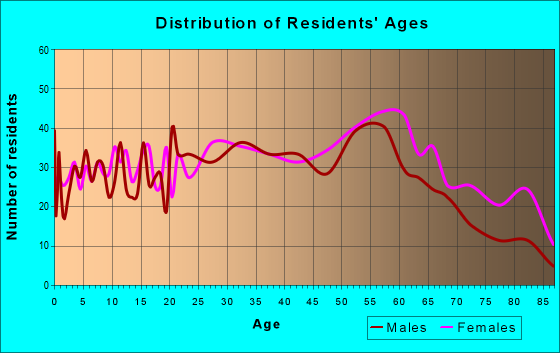
Median resident age:
This zip code:
42.1 years
West Virginia median age:
42.9 years
Average household size:
This zip code:
2.5 people
West Virginia:
2.3 people
Averages for the 2020 tax year for zip code 25601, filed in 2021:
Average Adjusted Gross Income (AGI) in 2020: $49,035 (Individual Income Tax Returns)
Here:
$49,035
State:
$56,292
Salary/wage: $40,508 (reported on 79.0% of returns)
Here:
$40,508
State:
$49,093
(% of AGI for various income ranges: 1046.7% for AGIs below $25k, 3551.8% for AGIs $25k-50k, 5945.5% for AGIs $50k-75k, 8805.5% for AGIs $75k-100k, 15356.4% for AGIs $100k-200k)
Taxable interest for individuals: $1,235 (reported on 23.8% of returns)
This zip code:
$1,235
West Virginia:
$1,141
(% of AGI for various income ranges: 10.9% for AGIs below $25k, 12.6% for AGIs $25k-50k, 48.5% for AGIs $50k-75k, 17.3% for AGIs $75k-100k, 142.7% for AGIs $100k-200k)
Ordinary dividends: $11,605 (reported on 9.3% of returns)
Here:
$11,605
State:
$5,456
(% of AGI for various income ranges: 12.3% for AGIs below $25k, 27.6% for AGIs $25k-50k, 107.5% for AGIs $50k-75k, 94.5% for AGIs $75k-100k, 268.2% for AGIs $100k-200k)
Net capital gain/loss in AGI: +$14,153 (reported on 7.0% of returns)
Here:
+$14,153
State:
+$11,656
(% of AGI for various income ranges: 14.0% for AGIs below $25k, 148.5% for AGIs $50k-75k, 230.9% for AGIs $100k-200k)
Profit/loss from business: +$12,036 (reported on 11.7% of returns)
Here:
+$12,036
State:
+$12,084
(% of AGI for various income ranges: 68.1% for AGIs below $25k, 79.7% for AGIs $25k-50k, 125.5% for AGIs $75k-100k, 1851.8% for AGIs $100k-200k)
Taxable individual retirement arrangement distribution: $11,656 (reported on 7.5% of returns)
25601:
$11,656
West Virginia:
$15,311
(% of AGI for various income ranges: 25.4% for AGIs below $25k, 49.7% for AGIs $25k-50k, 324.0% for AGIs $50k-75k, 754.5% for AGIs $100k-200k)
Total itemized deductions: $29,620 (reported on 2.3% of returns)
Here:
$29,620
State:
$31,950
(% of AGI for various income ranges: 1346.4% for AGIs $100k-200k)
Charity contributions: $16,600 (reported on 1.9% of returns)
Here:
$16,600
State:
$12,364
(% of AGI for various income ranges: 603.6% for AGIs $100k-200k)
Taxes paid: $6,500 (reported on 2.3% of returns)
25601:
$6,500
State:
$7,665
(% of AGI for various income ranges: 295.5% for AGIs $100k-200k)
Earned income credit: $2,333 (reported on 25.2% of returns)
Here:
$2,333
State:
$2,258
(% of AGI for various income ranges: 118.8% for AGIs below $25k, 87.6% for AGIs $25k-50k)
Percentage of individuals using paid preparers for their 2020 taxes: 91.6%
Here:
92%
State:
93%
(% for various income ranges: 93.0% for AGIs below $25k, 91.8% for AGIs $25k-50k, 92.6% for AGIs $50k-75k, 86.7% for AGIs $75k-100k, 84.2% for AGIs $100k-200k, 100.0% for AGIs over 200k)
Averages for the 2012 tax year for zip code 25601, filed in 2013:
Average Adjusted Gross Income (AGI) in 2012: $46,966 (Individual Income Tax Returns)
Here:
$46,966
State:
$48,628
Salary/wage: $40,774 (reported on 80.8% of returns)
Here:
$40,774
State:
$42,328
(% of AGI for various income ranges: 66.5% for AGIs below $25k, 71.0% for AGIs $25k-50k, 74.7% for AGIs $50k-75k, 81.7% for AGIs $75k-100k, 80.9% for AGIs $100k-200k, 44.2% for AGIs over 200k)
Taxable interest for individuals: $1,225 (reported on 26.3% of returns)
This zip code:
$1,225
West Virginia:
$1,211
(% of AGI for various income ranges: 1.5% for AGIs below $25k, 0.9% for AGIs $25k-50k, 0.8% for AGIs $50k-75k, 0.2% for AGIs $75k-100k, 0.5% for AGIs $100k-200k, 0.5% for AGIs over 200k)
Ordinary dividends: $20,303 (reported on 14.7% of returns)
Here:
$20,303
State:
$4,262
(% of AGI for various income ranges: 6.1% for AGIs below $25k, 5.2% for AGIs $25k-50k, 1.7% for AGIs $50k-75k, 1.7% for AGIs $75k-100k, 2.1% for AGIs $100k-200k, 21.4% for AGIs over 200k)
Net capital gain/loss in AGI: +$5,447 (reported on 6.7% of returns)
Here:
+$5,447
State:
+$8,875
(% of AGI for various income ranges: 0.2% for AGIs $25k-50k, 1.0% for AGIs $100k-200k, 3.1% for AGIs over 200k)
Profit/loss from business: +$19,836 (reported on 11.2% of returns)
Here:
+$19,836
State:
+$13,636
(% of AGI for various income ranges: 5.7% for AGIs below $25k, 2.2% for AGIs $25k-50k, 1.9% for AGIs $50k-75k, 1.7% for AGIs $75k-100k, 4.0% for AGIs $100k-200k, 12.5% for AGIs over 200k)
Taxable individual retirement arrangement distribution: $9,994 (reported on 7.1% of returns)
25601:
$9,994
West Virginia:
$11,787
(% of AGI for various income ranges: 2.0% for AGIs below $25k, 1.2% for AGIs $25k-50k, 3.8% for AGIs $50k-75k, 2.1% for AGIs $100k-200k)
Total itemized deductions: $24,124 (18% of AGI, reported on 12.9% of returns)
Here:
$24,124
State:
$21,148
Here:
17.9% of AGI
State:
18.1% of AGI
(% of AGI for various income ranges: 3.6% for AGIs $25k-50k, 3.8% for AGIs $50k-75k, 5.5% for AGIs $75k-100k, 8.1% for AGIs $100k-200k, 16.1% for AGIs over 200k)
Charity contributions: $6,710 (reported on 8.9% of returns)
Here:
$6,710
State:
$4,508
(% of AGI for various income ranges: 0.7% for AGIs $25k-50k, 0.7% for AGIs $50k-75k, 1.0% for AGIs $75k-100k, 1.4% for AGIs $100k-200k, 3.3% for AGIs over 200k)
Taxes paid: $9,417 (reported on 12.9% of returns)
25601:
$9,417
State:
$8,103
(% of AGI for various income ranges: 0.5% for AGIs $25k-50k, 0.9% for AGIs $50k-75k, 1.6% for AGIs $75k-100k, 3.8% for AGIs $100k-200k, 7.3% for AGIs over 200k)
Earned income credit: $2,217 (reported on 23.7% of returns)
Here:
$2,217
State:
$2,140
(% of AGI for various income ranges: 7.9% for AGIs below $25k, 0.9% for AGIs $25k-50k)
Percentage of individuals using paid preparers for their 2012 taxes: 56.2%
Here:
56%
State:
49%
(% for various income ranges: 51.4% for AGIs below $25k, 55.1% for AGIs $25k-50k, 60.7% for AGIs $50k-75k, 57.9% for AGIs $75k-100k, 66.7% for AGIs $100k-200k, 100.0% for AGIs over 200k)
Averages for the 2004 tax year for zip code 25601, filed in 2005:
Average Adjusted Gross Income (AGI) in 2004: $40,329 (Individual Income Tax Returns)
Here:
$40,329
State:
$37,498
Salary/wage: $35,054 (reported on 81.8% of returns)
Here:
$35,054
State:
$33,645
(% of AGI for various income ranges: 91.2% for AGIs below $10k, 68.7% for AGIs $10k-25k, 78.9% for AGIs $25k-50k, 78.3% for AGIs $50k-75k, 81.2% for AGIs $75k-100k, 58.5% for AGIs over 100k)
Taxable interest for individuals: $2,143 (reported on 42.3% of returns)
This zip code:
$2,143
West Virginia:
$1,465
(% of AGI for various income ranges: 4.0% for AGIs below $10k, 2.8% for AGIs $10k-25k, 2.7% for AGIs $25k-50k, 1.7% for AGIs $50k-75k, 2.2% for AGIs $75k-100k, 2.0% for AGIs over 100k)
Taxable dividends: $8,880 (reported on 19.8% of returns)
Here:
$8,880
State:
$2,913
(% of AGI for various income ranges: 1.9% for AGIs below $10k, 1.5% for AGIs $10k-25k, 1.2% for AGIs $25k-50k, 1.6% for AGIs $50k-75k, 0.5% for AGIs $75k-100k, 10.2% for AGIs over 100k)
Net capital gain/loss: +$2,899 (reported on 12.8% of returns)
Here:
+$2,899
State:
+$6,331
(% of AGI for various income ranges: -1.0% for AGIs below $10k, 0.3% for AGIs $10k-25k, 0.5% for AGIs $25k-50k, 0.6% for AGIs $50k-75k, 0.1% for AGIs $75k-100k, 2.0% for AGIs over 100k)
Profit/loss from business: +$13,648 (reported on 12.9% of returns)
Here:
+$13,648
State:
+$11,074
(% of AGI for various income ranges: 7.6% for AGIs below $10k, 3.3% for AGIs $10k-25k, 0.7% for AGIs $25k-50k, 2.3% for AGIs $50k-75k, 3.8% for AGIs $75k-100k, 8.1% for AGIs over 100k)
IRA payment deduction: $2,923 (reported on 2.0% of returns)
25601:
$2,923
West Virginia:
$2,796
Total itemized deductions: $18,817 (15% of AGI, reported on 14.1% of returns)
Here:
$18,817
State:
$16,976
Here:
15.4% of AGI
State:
19.0% of AGI
(% of AGI for various income ranges: 2.3% for AGIs $10k-25k, 4.1% for AGIs $25k-50k, 4.9% for AGIs $50k-75k, 8.8% for AGIs $75k-100k, 10.3% for AGIs over 100k)
Charity contributions deductions: $4,405 (3% of AGI, reported on 12.0% of returns)
Here:
$4,405
State:
$3,529
Here:
3.3% of AGI
State:
3.7% of AGI
(% of AGI for various income ranges: 0.3% for AGIs $10k-25k, 0.7% for AGIs $25k-50k, 1.1% for AGIs $50k-75k, 1.7% for AGIs $75k-100k, 2.1% for AGIs over 100k)
Total tax: $6,707 (reported on 72.1% of returns)
25601:
$6,707
State:
$5,372
(% of AGI for various income ranges: 3.0% for AGIs below $10k, 3.5% for AGIs $10k-25k, 7.1% for AGIs $25k-50k, 9.7% for AGIs $50k-75k, 11.2% for AGIs $75k-100k, 20.0% for AGIs over 100k)
Earned income credit: $1,777 (reported on 20.4% of returns)
Here:
$1,777
State:
$1,662
Percentage of individuals using paid preparers for their 2004 taxes: 59.2%
Here:
59%
State:
55%
(% for various income ranges: 55.5% for AGIs below $10k, 61.3% for AGIs $10k-25k, 56.1% for AGIs $25k-50k, 56.9% for AGIs $50k-75k, 61.0% for AGIs $75k-100k, 75.9% for AGIs over 100k)
Likely homosexual households (counted as self-reported same-sex unmarried-partner households)
Lesbian couples: 0.0% of all households
Gay men: 0.0% of all households
Household received Food Stamps/SNAP in the past 12 months: 655 Household did not receive Food Stamps/SNAP in the past 12 months: 1,529
Women who had a birth in the past 12 months: 49 (36 now married, 13 unmarried) Women who did not have a birth in the past 12 months: 1,095 (552 now married, 542 unmarried)
Housing units in zip code 25601 with a mortgage: 442 (12 second mortgage, 12 both second mortgage and home equity loan) Houses without a mortgage: 47
Median monthly owner costs for units with a mortgage: $946 Median monthly owner costs for units without a mortgage: $434
Residents with income below the poverty level in 2022:
This zip code:
22.3%
Whole state:
17.9%
Residents with income below 50% of the poverty level in 2022:
This zip code:
13.6%
Whole state:
9.7%
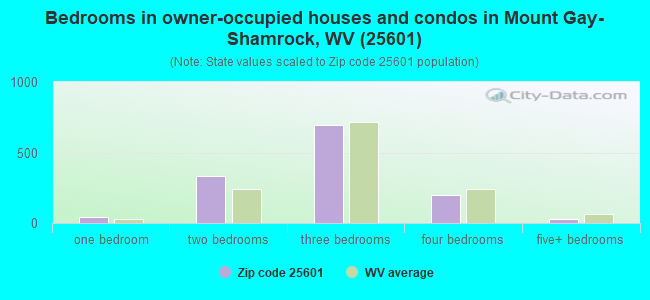
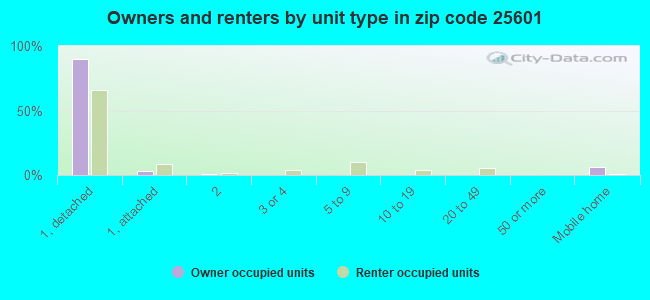
Median number of rooms in houses and condos:
Here:
6.7
State:
6.5
Median number of rooms in apartments:
Here:
5.9
State:
4.7
Notable locations in this zip code not listed on our city pages
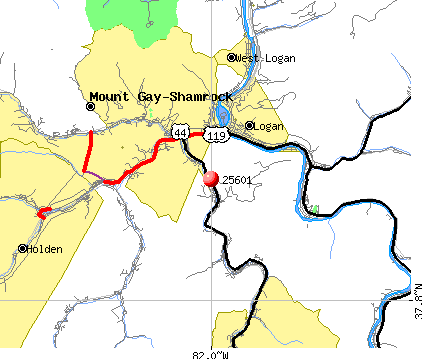
Notable locations in zip code 25601: Monitor Junction (A), West Virginia Division of Forestry Logan County Field Office (B), Logan City Fire Department (C), Guyan Valley Hospital (D), Logan Emergency Ambulance Service Authority (E), Logan County Courthouse (F), Henlawson Volunteer Fire Department (G). Display/hide their locations on the map
Churches in zip code 25601 include: Varney Branch Church (A), West Logan Baptist Church (B), Our Lady of Mount Carmel Roman Catholic Church (C), Nighbert Memorial United Methodist Church (D), Logan Holiness International Church (E), Holy Trinity Episcopal Church (F), First Presbyterian Church (G), First Church of God (H), First Christian Church (I). Display/hide their locations on the map
Streams, rivers, and creeks: Snap Creek (A), Mud Fork (B), Mill Creek (C), Lynn Branch (D), Lawson Branch (E), Island Creek (F), Coal Branch (G), Stonecoal Branch (H), Buffalo Creek (I). Display/hide their locations on the map
In group quarters: 133 (-1 institutionalized population)
Size of family households: 741 2-persons, 373 3-persons, 225 4-persons, 60 5-persons, 25 6-persons, 69 7-or-more-persons
Size of nonfamily households: 522 1-person, 113 2-persons, 23 3-persons
549 married couples with children.
233 single-parent households (84 men, 149 women).
99.4% of residents of 25601 zip code speak English at home.
0.2% of residents speak Spanish at home (64% very well, 36% not well).
0.1% of residents speak other Indo-European language at home (100% not well).
0.2% of residents speak Asian or Pacific Island language at home (55% very well, 45% well).
0.1% of residents speak other language at home (100% very well).
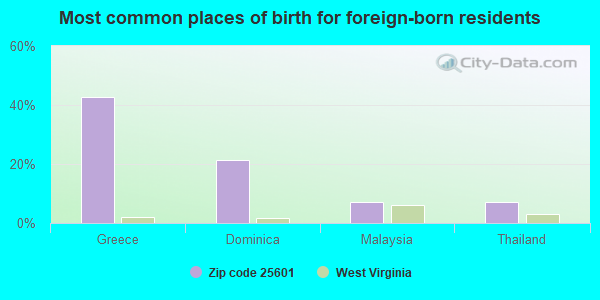
Foreign born population: 16 (0.3%) (87.1% of them are naturalized citizens)
This zip code:
0.3%
Whole state:
1.8%
43%Greece
21%Dominica
7%Malaysia
7%Thailand
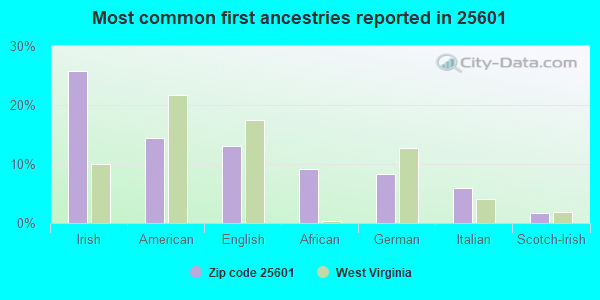
26%Irish
14%American
13%English
9%African
8%German
6%Italian
2%Scotch-Irish
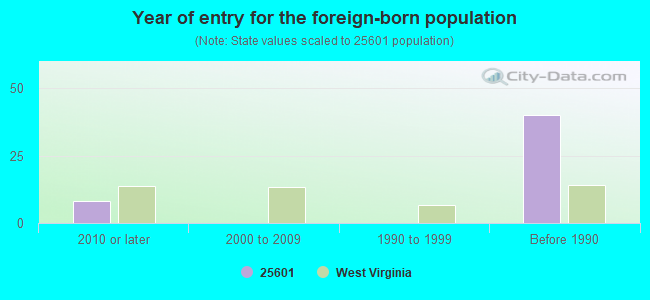
Year of entry for the foreign-born population
82010 or later
02000 to 2009
01990 to 1999
40Before 1990
Major facilities with environmental interests located in this zip code:
ARACOMA READY MIX INC. (P.O. BOX 359 in LOGAN, WV)
AIR MINOR (AIRS/AFS) Business SIC classification: READY-MIXED CONCRETE
B&M REPAIR INC (RTE 10 in WEST LOGAN, WV)
(Resource Conservation and Recovery Act (tracking hazardous waste)) Organizations: OPERNAME (CONTACT/OPERATOR)
, HOMER BUTCHER (CONTACT/OWNER)
CHESAPEAKE & POTOMAC TELEPHONE CO (ARACOMA STOREROOM in LOGAN, WV)
(Resource Conservation and Recovery Act (tracking hazardous waste)) Organizations: OPERNAME (CONTACT/OPERATOR)
, BELL ATLANTIC CORP (CONTACT/OWNER)
National Pollutant Discharge Elimination System NON-MAJOR (Tracking pollutant discharge elimination systems) - permit Business SIC classification: SEWERAGE SYSTEMS Organizations: WV DIVISION OF NATURAL RESOURC (CONTACT/OWNER)
Alternative names: WV DIVISION OF NATURAL RESOURC
CHIEF LOGAN STATE PARK (STATE RT. 10 in LOGAN, WV)
National Pollutant Discharge Elimination System NON-MAJOR (Tracking pollutant discharge elimination systems) - permit Business SIC classification: SEWERAGE SYSTEMS Organizations: WV DIVISION OF NATURAL RESOURC (CONTACT/OWNER)
Alternative names: WV DIVISION OF NATURAL RESOURC
CHIEF LOGAN STATE PARK/CAMPGRO (CAMPGROUND AREA in LOGAN, WV)
National Pollutant Discharge Elimination System NON-MAJOR (Tracking pollutant discharge elimination systems) - permit Business SIC classification: SEWERAGE SYSTEMS Organizations: WV DIVISION OF NATURAL RESOURC (CONTACT/OWNER)
Alternative names: WV DIVISION OF NATURAL RESOURC
A & B SLICK FINISH (MUD FORK ROAD 1/2 MILE NORTH ROUTE 5 in LOGAN, WV)
(Resource Conservation and Recovery Act (tracking hazardous waste)) Organizations: ALBERT KINCAID (CONTACT/OWNER)
APPALACHAIN TIRE LOGAN (30 MAIN AVE in LOGAN, WV)
(Resource Conservation and Recovery Act (tracking hazardous waste)) Organizations: DAL WALTER (CONTACT/OWNER)
BIG VALLEY TRANSPORT INC (5 MI EAST OF MAN ON RT 99 in LOGAN, WV)
(Resource Conservation and Recovery Act (tracking hazardous waste)) Organizations: P DOUGLAS MCKEE (CONTACT/OWNER)
BOBS AUTO MART (RT 10 4 1/2 MI S OF LOGAN in LOGAN, WV)
(Resource Conservation and Recovery Act (tracking hazardous waste)) Organizations: SAM NICK SAVAS (CONTACT/OWNER)
BRANDED MKTG ASHLAND OIL INC (NORTH POWERHOUSE ADDITION in LOGAN, WV)
(Resource Conservation and Recovery Act (tracking hazardous waste))
Housing units lacking complete plumbing facilities: 8.7% Housing units lacking complete kitchen facilities: 3.1%
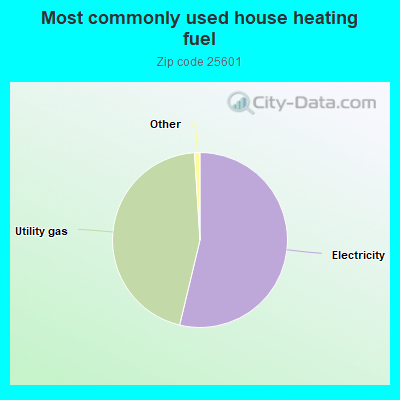
53.8%Electricity
45.3%Utility gas
Population in 1990: 14,143.
Place of birth for U.S.-born residents:
This state: 4,500
Northeast: 36
Midwest: 254
South: 614
West: 30
70% of the 25601 zip code residents lived in the same house 5 years ago. Out of people who lived in different houses, 71% lived in this county. Out of people who lived in different counties, 50% lived in West Virginia.
91% of the 25601 zip code residents lived in the same house 1 year ago. Out of people who lived in different houses, 63% moved from this county. Out of people who lived in different houses, 27% moved from different county within same state. Out of people who lived in different houses, 7% moved from different state.
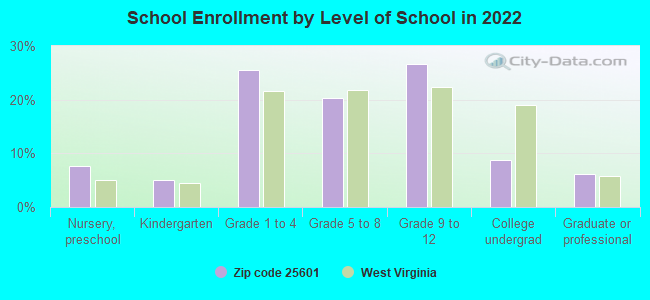
Private vs. public school enrollment:
Students in private schools in grades 1 to 8 (elementary and middle school): 41
Here:
9.2%
West Virginia:
12.2%
Students in private schools in grades 9 to 12 (high school): 17
Here:
6.8%
West Virginia:
8.8%
Students in private undergraduate colleges: 2
Here:
3.4%
West Virginia:
17.3%
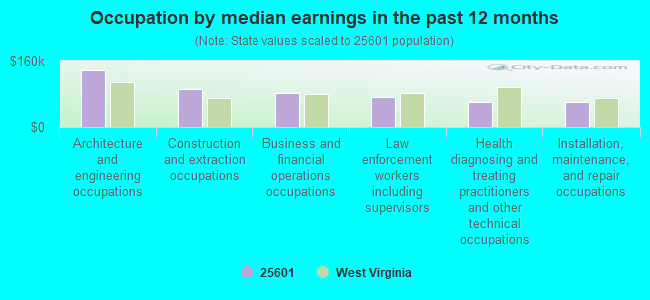
Occupation by median earnings in the past 12 months ($)
138,826Architecture and engineering occupations
92,371Construction and extraction occupations
83,174Business and financial operations occupations
73,376Law enforcement workers including supervisors
61,431Health diagnosing and treating practitioners and other technical occupations
59,506Installation, maintenance, and repair occupations
Top industries in this zip code by the number of employees in 2005:
Health Care and Social Assistance: Offices of Physicians (except Mental Health Specialists) (500-999 employees: 1 establishment, 10-19 employees: 2 establishments, 5-9 employees: 9 establishments, 1-4 employees: 11 establishments)
Health Care and Social Assistance: Nursing Care Facilities (100-249: 1, 50-99: 2, 1-4: 1)
Health Care and Social Assistance: Outpatient Mental Health and Substance Abuse Centers (100-249: 1, 5-9: 1)
Health Care and Social Assistance: Child Day Care Services (50-99: 1, 10-19: 1, 1-4: 2)
Professional, Scientific, and Technical Services: Offices of Lawyers (20-49: 1, 10-19: 1, 5-9: 2, 1-4: 14)
People in group quarters in 2010:
113 people in nursing facilities/skilled-nursing facilities
People in group quarters in 2000:
182 people in nursing homes
70 people in orthopedic wards and institutions for the physically handicapped
Fatal accident statistics in 2014:
Fatal accident count: 1
Vehicles involved in fatal accidents: 1
Fatal accidents caused by drunken drivers: 1
Fatalities: 1
Persons involved in fatal accidents: 3
Pedestrians involved in fatal accidents: 1
Fatal accident statistics in 2013:
Fatal accident count: 1
Vehicles involved in fatal accidents: 1
Fatal accidents caused by drunken drivers: 0
Fatalities: 1
Persons involved in fatal accidents: 1
Pedestrians involved in fatal accidents: 0
2003 - 2018 National Fire Incident Reporting System (NFIRS) incidents
According to the data from the years 2003 - 2018 the average number of fire incidents per year is 52. The highest number of fires - 70 took place in 2007, and the least - 25 in 2003. The data has an increasing trend.
When looking into fire subcategories, the most incidents belonged to: Structure Fires (54.9%), and Outside Fires (24.1%).
Fire incident types reported to NFIRS in Zip Code 25601
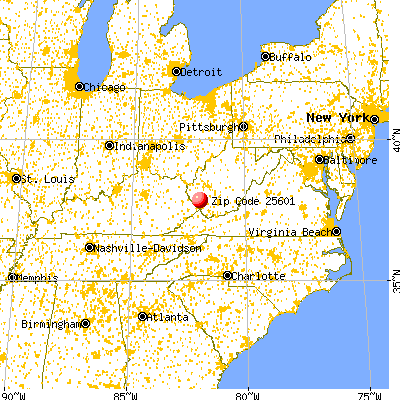


 Nearest zip codes: 25637, 25653, 25624, 25639, 25547, 25076.
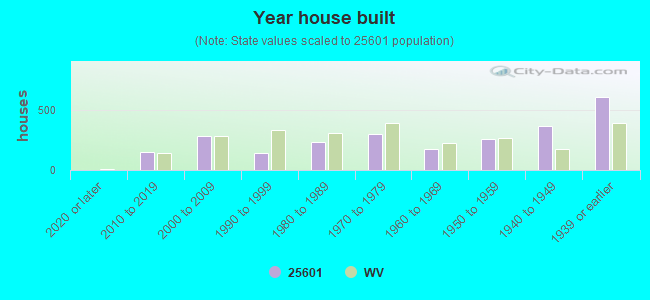


 According to the data from the years 2003 - 2018 the average number of fire incidents per year is 52. The highest number of fires - 70 took place in 2007, and the least - 25 in 2003. The data has an increasing trend.
 When looking into fire subcategories, the most incidents belonged to: Structure Fires (54.9%), and Outside Fires (24.1%).