Estimated zip code population in 2022: 1,650 Zip code population in 2010: 1,676 Zip code population in 2000: 1,762
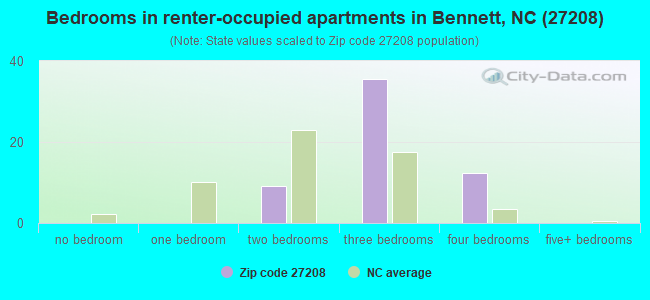
Houses and condos: 877 Renter-occupied apartments: 56
% of renters here:
8%
State:
33%
March 2022 cost of living index in zip code 27208: 80.4 (low, U.S. average is 100)
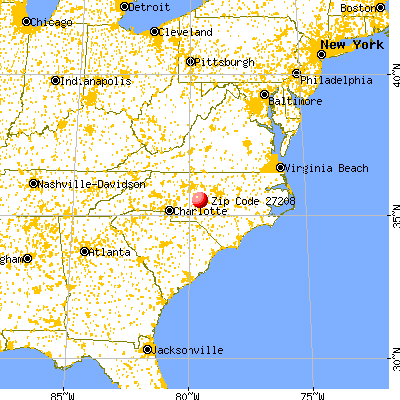
Land area: 38.9 sq. mi. Water area: 0.1 sq. mi.
Population density: 42 people per square mile
(very low).
OSM Map
General Map
Google Map
MSN Map
OSM Map
General Map
Google Map
MSN Map
OSM Map
General Map
Google Map
MSN Map
OSM Map
General Map
Google Map
MSN Map
Please wait while loading the map...
Real estate property taxes paid for housing units in 2022:
This zip code:
0.5% ($783)
North Carolina:
0.6% ($1,769)
Median real estate property taxes paid for housing units with mortgages in 2022: $990 (0.3%) Median real estate property taxes paid for housing units with no mortgage in 2022: $695 (0.6%)
Business Search- 14 Million verified businesses
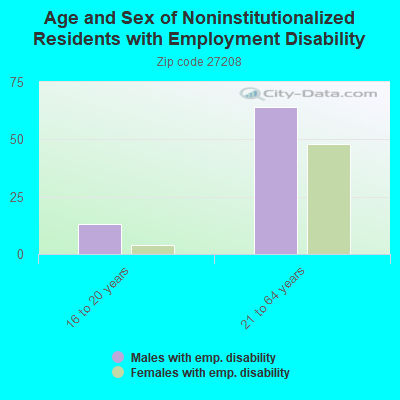
Males: 750
(45.4%)
Females: 900
(54.6%)
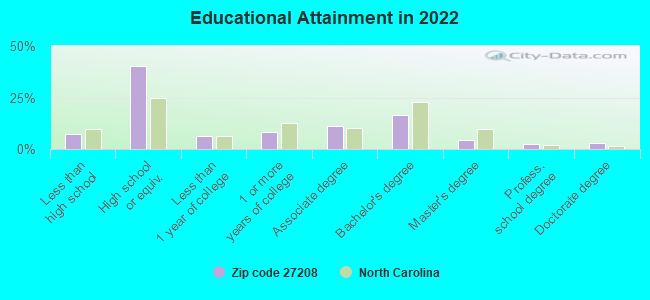
For population 25 years and over in 27208:
High school or higher: 92.3%
Bachelor's degree or higher: 26.7%
Graduate or professional degree: 10.3%
Unemployed: 3.3%
Mean travel time to work (commute): 26.6 minutes
For population 15 years and over in 27208:
Never married: 16.1%
Now married: 63.6%
Separated: 0.6%
Widowed: 5.8%
Divorced: 13.8%
Zip code 27208 compared to state average:
Median house value below state average.
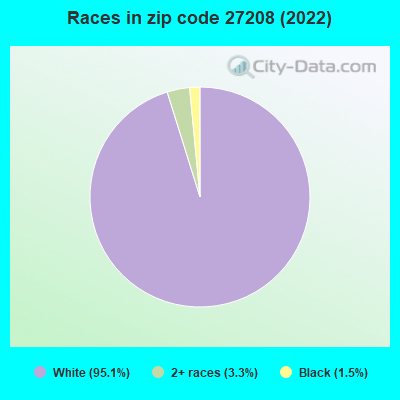
Black race population percentage significantly below state average.
Hispanic race population percentage significantly below state average.
Median age significantly above state average.
Foreign-born population percentage significantly below state average.
Renting percentage significantly below state average.
Length of stay since moving in significantly above state average.
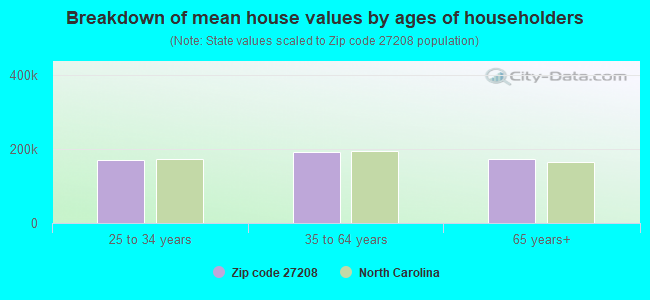
Estimated median house/condo value in 2022: $160,189
27208:
$160,189
North Carolina:
$280,600
According to our research of North Carolina and other state lists, there were 6 registered sex offenders living in 27208 zip code as of April 25, 2024. The ratio of all residents to sex offenders in zip code 27208 is 316 to 1.
Median resident age:
This zip code:
50.5 years
North Carolina median age:
39.2 years
Average household size:
This zip code:
2.5 people
North Carolina:
2.4 people
Averages for the 2020 tax year for zip code 27208, filed in 2021:
Average Adjusted Gross Income (AGI) in 2020: $52,403 (Individual Income Tax Returns)
Here:
$52,403
State:
$70,020
Salary/wage: $50,287 (reported on 78.9% of returns)
Here:
$50,287
State:
$58,387
(% of AGI for various income ranges: 1045.9% for AGIs below $25k, 3731.4% for AGIs $25k-50k, 6922.2% for AGIs $50k-75k, 10362.0% for AGIs $75k-100k, 19598.3% for AGIs $100k-200k)
Taxable interest for individuals: $739 (reported on 36.8% of returns)
This zip code:
$739
North Carolina:
$1,479
(% of AGI for various income ranges: 27.6% for AGIs below $25k, 29.3% for AGIs $25k-50k, 31.1% for AGIs $50k-75k, 86.0% for AGIs $75k-100k, 80.0% for AGIs $100k-200k)
Ordinary dividends: $1,400 (reported on 11.8% of returns)
Here:
$1,400
State:
$7,888
(% of AGI for various income ranges: 10.6% for AGIs below $25k, 32.2% for AGIs $50k-75k, 131.7% for AGIs $100k-200k)
Net capital gain/loss in AGI: +$6,700 (reported on 11.8% of returns)
Here:
+$6,700
State:
+$23,652
(% of AGI for various income ranges: 10.0% for AGIs below $25k, 194.4% for AGIs $50k-75k, 685.0% for AGIs $100k-200k)
Profit/loss from business: +$8,136 (reported on 18.4% of returns)
Here:
+$8,136
State:
+$11,710
(% of AGI for various income ranges: 155.3% for AGIs below $25k, 160.7% for AGIs $25k-50k, 552.2% for AGIs $50k-75k, 255.0% for AGIs $100k-200k)
Taxable individual retirement arrangement distribution: $11,900 (reported on 10.5% of returns)
27208:
$11,900
North Carolina:
$20,247
(% of AGI for various income ranges: 128.8% for AGIs below $25k, 193.6% for AGIs $25k-50k, 924.0% for AGIs $75k-100k)
Total itemized deductions: $35,300 (reported on 3.9% of returns)
Here:
$35,300
State:
$34,549
(% of AGI for various income ranges: 1765.0% for AGIs $100k-200k)
Charity contributions: $14,600 (reported on 3.9% of returns)
Here:
$14,600
State:
$13,360
(% of AGI for various income ranges: 730.0% for AGIs $100k-200k)
Taxes paid: $9,067 (reported on 3.9% of returns)
27208:
$9,067
State:
$7,586
(% of AGI for various income ranges: 453.3% for AGIs $100k-200k)
Earned income credit: $1,815 (reported on 17.1% of returns)
Here:
$1,815
State:
$2,337
(% of AGI for various income ranges: 84.7% for AGIs below $25k, 65.7% for AGIs $25k-50k)
Percentage of individuals using paid preparers for their 2020 taxes: 93.4%
Here:
93%
State:
93%
(% for various income ranges: 96.2% for AGIs below $25k, 94.7% for AGIs $25k-50k, 92.3% for AGIs $50k-75k, 87.5% for AGIs $75k-100k, 90.0% for AGIs $100k-200k)
Averages for the 2012 tax year for zip code 27208, filed in 2013:
Average Adjusted Gross Income (AGI) in 2012: $40,955 (Individual Income Tax Returns)
Here:
$40,955
State:
$54,937
Salary/wage: $39,424 (reported on 79.7% of returns)
Here:
$39,424
State:
$46,336
(% of AGI for various income ranges: 66.7% for AGIs below $25k, 74.5% for AGIs $25k-50k, 80.3% for AGIs $50k-75k, 83.3% for AGIs $75k-100k, 75.3% for AGIs $100k-200k)
Taxable interest for individuals: $604 (reported on 40.6% of returns)
This zip code:
$604
North Carolina:
$1,298
(% of AGI for various income ranges: 2.2% for AGIs below $25k, 0.6% for AGIs $25k-50k, 0.3% for AGIs $50k-75k, 0.4% for AGIs $75k-100k, 0.2% for AGIs $100k-200k)
Ordinary dividends: $1,343 (reported on 10.1% of returns)
Here:
$1,343
State:
$6,213
Net capital gain/loss in AGI: +$583 (reported on 8.7% of returns)
Here:
+$583
State:
+$12,740
Profit/loss from business: +$5,969 (reported on 18.8% of returns)
Here:
+$5,969
State:
+$10,311
(% of AGI for various income ranges: 7.8% for AGIs below $25k, 4.5% for AGIs $25k-50k, 2.3% for AGIs $50k-75k, 0.9% for AGIs $75k-100k)
Taxable individual retirement arrangement distribution: $7,290 (reported on 14.5% of returns)
27208:
$7,290
North Carolina:
$15,575
(% of AGI for various income ranges: 5.1% for AGIs below $25k, 3.2% for AGIs $25k-50k, 5.1% for AGIs $50k-75k)
Total itemized deductions: $18,072 (25% of AGI, reported on 26.1% of returns)
Here:
$18,072
State:
$23,438
Here:
25.1% of AGI
State:
21.5% of AGI
(% of AGI for various income ranges: 8.6% for AGIs below $25k, 9.8% for AGIs $25k-50k, 8.6% for AGIs $50k-75k, 10.3% for AGIs $75k-100k, 19.4% for AGIs $100k-200k)
Charity contributions: $5,256 (reported on 23.2% of returns)
Here:
$5,256
State:
$4,687
(% of AGI for various income ranges: 3.4% for AGIs $25k-50k, 2.2% for AGIs $50k-75k, 3.3% for AGIs $75k-100k, 4.8% for AGIs $100k-200k)
Taxes paid: $5,328 (reported on 26.1% of returns)
27208:
$5,328
State:
$8,823
(% of AGI for various income ranges: 1.8% for AGIs below $25k, 2.4% for AGIs $25k-50k, 2.6% for AGIs $50k-75k, 3.8% for AGIs $75k-100k, 5.9% for AGIs $100k-200k)
Earned income credit: $2,262 (reported on 18.8% of returns)
Here:
$2,262
State:
$2,376
(% of AGI for various income ranges: 6.7% for AGIs below $25k, 0.8% for AGIs $25k-50k)
Percentage of individuals using paid preparers for their 2012 taxes: 73.9%
Here:
74%
State:
53%
(% for various income ranges: 67.9% for AGIs below $25k, 78.9% for AGIs $25k-50k, 72.7% for AGIs $50k-75k, 83.3% for AGIs $75k-100k, 80.0% for AGIs $100k-200k)
Averages for the 2004 tax year for zip code 27208, filed in 2005:
Average Adjusted Gross Income (AGI) in 2004: $38,301 (Individual Income Tax Returns)
Here:
$38,301
State:
$45,376
Salary/wage: $35,586 (reported on 84.4% of returns)
Here:
$35,586
State:
$39,442
(% of AGI for various income ranges: 75.1% for AGIs below $10k, 72.6% for AGIs $10k-25k, 83.1% for AGIs $25k-50k, 84.5% for AGIs $50k-75k, 88.0% for AGIs $75k-100k, 55.5% for AGIs over 100k)
Taxable interest for individuals: $860 (reported on 51.6% of returns)
This zip code:
$860
North Carolina:
$1,515
(% of AGI for various income ranges: 6.4% for AGIs below $10k, 1.7% for AGIs $10k-25k, 1.1% for AGIs $25k-50k, 1.0% for AGIs $50k-75k, 0.7% for AGIs $75k-100k, 0.8% for AGIs over 100k)
Taxable dividends: $648 (reported on 13.2% of returns)
Here:
$648
State:
$4,016
(% of AGI for various income ranges: 0.7% for AGIs below $10k, 0.1% for AGIs $10k-25k, 0.3% for AGIs $25k-50k, 0.2% for AGIs $50k-75k, 0.5% for AGIs $75k-100k)
Net capital gain/loss: +$1,578 (reported on 9.2% of returns)
Here:
+$1,578
State:
+$11,152
(% of AGI for various income ranges: -0.9% for AGIs below $10k, 0.5% for AGIs $10k-25k, -0.1% for AGIs $25k-50k, 0.3% for AGIs $50k-75k, 1.7% for AGIs $75k-100k)
Profit/loss from business: +$6,852 (reported on 16.6% of returns)
Here:
+$6,852
State:
+$9,490
(% of AGI for various income ranges: -10.9% for AGIs below $10k, 11.5% for AGIs $10k-25k, 4.5% for AGIs $25k-50k, 1.8% for AGIs $50k-75k)
Profit/loss from farming: +$47 (reported on 15.3% of returns)
Here:
+$47
State:
-$3,231
(% of AGI for various income ranges: 0.0% for AGIs below $10k, 3.6% for AGIs $10k-25k, 1.7% for AGIs $25k-50k, -2.7% for AGIs $50k-75k, -1.1% for AGIs $75k-100k)
IRA payment deduction: $2,931 (reported on 4.2% of returns)
27208:
$2,931
North Carolina:
$2,967
Total itemized deductions: $15,688 (24% of AGI, reported on 25.4% of returns)
Here:
$15,688
State:
$19,464
Here:
23.9% of AGI
State:
22.7% of AGI
(% of AGI for various income ranges: 9.5% for AGIs $10k-25k, 7.5% for AGIs $25k-50k, 10.2% for AGIs $50k-75k, 16.0% for AGIs $75k-100k, 12.2% for AGIs over 100k)
Charity contributions deductions: $3,675 (5% of AGI, reported on 23.1% of returns)
Here:
$3,675
State:
$4,035
Here:
5.4% of AGI
State:
4.5% of AGI
(% of AGI for various income ranges: 1.7% for AGIs $10k-25k, 2.1% for AGIs $25k-50k, 1.9% for AGIs $50k-75k, 3.4% for AGIs $75k-100k, 2.5% for AGIs over 100k)
Total tax: $4,420 (reported on 77.5% of returns)
27208:
$4,420
State:
$7,257
(% of AGI for various income ranges: 3.3% for AGIs below $10k, 5.2% for AGIs $10k-25k, 6.3% for AGIs $25k-50k, 9.1% for AGIs $50k-75k, 9.4% for AGIs $75k-100k, 16.5% for AGIs over 100k)
Earned income credit: $1,626 (reported on 17.8% of returns)
Here:
$1,626
State:
$1,851
Percentage of individuals using paid preparers for their 2004 taxes: 80.2%
Here:
80%
State:
62%
(% for various income ranges: 77.3% for AGIs below $10k, 83.6% for AGIs $10k-25k, 79.6% for AGIs $25k-50k, 78.1% for AGIs $50k-75k, 83.7% for AGIs $75k-100k, 73.9% for AGIs over 100k)
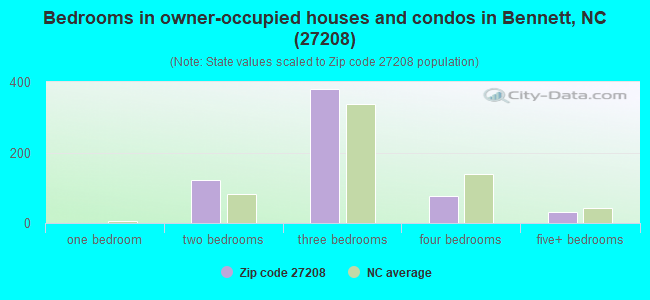
Size of family households: 293 2-persons, 144 3-persons, 36 4-persons, 51 5-persons, 3 6-persons
Size of nonfamily households: 92 1-person, 49 2-persons
137 married couples with children.
49 single-parent households (49 women).
97.7% of residents of 27208 zip code speak English at home.
2.3% of residents speak Spanish at home (100% very well).
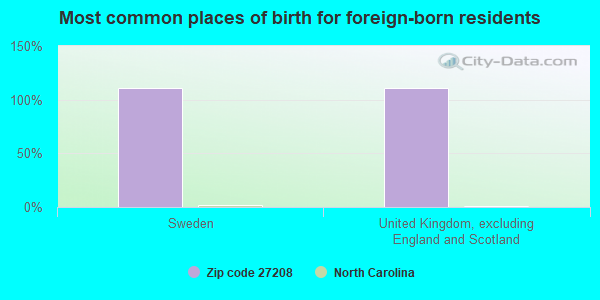
Foreign born population: 9 (0.6%) (100.0% of them are naturalized citizens)
This zip code:
0.6%
Whole state:
8.6%
111%Sweden
111%United Kingdom, excluding England and Scotland
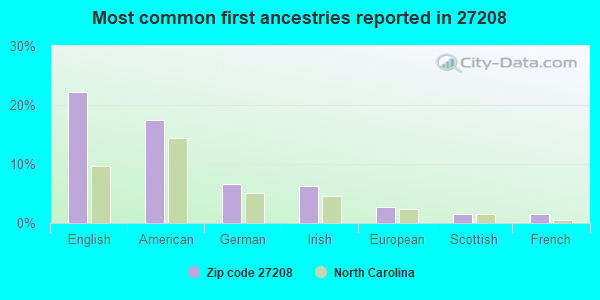
22%English
18%American
7%German
6%Irish
3%European
2%Scottish
1%French
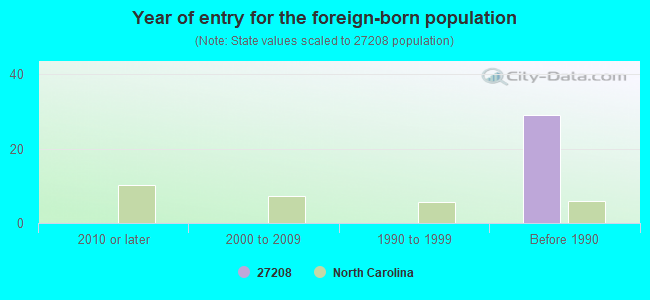
Year of entry for the foreign-born population
02010 or later
02000 to 2009
01990 to 1999
29Before 1990
Facilities with environmental interests located in this zip code:
BENNETT ELEMENTARY (61 RANDOLPH ST in BENNETT, NC)
(Geographic Names Information System) STATE MASTER (North Carolina facility info) - UNDERGROUND STORAGE TANK PROGRAM (National Center for Education Statistics) - STATE ID-304 Business SIC classification: NONCLASSIFIABLE ESTABLISHMENTS Organizations: CHATHAM COUNTY SCHOOLS (SCHOOL DISTRICT)
Alternative names: BENNETT ELEMENTARY SCHOOL, BENNETT SCHOOL
BILLY HUSSEY RESIDENCE (625 NC HWY 42/22 in BENNETT, NC)
STATE MASTER (North Carolina facility info) - -115DA4YG00M69W84AY3VG5RMSU, WASTEWATER FACILITY National Pollutant Discharge Elimination System NON-MAJOR (Tracking pollutant discharge elimination systems) - permit Business SIC classification: PRIVATE HOUSEHOLDS Alternative names: HUSSEY, BILLY
BENNETT ELEMENTARY SCHOOL WWTP (NCSR 1162 in BENNETT, NC)
National Pollutant Discharge Elimination System NON-MAJOR (Tracking pollutant discharge elimination systems) - permit Business SIC classification: ELEMENTARY AND SECONDARY SCHOOLS Alternative names: CHATHAM CO SCH-BENNETT ELEM
Housing units lacking complete plumbing facilities: 6.5% Housing units lacking complete kitchen facilities: 2.8%
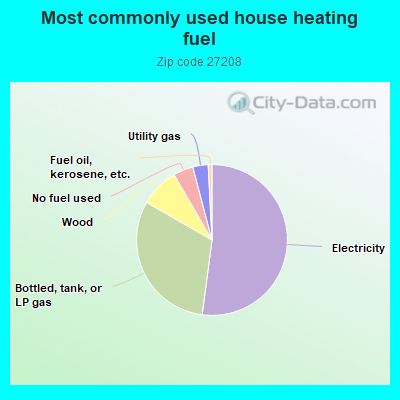
52.4%Electricity
31.4%Bottled, tank, or LP gas
8.4%Wood
4.3%No fuel used
3.3%Utility gas
0.8%Fuel oil, kerosene, etc.
Population in 1990: 1,218. Population change in the 1990s: +544 (+44.7%).
Place of birth for U.S.-born residents:
This state: 1,409
Northeast: 18
Midwest: 53
South: 91
West: 19
73% of the 27208 zip code residents lived in the same house 5 years ago. Out of people who lived in different houses, 37% lived in this county. Out of people who lived in different counties, 50% lived in North Carolina.
97% of the 27208 zip code residents lived in the same house 1 year ago. Out of people who lived in different houses, 33% moved from this county. Out of people who lived in different houses, 83% moved from different county within same state.
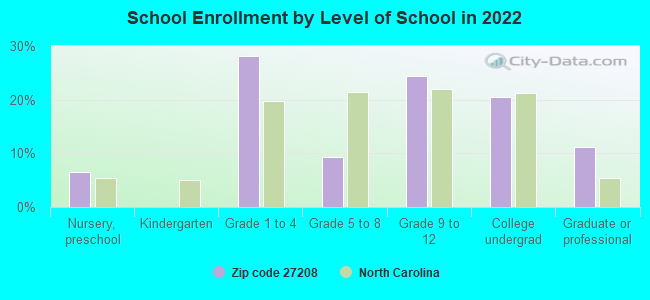
Private vs. public school enrollment:
Students in private schools in grades 1 to 8 (elementary and middle school):
Here:
0.0%
North Carolina:
13.8%
Students in private schools in grades 9 to 12 (high school):
Here:
0.0%
North Carolina:
11.9%
Students in private undergraduate colleges:
Here:
0.0%
North Carolina:
19.3%
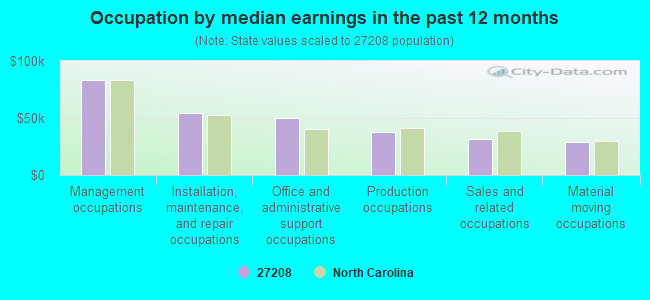
Occupation by median earnings in the past 12 months ($)
83,760Management occupations
54,229Installation, maintenance, and repair occupations
50,206Office and administrative support occupations
37,425Production occupations
31,901Sales and related occupations
28,838Material moving occupations
Top industries in this zip code by the number of employees in 2005:
Finance and Insurance: Commercial Banking (5-9 employees: 1 establishment)
Construction: Electrical Contractors (5-9: 1)
Other Services (except Public Administration): Religious Organizations (5-9: 1)
Accommodation and Food Services: Full-Service Restaurants (1-4: 1)
Construction: Commercial and Institutional Building Construction (1-4: 1)
Fatal accident statistics in 2014:
Fatal accident count: 2
Vehicles involved in fatal accidents: 4
Fatal accidents caused by drunken drivers: 0
Fatalities: 3
Persons involved in fatal accidents: 8
Pedestrians involved in fatal accidents: 0
Fatal accident statistics in 2012:
Fatal accident count: 1
Vehicles involved in fatal accidents: 1
Fatal accidents caused by drunken drivers: 1
Fatalities: 1
Persons involved in fatal accidents: 1
Pedestrians involved in fatal accidents: 0
Home Mortgage Disclosure Act Aggregated Statistics For Year 2009 (Based on 4 partial tracts)
A) FHA, FSA/RHS & VA Home Purchase Loans
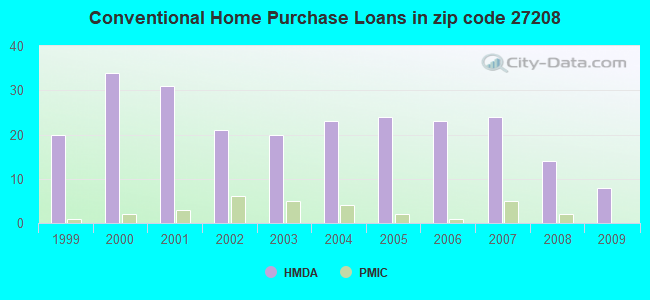
B) Conventional Home Purchase Loans
C) Refinancings
D) Home Improvement Loans
F) Non-occupant Loans on < 5 Family Dwellings (A B C & D)
G) Loans On Manufactured Home Dwelling (A B C & D)
Number
Average Value
Number
Average Value
Number
Average Value
Number
Average Value
Number
Average Value
Number
Average Value
LOANS ORIGINATED
7
$121,060
8
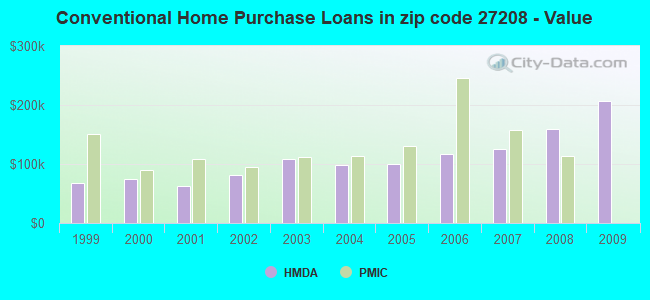
$207,136
41
$142,088
4
$68,115
3
$181,837
8
$76,808
APPLICATIONS APPROVED, NOT ACCEPTED
0
$0
0
$0
3
$105,403
0
$0
0
$0
1
$39,670
APPLICATIONS DENIED
1
$59,810
3
$124,893
22
$108,669
5
$17,750
2
$42,430
6
$68,532
APPLICATIONS WITHDRAWN
0
$0
2
$185,325
9
$128,112
1
$35,530
0
$0
1
$117,580
FILES CLOSED FOR INCOMPLETENESS
1
$94,000
0
$0
4
$153,552
1
$97,120
1
$103,040
1
$56,260
Aggregated Statistics For Year 2008 (Based on 4 partial tracts)
A) FHA, FSA/RHS & VA Home Purchase Loans
B) Conventional Home Purchase Loans
C) Refinancings
D) Home Improvement Loans
F) Non-occupant Loans on < 5 Family Dwellings (A B C & D)
G) Loans On Manufactured Home Dwelling (A B C & D)
Number
Average Value
Number
Average Value
Number
Average Value
Number
Average Value
Number
Average Value
Number
Average Value
LOANS ORIGINATED
5
$142,188
14
$159,832
40
$113,799
6
$31,187
7
$89,921
11
$79,089
APPLICATIONS APPROVED, NOT ACCEPTED
0
$0
3
$124,043
3
$97,910
0
$0
1
$155,830
2
$122,920
APPLICATIONS DENIED
0
$0
7
$98,743
24
$98,784
7
$43,314
2
$61,625
11
$73,171
APPLICATIONS WITHDRAWN
0
$0
3
$82,057
7
$102,366
0
$0
1
$53,850
2
$54,190
FILES CLOSED FOR INCOMPLETENESS
0
$0
0
$0
3
$141,467
0
$0
0
$0
0
$0
Aggregated Statistics For Year 2007 (Based on 4 partial tracts)
A) FHA, FSA/RHS & VA Home Purchase Loans
B) Conventional Home Purchase Loans
C) Refinancings
D) Home Improvement Loans
F) Non-occupant Loans on < 5 Family Dwellings (A B C & D)
G) Loans On Manufactured Home Dwelling (A B C & D)
Number
Average Value
Number
Average Value
Number
Average Value
Number
Average Value
Number
Average Value
Number
Average Value
LOANS ORIGINATED
5
$88,448
24
$124,768
38
$112,699
7
$39,004
7
$101,771
16
$78,928
APPLICATIONS APPROVED, NOT ACCEPTED
0
$0
3
$93,227
8
$84,262
1
$39,470
1
$72,250
3
$84,207
APPLICATIONS DENIED
0
$0
13
$83,739
29
$91,731
8
$56,584
1
$29,610
12
$66,416
APPLICATIONS WITHDRAWN
1
$110,740
2
$199,220
17
$111,298
3
$69,690
1
$46,820
3
$86,183
FILES CLOSED FOR INCOMPLETENESS
0
$0
2
$72,405
5
$87,658
0
$0
0
$0
0
$0
Aggregated Statistics For Year 2006 (Based on 4 partial tracts)
A) FHA, FSA/RHS & VA Home Purchase Loans
B) Conventional Home Purchase Loans
C) Refinancings
D) Home Improvement Loans
F) Non-occupant Loans on < 5 Family Dwellings (A B C & D)
G) Loans On Manufactured Home Dwelling (A B C & D)
Number
Average Value
Number
Average Value
Number
Average Value
Number
Average Value
Number
Average Value
Number
Average Value
LOANS ORIGINATED
5
$136,072
23
$117,744
35
$102,005
12
$46,366
9
$110,324
15
$72,155
APPLICATIONS APPROVED, NOT ACCEPTED
0
$0
5
$120,262
7
$90,324
1
$23,690
0
$0
2
$95,205
APPLICATIONS DENIED
1
$131,040
13
$102,365
42
$92,696
7
$33,650
1
$27,910
14
$69,341
APPLICATIONS WITHDRAWN
1
$136,880
3
$107,610
15
$105,523
1
$36,200
0
$0
6
$60,392
FILES CLOSED FOR INCOMPLETENESS
0
$0
0
$0
5
$95,470
0
$0
0
$0
0
$0
Aggregated Statistics For Year 2005 (Based on 4 partial tracts)
A) FHA, FSA/RHS & VA Home Purchase Loans
B) Conventional Home Purchase Loans
C) Refinancings
D) Home Improvement Loans
F) Non-occupant Loans on < 5 Family Dwellings (A B C & D)
G) Loans On Manufactured Home Dwelling (A B C & D)
Number
Average Value
Number
Average Value
Number
Average Value
Number
Average Value
Number
Average Value
Number
Average Value
LOANS ORIGINATED
2
$106,455
24
$100,634
52
$111,140
9
$26,482
6
$58,207
14
$76,774
APPLICATIONS APPROVED, NOT ACCEPTED
0
$0
6
$76,167
10
$87,406
2
$57,935
0
$0
4
$66,352
APPLICATIONS DENIED
1
$132,060
6
$73,707
47
$92,710
7
$30,704
1
$99,090
16
$74,932
APPLICATIONS WITHDRAWN
0
$0
2
$104,310
19
$135,724
2
$102,855
1
$30,790
0
$0
FILES CLOSED FOR INCOMPLETENESS
0
$0
0
$0
4
$90,430
0
$0
0
$0
2
$65,440
Aggregated Statistics For Year 2004 (Based on 4 partial tracts)
A) FHA, FSA/RHS & VA Home Purchase Loans
B) Conventional Home Purchase Loans
C) Refinancings
D) Home Improvement Loans
F) Non-occupant Loans on < 5 Family Dwellings (A B C & D)
G) Loans On Manufactured Home Dwelling (A B C & D)
Number
Average Value
Number
Average Value
Number
Average Value
Number
Average Value
Number
Average Value
Number
Average Value
LOANS ORIGINATED
3
$114,140
23
$97,741
58
$102,251
12
$33,440
3
$18,380
16
$58,962
APPLICATIONS APPROVED, NOT ACCEPTED
0
$0
2
$91,815
11
$84,649
1
$6,510
0
$0
2
$45,325
APPLICATIONS DENIED
0
$0
11
$89,329
45
$77,877
7
$32,999
2
$56,905
15
$55,485
APPLICATIONS WITHDRAWN
0
$0
1
$116,870
25
$98,179
1
$79,510
0
$0
3
$79,653
FILES CLOSED FOR INCOMPLETENESS
0
$0
0
$0
4
$114,825
0
$0
0
$0
0
$0
Aggregated Statistics For Year 2003 (Based on 4 partial tracts)
A) FHA, FSA/RHS & VA Home Purchase Loans
B) Conventional Home Purchase Loans
C) Refinancings
D) Home Improvement Loans
F) Non-occupant Loans on < 5 Family Dwellings (A B C & D)
Number
Average Value
Number
Average Value
Number
Average Value
Number
Average Value
Number
Average Value
LOANS ORIGINATED
3
$83,257
20
$108,417
116
$106,598
7
$26,264
3
$51,407
APPLICATIONS APPROVED, NOT ACCEPTED
0
$0
6
$114,912
20
$92,434
1
$51,820
2
$57,185
APPLICATIONS DENIED
1
$62,900
15
$77,573
50
$88,003
9
$17,863
2
$38,020
APPLICATIONS WITHDRAWN
0
$0
3
$116,613
30
$100,130
1
$20,730
2
$62,465
FILES CLOSED FOR INCOMPLETENESS
0
$0
1
$198,980
2
$107,580
0
$0
0
$0
Aggregated Statistics For Year 2002 (Based on 4 partial tracts)
A) FHA, FSA/RHS & VA Home Purchase Loans
B) Conventional Home Purchase Loans
C) Refinancings
D) Home Improvement Loans
F) Non-occupant Loans on < 5 Family Dwellings (A B C & D)
Number
Average Value
Number
Average Value
Number
Average Value
Number
Average Value
Number
Average Value
LOANS ORIGINATED
3
$75,953
21
$81,319
68
$96,699
6
$7,868
4
$72,088
APPLICATIONS APPROVED, NOT ACCEPTED
1
$69,290
12
$50,081
13
$80,615
0
$0
2
$19,830
APPLICATIONS DENIED
2
$83,335
14
$50,109
34
$76,716
3
$11,380
0
$0
APPLICATIONS WITHDRAWN
1
$68,700
3
$85,753
12
$77,874
2
$15,695
0
$0
FILES CLOSED FOR INCOMPLETENESS
1
$56,850
1
$43,600
3
$114,793
0
$0
0
$0
Aggregated Statistics For Year 2001 (Based on 4 partial tracts)
A) FHA, FSA/RHS & VA Home Purchase Loans
B) Conventional Home Purchase Loans
C) Refinancings
D) Home Improvement Loans
F) Non-occupant Loans on < 5 Family Dwellings (A B C & D)
Number
Average Value
Number
Average Value
Number
Average Value
Number
Average Value
Number
Average Value
LOANS ORIGINATED
5
$84,178
31
$63,271
65
$88,932
10
$14,969
6
$72,508
APPLICATIONS APPROVED, NOT ACCEPTED
0
$0
12
$48,205
11
$67,341
1
$30,270
0
$0
APPLICATIONS DENIED
1
$61,590
22
$55,587
19
$95,393
3
$6,820
1
$32,570
APPLICATIONS WITHDRAWN
0
$0
3
$77,503
11
$80,376
2
$20,005
1
$5,330
FILES CLOSED FOR INCOMPLETENESS
0
$0
1
$76,990
3
$82,810
0
$0
0
$0
Aggregated Statistics For Year 2000 (Based on 4 partial tracts)
A) FHA, FSA/RHS & VA Home Purchase Loans
B) Conventional Home Purchase Loans
C) Refinancings
D) Home Improvement Loans
F) Non-occupant Loans on < 5 Family Dwellings (A B C & D)
Number
Average Value
Number
Average Value
Number
Average Value
Number
Average Value
Number
Average Value
LOANS ORIGINATED
3
$77,973
34
$73,895
31
$79,477
6
$18,837
6
$34,995
APPLICATIONS APPROVED, NOT ACCEPTED
2
$52,925
13
$51,978
8
$74,438
1
$17,020
1
$10,660
APPLICATIONS DENIED
1
$40,370
40
$50,366
29
$77,658
2
$26,420
1
$18,180
APPLICATIONS WITHDRAWN
1
$36,120
4
$82,745
11
$70,304
1
$17,200
0
$0
FILES CLOSED FOR INCOMPLETENESS
0
$0
1
$48,560
3
$132,120
0
$0
0
$0
Aggregated Statistics For Year 1999 (Based on 2 partial tracts)
A) FHA, FSA/RHS & VA Home Purchase Loans
B) Conventional Home Purchase Loans
C) Refinancings
D) Home Improvement Loans
F) Non-occupant Loans on < 5 Family Dwellings (A B C & D)
Detailed PMIC statistics for the following Tracts:0205.00
, 0309.00
2005 - 2018 National Fire Incident Reporting System (NFIRS) incidents
Based on the data from the years 2005 - 2018 the average number of fire incidents per year is 16. The highest number of fire incidents - 25 took place in 2014, and the least - 2 in 2006. The data has a growing trend.
When looking into fire subcategories, the most reports belonged to: Structure Fires (53.5%), and Other (21.2%).
Fire incident types reported to NFIRS in Zip Code 27208


+$47
-$3,231
(% of AGI for various income ranges: 0.0% for AGIs below $10k, 3.6% for AGIs $10k-25k, 1.7% for AGIs $25k-50k, -2.7% for AGIs $50k-75k, -1.1% for AGIs $75k-100k) Nearest zip codes: 27325, 27316, 27207, 27341, 27344, 27252.


 Based on the data from the years 2005 - 2018 the average number of fire incidents per year is 16. The highest number of fire incidents - 25 took place in 2014, and the least - 2 in 2006. The data has a growing trend.
 When looking into fire subcategories, the most reports belonged to: Structure Fires (53.5%), and Other (21.2%).