Estimated zip code population in 2022: 1,517 Zip code population in 2010: 2,003 Zip code population in 2000: 1,475
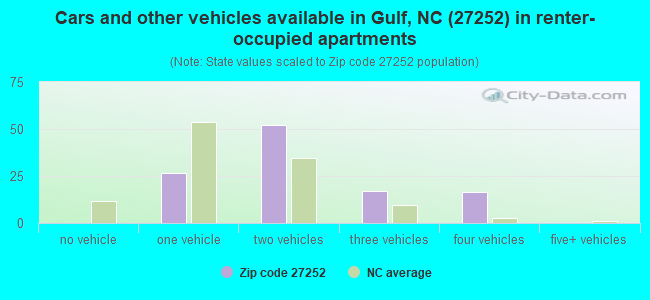
Houses and condos: 839 Renter-occupied apartments: 110
% of renters here:
16%
State:
33%
March 2022 cost of living index in zip code 27252: 82.4 (low, U.S. average is 100)
Land area: 42.8 sq. mi. Water area: 0.1 sq. mi.
Population density: 35 people per square mile
(very low).
OSM Map
General Map
Google Map
MSN Map
OSM Map
General Map
Google Map
MSN Map
OSM Map
General Map
Google Map
MSN Map
OSM Map
General Map
Google Map
MSN Map
Please wait while loading the map...
Real estate property taxes paid for housing units in 2022:
This zip code:
0.6% ($1,186)
North Carolina:
0.6% ($1,769)
Median real estate property taxes paid for housing units with mortgages in 2022: $1,150 (0.6%) Median real estate property taxes paid for housing units with no mortgage in 2022: $1,241 (1.0%)
Business Search- 14 Million verified businesses
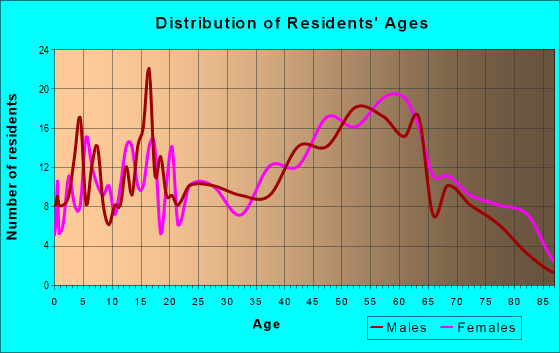
Males: 702
(46.3%)
Females: 815
(53.7%)
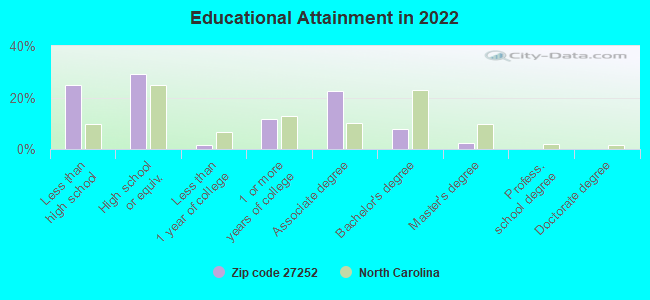
For population 25 years and over in 27252:
High school or higher: 72.9%
Bachelor's degree or higher: 9.8%
Graduate or professional degree: 2.2%
Mean travel time to work (commute): 32.2 minutes
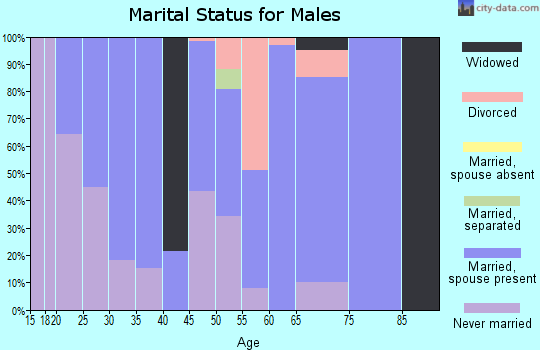
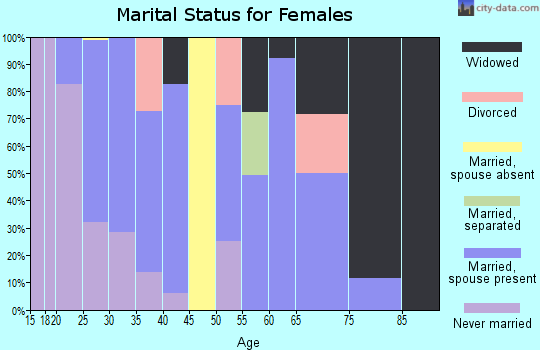
For population 15 years and over in 27252:
Never married: 14.9%
Now married: 46.9%
Separated: 0.2%
Widowed: 18.7%
Divorced: 19.4%
Zip code 27252 compared to state average:
Median household income below state average.
Unemployed percentage significantly below state average.
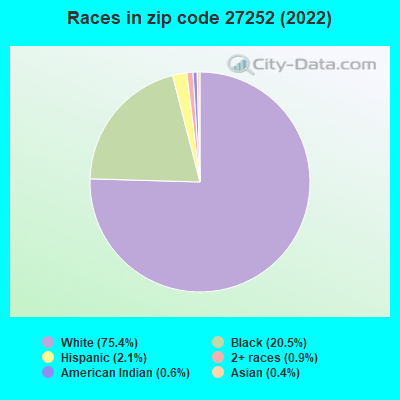
Hispanic race population percentage significantly below state average.
Median age above state average.
Foreign-born population percentage significantly below state average.
Renting percentage below state average.
Length of stay since moving in significantly above state average.
House age above state average.
Number of college students significantly below state average.
Percentage of population with a bachelor's degree or higher significantly below state average.
Averages for the 2020 tax year for zip code 27252, filed in 2021:
Average Adjusted Gross Income (AGI) in 2020: $55,825 (Individual Income Tax Returns)
Here:
$55,825
State:
$70,020
Salary/wage: $46,067 (reported on 82.7% of returns)
Here:
$46,067
State:
$58,387
(% of AGI for various income ranges: 1057.1% for AGIs below $25k, 3782.7% for AGIs $25k-50k, 6393.8% for AGIs $50k-75k, 8833.3% for AGIs $75k-100k, 31390.0% for AGIs $100k-200k)
Taxable interest for individuals: $1,136 (reported on 30.9% of returns)
This zip code:
$1,136
North Carolina:
$1,479
(% of AGI for various income ranges: 9.5% for AGIs below $25k, 40.0% for AGIs $25k-50k, 17.5% for AGIs $50k-75k, 96.7% for AGIs $75k-100k, 330.0% for AGIs $100k-200k)
Ordinary dividends: $3,282 (reported on 13.6% of returns)
Here:
$3,282
State:
$7,888
(% of AGI for various income ranges: 19.5% for AGIs below $25k, 50.0% for AGIs $50k-75k, 700.0% for AGIs $100k-200k)
Net capital gain/loss in AGI: +$8,550 (reported on 14.8% of returns)
Here:
+$8,550
State:
+$23,652
(% of AGI for various income ranges: 24.3% for AGIs below $25k, 223.7% for AGIs $50k-75k, 1990.0% for AGIs $100k-200k)
Profit/loss from business: +$4,753 (reported on 18.5% of returns)
Here:
+$4,753
State:
+$11,710
(% of AGI for various income ranges: 186.7% for AGIs below $25k, 165.3% for AGIs $25k-50k, 43.8% for AGIs $50k-75k, 95.0% for AGIs $100k-200k)
Taxable individual retirement arrangement distribution: $11,275 (reported on 9.9% of returns)
27252:
$11,275
North Carolina:
$20,247
(% of AGI for various income ranges: 76.2% for AGIs below $25k, 310.0% for AGIs $50k-75k, 1235.0% for AGIs $100k-200k)
Total itemized deductions: $29,600 (reported on 4.9% of returns)
Here:
$29,600
State:
$34,549
(% of AGI for various income ranges: 2960.0% for AGIs $100k-200k)
Charity contributions: $9,633 (reported on 3.7% of returns)
Here:
$9,633
State:
$13,360
(% of AGI for various income ranges: 481.7% for AGIs $75k-100k)
Taxes paid: $6,525 (reported on 4.9% of returns)
27252:
$6,525
State:
$7,586
(% of AGI for various income ranges: 652.5% for AGIs $100k-200k)
Earned income credit: $2,129 (reported on 17.3% of returns)
Here:
$2,129
State:
$2,337
(% of AGI for various income ranges: 91.4% for AGIs below $25k, 70.7% for AGIs $25k-50k)
Percentage of individuals using paid preparers for their 2020 taxes: 91.4%
Here:
91%
State:
93%
(% for various income ranges: 89.7% for AGIs below $25k, 90.5% for AGIs $25k-50k, 90.9% for AGIs $50k-75k, 87.5% for AGIs $75k-100k, 100.0% for AGIs $100k-200k, 100.0% for AGIs over 200k)
Averages for the 2012 tax year for zip code 27252, filed in 2013:
Average Adjusted Gross Income (AGI) in 2012: $43,599 (Individual Income Tax Returns)
Here:
$43,599
State:
$54,937
Salary/wage: $37,369 (reported on 81.6% of returns)
Here:
$37,369
State:
$46,336
(% of AGI for various income ranges: 71.2% for AGIs below $25k, 86.2% for AGIs $25k-50k, 76.6% for AGIs $50k-75k, 70.8% for AGIs $75k-100k, 54.7% for AGIs $100k-200k)
Taxable interest for individuals: $870 (reported on 30.3% of returns)
This zip code:
$870
North Carolina:
$1,298
(% of AGI for various income ranges: 1.7% for AGIs below $25k, 0.6% for AGIs $25k-50k, 0.7% for AGIs $50k-75k, 0.3% for AGIs $75k-100k, 0.3% for AGIs $100k-200k)
Ordinary dividends: $1,311 (reported on 11.8% of returns)
Here:
$1,311
State:
$6,213
(% of AGI for various income ranges: 1.0% for AGIs below $25k, 1.3% for AGIs $75k-100k)
Net capital gain/loss in AGI: +$1,956 (reported on 11.8% of returns)
Here:
+$1,956
State:
+$12,740
(% of AGI for various income ranges: 0.1% for AGIs $50k-75k, 1.8% for AGIs $100k-200k)
Profit/loss from business: +$5,386 (reported on 18.4% of returns)
Here:
+$5,386
State:
+$10,311
(% of AGI for various income ranges: 8.6% for AGIs below $25k, 5.2% for AGIs $25k-50k, 1.1% for AGIs $75k-100k)
Taxable individual retirement arrangement distribution: $7,283 (reported on 7.9% of returns)
27252:
$7,283
North Carolina:
$15,575
Total itemized deductions: $18,686 (24% of AGI, reported on 28.9% of returns)
Here:
$18,686
State:
$23,438
Here:
23.8% of AGI
State:
21.5% of AGI
(% of AGI for various income ranges: 9.5% for AGIs below $25k, 9.8% for AGIs $25k-50k, 14.1% for AGIs $50k-75k, 13.3% for AGIs $75k-100k, 13.7% for AGIs $100k-200k)
Charity contributions: $4,884 (reported on 25.0% of returns)
Here:
$4,884
State:
$4,687
(% of AGI for various income ranges: 1.5% for AGIs below $25k, 1.1% for AGIs $25k-50k, 2.9% for AGIs $50k-75k, 3.8% for AGIs $75k-100k, 3.8% for AGIs $100k-200k)
Taxes paid: $5,977 (reported on 28.9% of returns)
27252:
$5,977
State:
$8,823
(% of AGI for various income ranges: 1.8% for AGIs below $25k, 2.5% for AGIs $25k-50k, 3.7% for AGIs $50k-75k, 4.6% for AGIs $75k-100k, 5.5% for AGIs $100k-200k)
Earned income credit: $2,127 (reported on 19.7% of returns)
Here:
$2,127
State:
$2,376
(% of AGI for various income ranges: 5.4% for AGIs below $25k, 1.5% for AGIs $25k-50k)
Percentage of individuals using paid preparers for their 2012 taxes: 65.8%
Here:
66%
State:
53%
(% for various income ranges: 63.6% for AGIs below $25k, 60.0% for AGIs $25k-50k, 70.0% for AGIs $50k-75k, 83.3% for AGIs $75k-100k, 71.4% for AGIs $100k-200k)
Averages for the 2004 tax year for zip code 27252, filed in 2005:
Average Adjusted Gross Income (AGI) in 2004: $36,066 (Individual Income Tax Returns)
Here:
$36,066
State:
$45,376
Salary/wage: $33,829 (reported on 85.5% of returns)
Here:
$33,829
State:
$39,442
(% of AGI for various income ranges: 96.5% for AGIs below $10k, 81.8% for AGIs $10k-25k, 84.1% for AGIs $25k-50k, 82.0% for AGIs $50k-75k, 83.2% for AGIs $75k-100k, 64.9% for AGIs over 100k)
Taxable interest for individuals: $1,183 (reported on 39.7% of returns)
This zip code:
$1,183
North Carolina:
$1,515
(% of AGI for various income ranges: 7.7% for AGIs below $10k, 1.5% for AGIs $10k-25k, 1.1% for AGIs $25k-50k, 1.3% for AGIs $50k-75k, 1.0% for AGIs $75k-100k, 1.0% for AGIs over 100k)
Taxable dividends: $2,016 (reported on 16.2% of returns)
Here:
$2,016
State:
$4,016
(% of AGI for various income ranges: 4.0% for AGIs below $10k, 0.5% for AGIs $10k-25k, 0.5% for AGIs $25k-50k, 1.5% for AGIs $50k-75k, 0.4% for AGIs $75k-100k, 1.2% for AGIs over 100k)
Net capital gain/loss: +$5,656 (reported on 11.9% of returns)
Here:
+$5,656
State:
+$11,152
(% of AGI for various income ranges: 1.9% for AGIs below $10k, 0.5% for AGIs $10k-25k, 2.2% for AGIs $25k-50k, 0.1% for AGIs $50k-75k, 1.1% for AGIs $75k-100k, 5.6% for AGIs over 100k)
Profit/loss from business: +$8,414 (reported on 14.6% of returns)
Here:
+$8,414
State:
+$9,490
(% of AGI for various income ranges: 20.0% for AGIs below $10k, 5.3% for AGIs $10k-25k, 3.0% for AGIs $25k-50k, 6.2% for AGIs $50k-75k)
Total itemized deductions: $16,371 (28% of AGI, reported on 34.1% of returns)
Here:
$16,371
State:
$19,464
Here:
27.7% of AGI
State:
22.7% of AGI
(% of AGI for various income ranges: 12.7% for AGIs $10k-25k, 15.3% for AGIs $25k-50k, 16.8% for AGIs $50k-75k, 18.8% for AGIs $75k-100k, 15.1% for AGIs over 100k)
Charity contributions deductions: $3,866 (6% of AGI, reported on 30.6% of returns)
Here:
$3,866
State:
$4,035
Here:
6.5% of AGI
State:
4.5% of AGI
(% of AGI for various income ranges: 1.9% for AGIs $10k-25k, 3.1% for AGIs $25k-50k, 3.7% for AGIs $50k-75k, 4.2% for AGIs $75k-100k, 3.8% for AGIs over 100k)
Total tax: $3,954 (reported on 74.6% of returns)
27252:
$3,954
State:
$7,257
(% of AGI for various income ranges: 4.2% for AGIs below $10k, 4.1% for AGIs $10k-25k, 5.8% for AGIs $25k-50k, 8.6% for AGIs $50k-75k, 9.5% for AGIs $75k-100k, 14.5% for AGIs over 100k)
Earned income credit: $1,739 (reported on 17.7% of returns)
Here:
$1,739
State:
$1,851
Percentage of individuals using paid preparers for their 2004 taxes: 69.4%
Here:
69%
State:
62%
(% for various income ranges: 71.8% for AGIs below $10k, 68.5% for AGIs $10k-25k, 65.4% for AGIs $25k-50k, 73.8% for AGIs $50k-75k, 76.1% for AGIs $75k-100k, 70.6% for AGIs over 100k)
Household received Food Stamps/SNAP in the past 12 months: 124 Household did not receive Food Stamps/SNAP in the past 12 months: 575
Women who had a birth in the past 12 months: 30 (28 now married, 1 unmarried) Women who did not have a birth in the past 12 months: 191 (101 now married, 90 unmarried)
Housing units in zip code 27252 with a mortgage: 415 (27 second mortgage, 29 both second mortgage and home equity loan) Median monthly owner costs for units with a mortgage: $883 Median monthly owner costs for units without a mortgage: $427
Residents with income below the poverty level in 2022:
This zip code:
10.1%
Whole state:
12.8%
Residents with income below 50% of the poverty level in 2022:
This zip code:
7.5%
Whole state:
6.8%
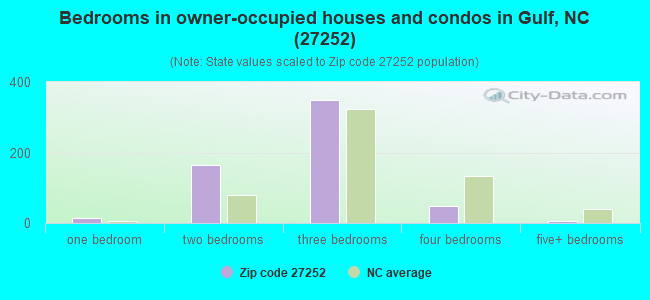
Median number of rooms in houses and condos:
Here:
5.5
State:
6.4
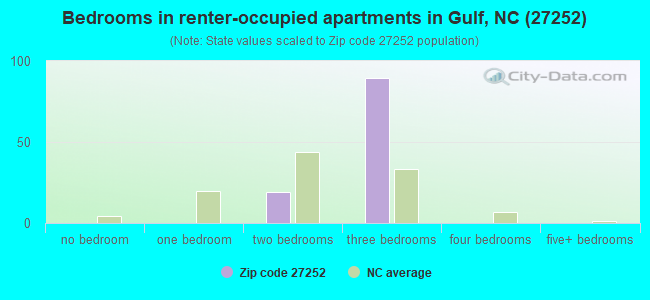
Median number of rooms in apartments:
Here:
4.3
State:
4.4
Notable locations in this zip code not listed on our city pages
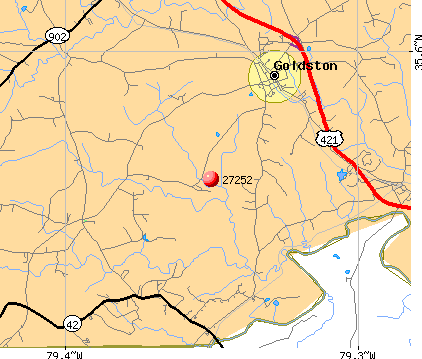
Churches in zip code 27252 include: Antioch Church (A), Thompsons Chapel (B), Bethany Church (C), Mount Herman Church (D), Carbonton Church (E), Roberts Chapel (F), Saint Lukes Church (G), Friendly Tabernacle (H), Gaines Grove Church (I). Display/hide their locations on the map
In group quarters: 9 (-1 institutionalized population)
Size of family households: 176 2-persons, 117 3-persons, 75 4-persons, 21 5-persons, 4 6-persons
Size of nonfamily households: 299 1-person
220 married couples with children.
69 single-parent households (5 men, 64 women).
96.2% of residents of 27252 zip code speak English at home.
3.7% of residents speak Spanish at home (100% very well).
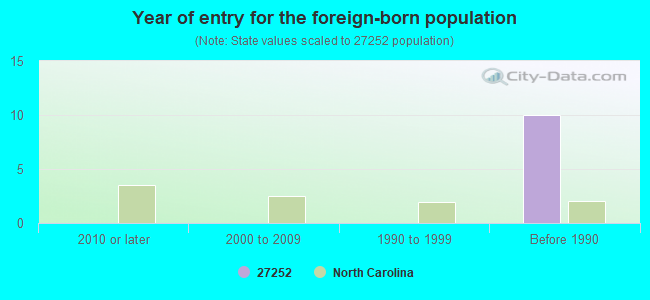
Foreign born population: 1 (0.1%) (0.0% of them are naturalized citizens)
:
0.1%
Whole state:
8.6%
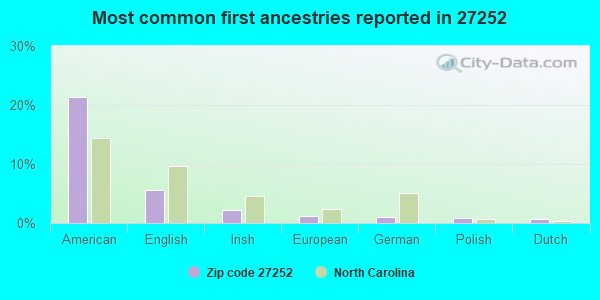
21%American
6%English
2%Irish
1%European
1%German
1%Polish
1%Dutch
Year of entry for the foreign-born population
02010 or later
02000 to 2009
01990 to 1999
10Before 1990
Facilities with environmental interests located in this zip code:
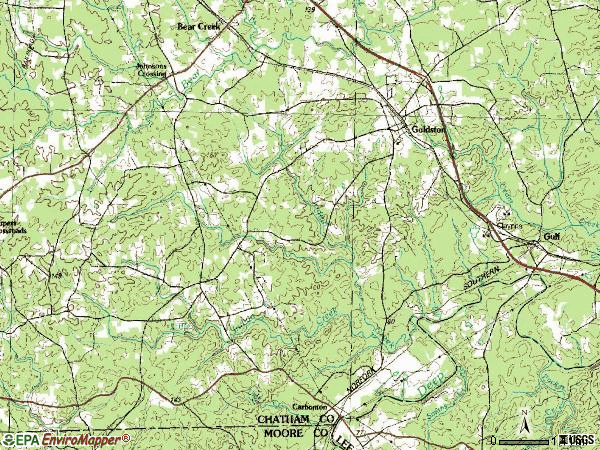
DEAN BROOKS FARM COMPOSTING FA (1195 BEAL ROAD in GOLDSTON, NC)
STATE MASTER (North Carolina facility info) - -115DA4YG00TE2D64FBEQR6H4S8, WASTEWATER FACILITY National Pollutant Discharge Elimination System NON-MAJOR (Tracking pollutant discharge elimination systems) - permit Business SIC classification: FERTILIZERS, MIXING ONLY
Housing units lacking complete plumbing facilities: 9.2% Housing units lacking complete kitchen facilities: 8.6%
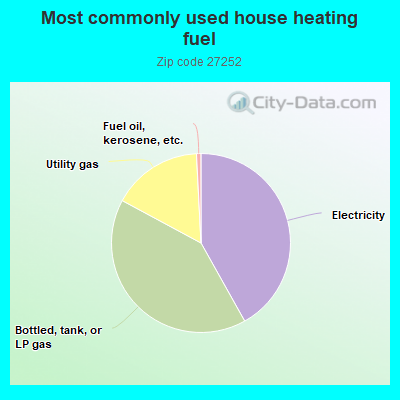
41.8%Electricity
40.9%Bottled, tank, or LP gas
16.3%Utility gas
0.8%Fuel oil, kerosene, etc.
Population in 1990: 1,814.
Place of birth for U.S.-born residents:
This state: 1,225
Northeast: 60
Midwest: 46
South: 95
West: 57
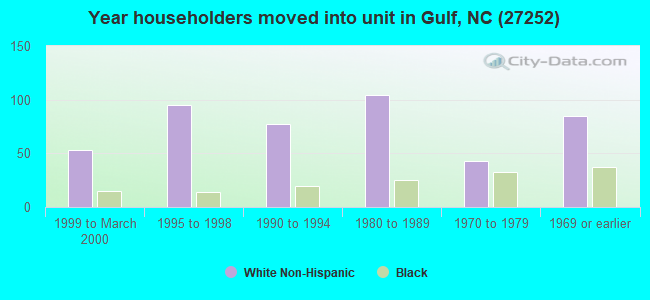
74% of the 27252 zip code residents lived in the same house 5 years ago. Out of people who lived in different houses, 64% lived in this county. Out of people who lived in different counties, 50% lived in North Carolina.
83% of the 27252 zip code residents lived in the same house 1 year ago. Out of people who lived in different houses, 10% moved from this county. Out of people who lived in different houses, 81% moved from different county within same state. Out of people who lived in different houses, 10% moved from different state.
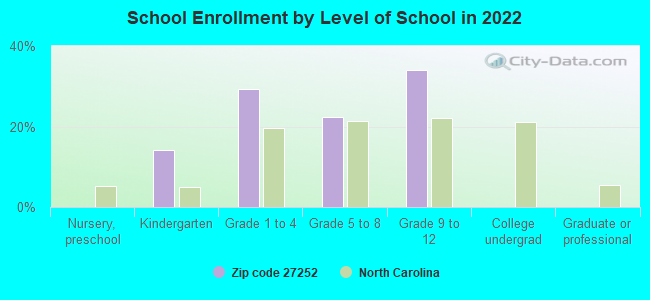
Private vs. public school enrollment:
Students in private schools in grades 1 to 8 (elementary and middle school): 37
Here:
36.3%
North Carolina:
13.8%
Students in private schools in grades 9 to 12 (high school):
Here:
0.0%
North Carolina:
11.9%
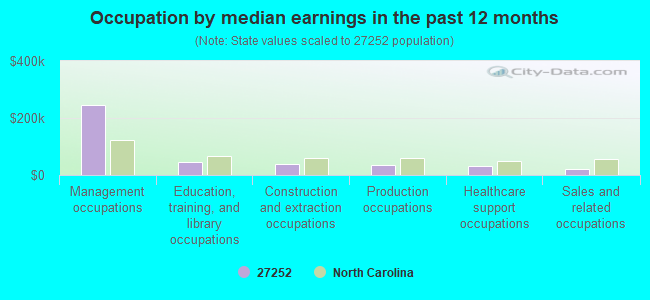
Occupation by median earnings in the past 12 months ($)
244,884Management occupations
45,176Education, training, and library occupations
37,560Construction and extraction occupations
36,083Production occupations
32,778Healthcare support occupations
21,028Sales and related occupations
Top industries in this zip code by the number of employees in 2005:
Wholesale Trade: Construction and Mining (except Oil Well) Machinery and Equipment Merchant Wholesalers (10-19 employees: 1 establishment)
Health Care and Social Assistance: Homes for the Elderly (10-19: 1)
Construction: Plumbing, Heating, and Air-Conditioning Contractors (10-19: 1)
Construction: Electrical Contractors (5-9: 1)
Wholesale Trade: Industrial Machinery and Equipment Merchant Wholesalers (5-9: 1)
Fatal accident statistics in 2013:
Fatal accident count: 1
Vehicles involved in fatal accidents: 1
Fatal accidents caused by drunken drivers: 0
Fatalities: 1
Persons involved in fatal accidents: 1
Pedestrians involved in fatal accidents: 1
Fatal accident statistics in 2012:
Fatal accident count: 1
Vehicles involved in fatal accidents: 1
Fatal accidents caused by drunken drivers: 0
Fatalities: 1
Persons involved in fatal accidents: 1
Pedestrians involved in fatal accidents: 0
Home Mortgage Disclosure Act Aggregated Statistics For Year 2009 (Based on 2 partial tracts)
A) FHA, FSA/RHS & VA Home Purchase Loans
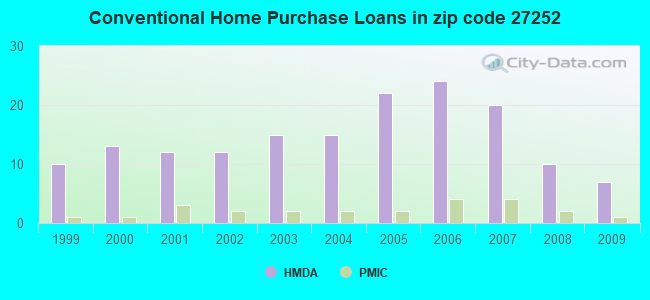
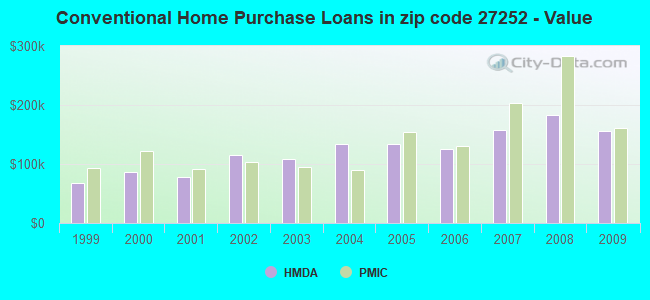
B) Conventional Home Purchase Loans
C) Refinancings
D) Home Improvement Loans
F) Non-occupant Loans on < 5 Family Dwellings (A B C & D)
G) Loans On Manufactured Home Dwelling (A B C & D)
Number
Average Value
Number
Average Value
Number
Average Value
Number
Average Value
Number
Average Value
Number
Average Value
LOANS ORIGINATED
2
$129,125
7
$156,530
36
$157,891
1
$61,030
1
$88,440
5
$77,726
APPLICATIONS APPROVED, NOT ACCEPTED
0
$0
0
$0
5
$193,650
1
$110,030
0
$0
0
$0
APPLICATIONS DENIED
2
$120,615
3
$38,753
17
$131,862
2
$44,840
2
$47,335
8
$73,335
APPLICATIONS WITHDRAWN
1
$113,760
2
$150,925
11
$176,913
2
$74,735
0
$0
2
$84,495
FILES CLOSED FOR INCOMPLETENESS
1
$140,750
0
$0
5
$161,844
0
$0
1
$88,020
1
$95,910
Aggregated Statistics For Year 2008 (Based on 2 partial tracts)
A) FHA, FSA/RHS & VA Home Purchase Loans
B) Conventional Home Purchase Loans
C) Refinancings
D) Home Improvement Loans
F) Non-occupant Loans on < 5 Family Dwellings (A B C & D)
G) Loans On Manufactured Home Dwelling (A B C & D)
Number
Average Value
Number
Average Value
Number
Average Value
Number
Average Value
Number
Average Value
Number
Average Value
LOANS ORIGINATED
4
$144,385
10
$183,768
33
$143,345
2
$52,110
3
$84,147
4
$100,998
APPLICATIONS APPROVED, NOT ACCEPTED
0
$0
1
$40,270
4
$167,015
0
$0
0
$0
1
$61,030
APPLICATIONS DENIED
1
$74,740
3
$89,683
19
$142,611
7
$71,533
0
$0
7
$91,107
APPLICATIONS WITHDRAWN
0
$0
2
$371,605
8
$141,116
1
$164,000
1
$47,750
1
$87,190
FILES CLOSED FOR INCOMPLETENESS
0
$0
2
$134,315
1
$215,490
0
$0
0
$0
0
$0
Aggregated Statistics For Year 2007 (Based on 2 partial tracts)
A) FHA, FSA/RHS & VA Home Purchase Loans
B) Conventional Home Purchase Loans
C) Refinancings
D) Home Improvement Loans
F) Non-occupant Loans on < 5 Family Dwellings (A B C & D)
G) Loans On Manufactured Home Dwelling (A B C & D)
Number
Average Value
Number
Average Value
Number
Average Value
Number
Average Value
Number
Average Value
Number
Average Value
LOANS ORIGINATED
4
$122,070
20
$157,174
31
$130,507
6
$56,328
5
$88,272
9
$86,361
APPLICATIONS APPROVED, NOT ACCEPTED
0
$0
3
$91,760
10
$116,547
1
$75,570
1
$39,440
1
$68,090
APPLICATIONS DENIED
0
$0
9
$97,249
24
$133,504
7
$47,986
2
$73,905
7
$63,644
APPLICATIONS WITHDRAWN
0
$0
2
$190,990
12
$136,393
0
$0
1
$131,200
0
$0
FILES CLOSED FOR INCOMPLETENESS
0
$0
1
$102,550
2
$224,210
0
$0
0
$0
0
$0
Aggregated Statistics For Year 2006 (Based on 2 partial tracts)
A) FHA, FSA/RHS & VA Home Purchase Loans
B) Conventional Home Purchase Loans
C) Refinancings
D) Home Improvement Loans
F) Non-occupant Loans on < 5 Family Dwellings (A B C & D)
G) Loans On Manufactured Home Dwelling (A B C & D)
Number
Average Value
Number
Average Value
Number
Average Value
Number
Average Value
Number
Average Value
Number
Average Value
LOANS ORIGINATED
2
$140,340
24
$125,373
34
$128,969
2
$42,560
7
$80,667
11
$84,852
APPLICATIONS APPROVED, NOT ACCEPTED
0
$0
4
$80,030
7
$110,680
0
$0
0
$0
2
$44,425
APPLICATIONS DENIED
0
$0
6
$118,955
21
$111,966
7
$24,260
2
$57,715
6
$77,297
APPLICATIONS WITHDRAWN
0
$0
2
$131,410
9
$109,659
0
$0
1
$114,600
0
$0
FILES CLOSED FOR INCOMPLETENESS
0
$0
1
$193,070
3
$136,877
0
$0
0
$0
0
$0
Aggregated Statistics For Year 2005 (Based on 2 partial tracts)
A) FHA, FSA/RHS & VA Home Purchase Loans
B) Conventional Home Purchase Loans
C) Refinancings
D) Home Improvement Loans
F) Non-occupant Loans on < 5 Family Dwellings (A B C & D)
G) Loans On Manufactured Home Dwelling (A B C & D)
Number
Average Value
Number
Average Value
Number
Average Value
Number
Average Value
Number
Average Value
Number
Average Value
LOANS ORIGINATED
3
$103,660
22
$134,355
36
$116,925
5
$45,588
5
$45,256
11
$80,813
APPLICATIONS APPROVED, NOT ACCEPTED
0
$0
5
$114,096
8
$129,075
1
$25,330
0
$0
3
$96,463
APPLICATIONS DENIED
0
$0
6
$71,622
29
$109,069
4
$41,520
0
$0
9
$82,856
APPLICATIONS WITHDRAWN
0
$0
3
$122,623
11
$111,463
3
$164,697
1
$97,570
2
$88,645
FILES CLOSED FOR INCOMPLETENESS
0
$0
1
$121,650
5
$151,964
0
$0
0
$0
1
$159,020
Aggregated Statistics For Year 2004 (Based on 2 partial tracts)
A) FHA, FSA/RHS & VA Home Purchase Loans
B) Conventional Home Purchase Loans
C) Refinancings
D) Home Improvement Loans
F) Non-occupant Loans on < 5 Family Dwellings (A B C & D)
G) Loans On Manufactured Home Dwelling (A B C & D)
Number
Average Value
Number
Average Value
Number
Average Value
Number
Average Value
Number
Average Value
Number
Average Value
LOANS ORIGINATED
4
$122,900
15
$134,359
38
$119,130
5
$55,470
6
$59,443
9
$69,708
APPLICATIONS APPROVED, NOT ACCEPTED
0
$0
5
$73,408
7
$77,287
0
$0
0
$0
7
$51,189
APPLICATIONS DENIED
0
$0
8
$72,971
26
$100,590
5
$38,862
0
$0
10
$70,501
APPLICATIONS WITHDRAWN
0
$0
3
$92,727
11
$108,783
1
$145,320
1
$63,940
3
$88,437
FILES CLOSED FOR INCOMPLETENESS
0
$0
1
$249,950
2
$135,150
0
$0
0
$0
0
$0
Aggregated Statistics For Year 2003 (Based on 2 partial tracts)
A) FHA, FSA/RHS & VA Home Purchase Loans
B) Conventional Home Purchase Loans
C) Refinancings
D) Home Improvement Loans
F) Non-occupant Loans on < 5 Family Dwellings (A B C & D)
Number
Average Value
Number
Average Value
Number
Average Value
Number
Average Value
Number
Average Value
LOANS ORIGINATED
3
$104,630
15
$108,035
73
$111,444
2
$11,005
3
$65,880
APPLICATIONS APPROVED, NOT ACCEPTED
0
$0
7
$98,224
7
$127,347
0
$0
1
$115,010
APPLICATIONS DENIED
3
$66,433
32
$46,827
33
$122,283
2
$29,685
1
$56,050
APPLICATIONS WITHDRAWN
0
$0
1
$98,400
13
$124,177
0
$0
0
$0
FILES CLOSED FOR INCOMPLETENESS
0
$0
0
$0
2
$135,565
0
$0
0
$0
Aggregated Statistics For Year 2002 (Based on 2 partial tracts)
A) FHA, FSA/RHS & VA Home Purchase Loans
B) Conventional Home Purchase Loans
C) Refinancings
D) Home Improvement Loans
F) Non-occupant Loans on < 5 Family Dwellings (A B C & D)
Number
Average Value
Number
Average Value
Number
Average Value
Number
Average Value
Number
Average Value
LOANS ORIGINATED
3
$96,603
12
$115,460
29
$121,740
4
$19,100
2
$62,905
APPLICATIONS APPROVED, NOT ACCEPTED
1
$68,090
14
$43,596
6
$97,018
1
$20,760
1
$35,290
APPLICATIONS DENIED
0
$0
21
$42,548
17
$90,245
4
$17,128
1
$31,140
APPLICATIONS WITHDRAWN
0
$0
2
$114,805
15
$99,205
2
$8,305
0
$0
FILES CLOSED FOR INCOMPLETENESS
0
$0
1
$160,270
2
$127,050
0
$0
0
$0
Aggregated Statistics For Year 2001 (Based on 2 partial tracts)
A) FHA, FSA/RHS & VA Home Purchase Loans
B) Conventional Home Purchase Loans
C) Refinancings
D) Home Improvement Loans
F) Non-occupant Loans on < 5 Family Dwellings (A B C & D)
Number
Average Value
Number
Average Value
Number
Average Value
Number
Average Value
Number
Average Value
LOANS ORIGINATED
1
$167,330
12
$77,850
35
$95,306
3
$16,470
2
$41,105
APPLICATIONS APPROVED, NOT ACCEPTED
0
$0
4
$48,890
5
$74,238
1
$9,960
0
$0
APPLICATIONS DENIED
0
$0
12
$59,478
15
$76,480
3
$9,687
0
$0
APPLICATIONS WITHDRAWN
0
$0
0
$0
9
$89,130
1
$59,370
0
$0
FILES CLOSED FOR INCOMPLETENESS
0
$0
2
$90,930
3
$106,013
0
$0
0
$0
Aggregated Statistics For Year 2000 (Based on 2 partial tracts)
A) FHA, FSA/RHS & VA Home Purchase Loans
B) Conventional Home Purchase Loans
C) Refinancings
D) Home Improvement Loans
F) Non-occupant Loans on < 5 Family Dwellings (A B C & D)
Number
Average Value
Number
Average Value
Number
Average Value
Number
Average Value
Number
Average Value
LOANS ORIGINATED
1
$85,120
13
$85,915
17
$74,394
3
$13,700
2
$67,885
APPLICATIONS APPROVED, NOT ACCEPTED
2
$35,085
4
$62,072
5
$98,070
0
$0
0
$0
APPLICATIONS DENIED
0
$0
12
$52,073
17
$68,508
2
$18,890
2
$51,690
APPLICATIONS WITHDRAWN
0
$0
1
$62,280
6
$80,825
0
$0
0
$0
FILES CLOSED FOR INCOMPLETENESS
0
$0
1
$58,130
1
$71,410
0
$0
0
$0
Aggregated Statistics For Year 1999 (Based on 1 partial tract)
B) Conventional Home Purchase Loans
C) Refinancings
D) Home Improvement Loans
F) Non-occupant Loans on < 5 Family Dwellings (A B C & D)
Detailed PMIC statistics for the following Tracts:0206.00
2003 - 2018 National Fire Incident Reporting System (NFIRS) incidents
Based on the data from the years 2003 - 2018 the average number of fire incidents per year is 14. The highest number of reported fire incidents - 27 took place in 2007, and the least - 9 in 2017. The data has a growing trend.
When looking into fire subcategories, the most reports belonged to: Structure Fires (45.9%), and Outside Fires (37.6%).
Fire incident types reported to NFIRS in Zip Code 27252
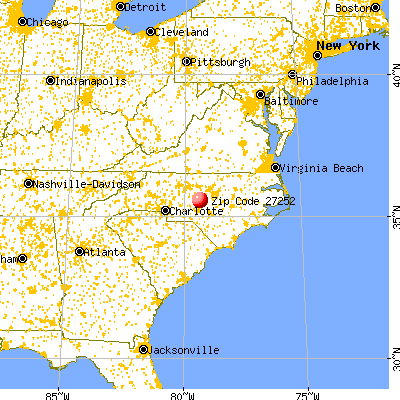


 Nearest zip codes: 27207, 27330, 27344, 27208, 28327, 27312.
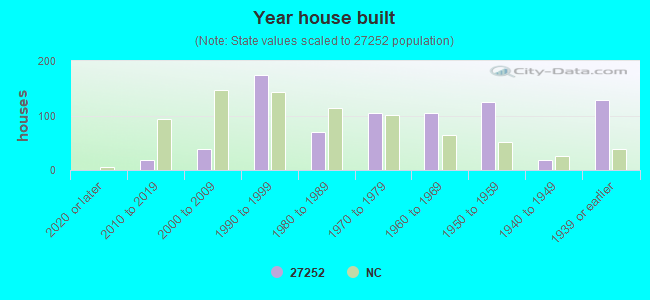


 Based on the data from the years 2003 - 2018 the average number of fire incidents per year is 14. The highest number of reported fire incidents - 27 took place in 2007, and the least - 9 in 2017. The data has a growing trend.
 When looking into fire subcategories, the most reports belonged to: Structure Fires (45.9%), and Outside Fires (37.6%).