Estimated zip code population in 2022: 28,660 Zip code population in 2010: 24,286 Zip code population in 2000: 20,544
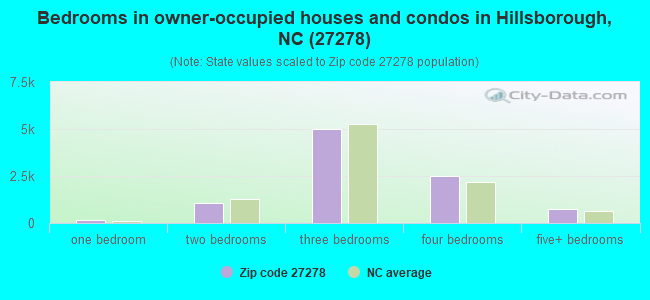
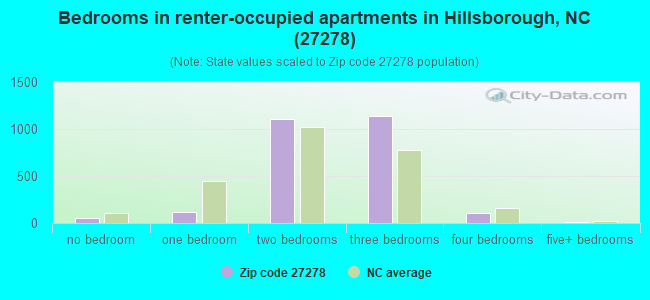
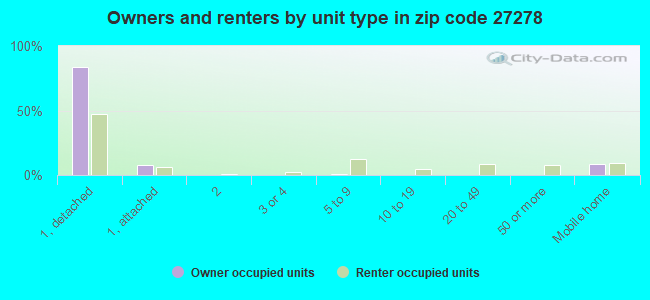
Houses and condos: 12,915 Renter-occupied apartments: 2,544
% of renters here:
21%
State:
33%
March 2022 cost of living index in zip code 27278: 93.6 (less than average, U.S. average is 100)
Land area: 101.4 sq. mi. Water area: 0.9 sq. mi.
Population density: 283 people per square mile
(very low).
OSM Map
General Map
Google Map
MSN Map
OSM Map
General Map
Google Map
MSN Map
OSM Map
General Map
Google Map
MSN Map
OSM Map
General Map
Google Map
MSN Map
Please wait while loading the map...
Real estate property taxes paid for housing units in 2022:
This zip code:
0.7% ($2,977)
North Carolina:
0.6% ($1,769)
Median real estate property taxes paid for housing units with mortgages in 2022: $3,146 (0.7%) Median real estate property taxes paid for housing units with no mortgage in 2022: $2,631 (0.7%)
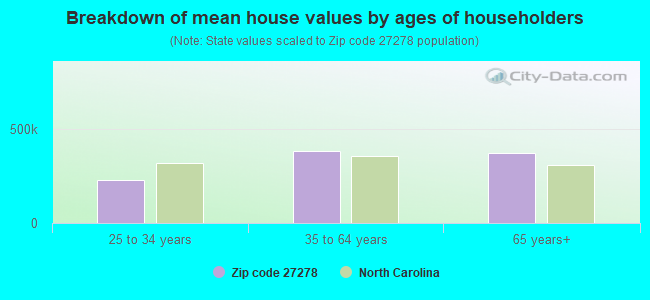
Estimated median house/condo value in 2022: $424,902
27278:
$424,902
North Carolina:
$280,600
According to our research of North Carolina and other state lists, there were 27 registered sex offenders living in 27278 zip code as of May 11, 2024. The ratio of all residents to sex offenders in zip code 27278 is 947 to 1. The ratio of registered sex offenders to all residents in this zip code is lower than the state average.
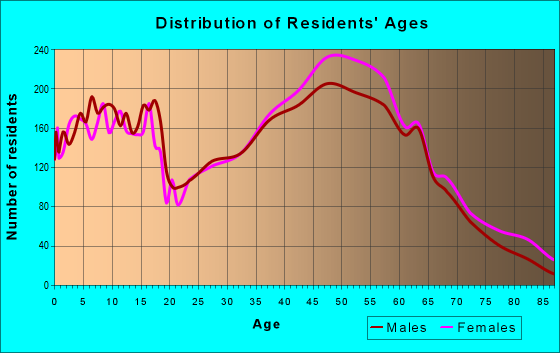
Median resident age:
This zip code:
47.1 years
North Carolina median age:
39.2 years
Average household size:
This zip code:
2.4 people
North Carolina:
2.4 people
Averages for the 2020 tax year for zip code 27278, filed in 2021:
Average Adjusted Gross Income (AGI) in 2020: $104,130 (Individual Income Tax Returns)
Here:
$104,130
State:
$70,020
Salary/wage: $105,832 (reported on 79.0% of returns)
Here:
$105,832
State:
$58,387
(% of AGI for various income ranges: 1152.1% for AGIs below $25k, 3643.4% for AGIs $25k-50k, 6630.6% for AGIs $50k-75k, 9586.2% for AGIs $75k-100k, 19513.7% for AGIs $100k-200k, 162129.7% for AGIs over 200k)
Taxable interest for individuals: $1,239 (reported on 45.4% of returns)
This zip code:
$1,239
North Carolina:
$1,479
(% of AGI for various income ranges: 16.7% for AGIs below $25k, 31.7% for AGIs $25k-50k, 55.1% for AGIs $50k-75k, 105.0% for AGIs $75k-100k, 137.9% for AGIs $100k-200k, 849.7% for AGIs over 200k)
Ordinary dividends: $7,260 (reported on 28.2% of returns)
Here:
$7,260
State:
$7,888
(% of AGI for various income ranges: 35.4% for AGIs below $25k, 64.6% for AGIs $25k-50k, 169.1% for AGIs $50k-75k, 296.0% for AGIs $75k-100k, 481.9% for AGIs $100k-200k, 3892.6% for AGIs over 200k)
Net capital gain/loss in AGI: +$36,288 (reported on 25.0% of returns)
Here:
+$36,288
State:
+$23,652
(% of AGI for various income ranges: 15.5% for AGIs below $25k, 62.8% for AGIs $25k-50k, 166.9% for AGIs $50k-75k, 253.7% for AGIs $75k-100k, 849.7% for AGIs $100k-200k, 28335.8% for AGIs over 200k)
Profit/loss from business: +$15,339 (reported on 20.1% of returns)
Here:
+$15,339
State:
+$11,710
(% of AGI for various income ranges: 184.4% for AGIs below $25k, 231.8% for AGIs $25k-50k, 272.3% for AGIs $50k-75k, 379.2% for AGIs $75k-100k, 1024.5% for AGIs $100k-200k, 3181.6% for AGIs over 200k)
Taxable individual retirement arrangement distribution: $24,242 (reported on 11.4% of returns)
27278:
$24,242
North Carolina:
$20,247
(% of AGI for various income ranges: 62.1% for AGIs below $25k, 152.3% for AGIs $25k-50k, 295.8% for AGIs $50k-75k, 520.3% for AGIs $75k-100k, 1059.5% for AGIs $100k-200k, 2721.1% for AGIs over 200k)
Self-employed (Keogh) retirement plans: $23,529 (reported on 1.7% of returns)
27278:
$23,529
North Carolina:
$26,749
(% of AGI for various income ranges: 9.9% for AGIs $25k-50k, 82.8% for AGIs $100k-200k, 1108.4% for AGIs over 200k)
Total itemized deductions: $37,017 (reported on 12.9% of returns)
Here:
$37,017
State:
$34,549
(% of AGI for various income ranges: 67.3% for AGIs below $25k, 166.8% for AGIs $25k-50k, 396.7% for AGIs $50k-75k, 680.8% for AGIs $75k-100k, 1243.0% for AGIs $100k-200k, 8610.5% for AGIs over 200k)
Charity contributions: $16,470 (reported on 10.8% of returns)
Here:
$16,470
State:
$13,360
(% of AGI for various income ranges: 5.4% for AGIs below $25k, 18.9% for AGIs $25k-50k, 64.3% for AGIs $50k-75k, 100.4% for AGIs $75k-100k, 295.7% for AGIs $100k-200k, 4802.9% for AGIs over 200k)
Taxes paid: $8,324 (reported on 12.8% of returns)
27278:
$8,324
State:
$7,586
(% of AGI for various income ranges: 12.2% for AGIs below $25k, 29.8% for AGIs $25k-50k, 100.2% for AGIs $50k-75k, 187.4% for AGIs $75k-100k, 390.1% for AGIs $100k-200k, 1438.4% for AGIs over 200k)
Earned income credit: $2,288 (reported on 12.0% of returns)
Here:
$2,288
State:
$2,337
(% of AGI for various income ranges: 101.2% for AGIs below $25k, 58.9% for AGIs $25k-50k)
Percentage of individuals using paid preparers for their 2020 taxes: 91.2%
Here:
91%
State:
93%
(% for various income ranges: 89.4% for AGIs below $25k, 91.1% for AGIs $25k-50k, 91.0% for AGIs $50k-75k, 90.7% for AGIs $75k-100k, 93.1% for AGIs $100k-200k, 93.8% for AGIs over 200k)
Averages for the 2012 tax year for zip code 27278, filed in 2013:
Average Adjusted Gross Income (AGI) in 2012: $69,974 (Individual Income Tax Returns)
Here:
$69,974
State:
$54,937
Salary/wage: $61,032 (reported on 83.2% of returns)
Here:
$61,032
State:
$46,336
(% of AGI for various income ranges: 70.0% for AGIs below $25k, 76.8% for AGIs $25k-50k, 74.0% for AGIs $50k-75k, 75.1% for AGIs $75k-100k, 78.9% for AGIs $100k-200k, 62.0% for AGIs over 200k)
Taxable interest for individuals: $1,005 (reported on 47.5% of returns)
This zip code:
$1,005
North Carolina:
$1,298
(% of AGI for various income ranges: 1.0% for AGIs below $25k, 0.6% for AGIs $25k-50k, 0.9% for AGIs $50k-75k, 0.8% for AGIs $75k-100k, 0.6% for AGIs $100k-200k, 0.6% for AGIs over 200k)
Ordinary dividends: $6,089 (reported on 26.2% of returns)
Here:
$6,089
State:
$6,213
(% of AGI for various income ranges: 2.1% for AGIs below $25k, 1.1% for AGIs $25k-50k, 1.5% for AGIs $50k-75k, 1.3% for AGIs $75k-100k, 1.4% for AGIs $100k-200k, 4.5% for AGIs over 200k)
Net capital gain/loss in AGI: +$8,835 (reported on 20.9% of returns)
Here:
+$8,835
State:
+$12,740
(% of AGI for various income ranges: 0.4% for AGIs below $25k, 0.7% for AGIs $25k-50k, 1.2% for AGIs $50k-75k, 0.8% for AGIs $75k-100k, 1.5% for AGIs $100k-200k, 6.7% for AGIs over 200k)
Profit/loss from business: +$13,175 (reported on 20.1% of returns)
Here:
+$13,175
State:
+$10,311
(% of AGI for various income ranges: 10.1% for AGIs below $25k, 4.2% for AGIs $25k-50k, 3.9% for AGIs $50k-75k, 2.5% for AGIs $75k-100k, 3.1% for AGIs $100k-200k, 3.6% for AGIs over 200k)
Taxable individual retirement arrangement distribution: $18,365 (reported on 11.0% of returns)
27278:
$18,365
North Carolina:
$15,575
(% of AGI for various income ranges: 2.8% for AGIs below $25k, 2.4% for AGIs $25k-50k, 3.2% for AGIs $50k-75k, 3.0% for AGIs $75k-100k, 3.0% for AGIs $100k-200k, 2.8% for AGIs over 200k)
Self-employment retirement plans: $17,653 (reported on 1.3% of returns)
27278:
$17,653
North Carolina:
$21,078
(% of AGI for various income ranges: 0.3% for AGIs $25k-50k, 0.3% for AGIs $100k-200k, 0.8% for AGIs over 200k)
Total itemized deductions: $25,297 (21% of AGI, reported on 45.3% of returns)
Here:
$25,297
State:
$23,438
Here:
21.3% of AGI
State:
21.5% of AGI
(% of AGI for various income ranges: 13.1% for AGIs below $25k, 12.4% for AGIs $25k-50k, 20.9% for AGIs $50k-75k, 17.4% for AGIs $75k-100k, 18.1% for AGIs $100k-200k, 14.3% for AGIs over 200k)
Charity contributions: $3,938 (reported on 38.8% of returns)
Here:
$3,938
State:
$4,687
(% of AGI for various income ranges: 1.2% for AGIs below $25k, 1.6% for AGIs $25k-50k, 2.0% for AGIs $50k-75k, 2.5% for AGIs $75k-100k, 2.5% for AGIs $100k-200k, 2.2% for AGIs over 200k)
Taxes paid: $10,483 (reported on 45.1% of returns)
27278:
$10,483
State:
$8,823
(% of AGI for various income ranges: 2.6% for AGIs below $25k, 3.2% for AGIs $25k-50k, 5.5% for AGIs $50k-75k, 6.8% for AGIs $75k-100k, 8.1% for AGIs $100k-200k, 8.0% for AGIs over 200k)
Earned income credit: $2,274 (reported on 15.2% of returns)
Here:
$2,274
State:
$2,376
(% of AGI for various income ranges: 6.6% for AGIs below $25k, 1.0% for AGIs $25k-50k)
Percentage of individuals using paid preparers for their 2012 taxes: 45.8%
Here:
46%
State:
53%
(% for various income ranges: 41.3% for AGIs below $25k, 43.9% for AGIs $25k-50k, 48.3% for AGIs $50k-75k, 46.9% for AGIs $75k-100k, 48.7% for AGIs $100k-200k, 64.5% for AGIs over 200k)
Averages for the 2004 tax year for zip code 27278, filed in 2005:
Average Adjusted Gross Income (AGI) in 2004: $56,025 (Individual Income Tax Returns)
Here:
$56,025
State:
$45,376
Salary/wage: $50,237 (reported on 86.8% of returns)
Here:
$50,237
State:
$39,442
(% of AGI for various income ranges: 118.6% for AGIs below $10k, 78.9% for AGIs $10k-25k, 82.7% for AGIs $25k-50k, 80.1% for AGIs $50k-75k, 84.2% for AGIs $75k-100k, 72.2% for AGIs over 100k)
Taxable interest for individuals: $1,319 (reported on 51.9% of returns)
This zip code:
$1,319
North Carolina:
$1,515
(% of AGI for various income ranges: 6.1% for AGIs below $10k, 1.4% for AGIs $10k-25k, 1.1% for AGIs $25k-50k, 0.9% for AGIs $50k-75k, 1.0% for AGIs $75k-100k, 1.3% for AGIs over 100k)
Taxable dividends: $2,845 (reported on 28.0% of returns)
Here:
$2,845
State:
$4,016
(% of AGI for various income ranges: 4.7% for AGIs below $10k, 1.1% for AGIs $10k-25k, 0.9% for AGIs $25k-50k, 1.2% for AGIs $50k-75k, 1.0% for AGIs $75k-100k, 1.8% for AGIs over 100k)
Net capital gain/loss: +$12,341 (reported on 22.3% of returns)
Here:
+$12,341
State:
+$11,152
(% of AGI for various income ranges: -2.0% for AGIs below $10k, 0.3% for AGIs $10k-25k, 0.6% for AGIs $25k-50k, 1.1% for AGIs $50k-75k, 1.8% for AGIs $75k-100k, 9.5% for AGIs over 100k)
Profit/loss from business: +$10,844 (reported on 17.6% of returns)
Here:
+$10,844
State:
+$9,490
(% of AGI for various income ranges: 10.0% for AGIs below $10k, 5.0% for AGIs $10k-25k, 3.6% for AGIs $25k-50k, 2.7% for AGIs $50k-75k, 2.7% for AGIs $75k-100k, 3.4% for AGIs over 100k)
IRA payment deduction: $2,932 (reported on 2.9% of returns)
27278:
$2,932
North Carolina:
$2,967
(% of AGI for various income ranges: 0.3% for AGIs $10k-25k, 0.3% for AGIs $25k-50k, 0.1% for AGIs $50k-75k, 0.2% for AGIs $75k-100k, 0.1% for AGIs over 100k)
Self-employed pension: $13,993 (reported on 1.5% of returns)
Here:
$13,993
North Carolina:
$14,754
(% of AGI for various income ranges: 0.1% for AGIs $25k-50k, 0.1% for AGIs $50k-75k, 0.2% for AGIs $75k-100k, 0.7% for AGIs over 100k)
Total itemized deductions: $20,469 (22% of AGI, reported on 46.8% of returns)
Here:
$20,469
State:
$19,464
Here:
22.2% of AGI
State:
22.7% of AGI
(% of AGI for various income ranges: 20.8% for AGIs below $10k, 11.8% for AGIs $10k-25k, 14.7% for AGIs $25k-50k, 19.8% for AGIs $50k-75k, 19.2% for AGIs $75k-100k, 16.9% for AGIs over 100k)
Charity contributions deductions: $3,462 (4% of AGI, reported on 41.9% of returns)
Here:
$3,462
State:
$4,035
Here:
3.6% of AGI
State:
4.5% of AGI
(% of AGI for various income ranges: 1.4% for AGIs below $10k, 1.5% for AGIs $10k-25k, 2.0% for AGIs $25k-50k, 2.7% for AGIs $50k-75k, 2.5% for AGIs $75k-100k, 3.0% for AGIs over 100k)
Total tax: $8,518 (reported on 78.6% of returns)
27278:
$8,518
State:
$7,257
(% of AGI for various income ranges: 4.2% for AGIs below $10k, 4.0% for AGIs $10k-25k, 6.8% for AGIs $25k-50k, 8.9% for AGIs $50k-75k, 10.0% for AGIs $75k-100k, 16.6% for AGIs over 100k)
Earned income credit: $1,613 (reported on 14.0% of returns)
Here:
$1,613
State:
$1,851
Percentage of individuals using paid preparers for their 2004 taxes: 53.3%
Here:
53%
State:
62%
(% for various income ranges: 45.1% for AGIs below $10k, 58.1% for AGIs $10k-25k, 55.5% for AGIs $25k-50k, 53.6% for AGIs $50k-75k, 51.9% for AGIs $75k-100k, 53.6% for AGIs over 100k)
Likely homosexual households (counted as self-reported same-sex unmarried-partner households)
Lesbian couples: 0.1% of all households
Gay men: 0.2% of all households
Household received Food Stamps/SNAP in the past 12 months: 851 Household did not receive Food Stamps/SNAP in the past 12 months: 11,084
Women who had a birth in the past 12 months: 323 (231 now married, 93 unmarried) Women who did not have a birth in the past 12 months: 5,393 (2,870 now married, 2,534 unmarried)
Housing units in zip code 27278 with a mortgage: 6,407 (962 second mortgage, 62 home equity loan, 823 both second mortgage and home equity loan) Houses without a mortgage: 198
Median monthly owner costs for units with a mortgage: $1,828 Median monthly owner costs for units without a mortgage: $541
Residents with income below the poverty level in 2022:
This zip code:
6.5%
Whole state:
12.8%
Residents with income below 50% of the poverty level in 2022:
This zip code:
3.7%
Whole state:
6.8%
Median number of rooms in houses and condos:
Here:
6.9
State:
6.4
Median number of rooms in apartments:
Here:
4.7
State:
4.4
Notable locations in this zip code not listed on our city pages
Churches in zip code 27278 include: Harvest Chapel (A), Jones Grove Church (B), Temple of Truth (C), Allens Chapel (D), Lipscomb Grove Church (E), Union Grove Church (F), Mars Hill Church (G), Wayside Church (H), Mount Zion Church (I). Display/hide their locations on the map
Cemeteries: Governor Burke Grave (1), Maplewood Cemetery (2), Mars Hill Cemetery (3), Chapel Cemetery (4), Rosewood Cemetery (5), Cross Roads Cemetery (6). Display/hide their locations on the map
Lakes and reservoirs: Spring Valley Lake (A), Ben Johnson Lake (B), Lake Overlook (C), Arrowhead Lake (D), Lake Orange (E), Orange-Alamance Lake (F), Piedmont Minerals Lake (G), Noname (H). Display/hide their locations on the map
Streams, rivers, and creeks: Cates Creek (A), Buckwater Creek (B), West Fork Eno River (C), Strouds Creek (D), Steep Bottom Branch (E), Sevenmile Creek (F), Rocky Run (G), McGowan Creek (H), Little Creek (I). Display/hide their locations on the map
4,058 married couples with children.
1,173 single-parent households (405 men, 768 women).
88.7% of residents of 27278 zip code speak English at home.
7.8% of residents speak Spanish at home (61% very well, 18% well, 15% not well, 6% not at all).
1.5% of residents speak other Indo-European language at home (80% very well, 8% well, 12% not well).
1.3% of residents speak Asian or Pacific Island language at home (64% very well, 11% well, 24% not well).
0.5% of residents speak other language at home (83% very well, 17% well).
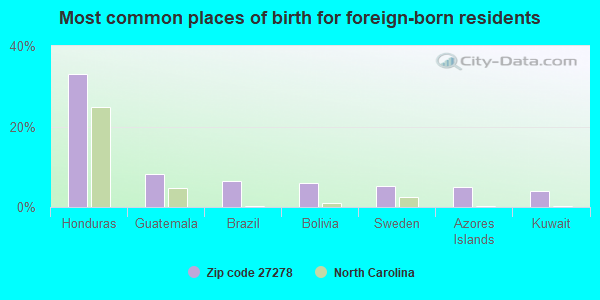
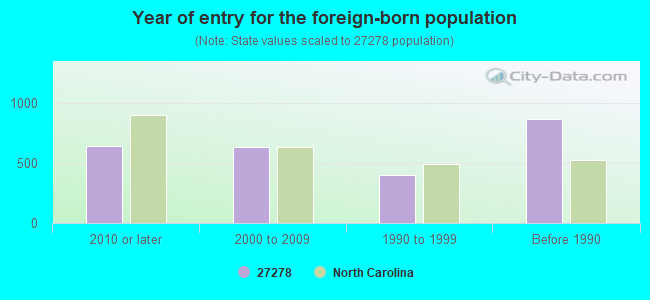
Foreign born population: 1,929 (6.7%) (44.6% of them are naturalized citizens)
This zip code:
6.7%
Whole state:
8.6%
33%Honduras
8%Guatemala
6%Brazil
6%Bolivia
5%Sweden
5%Azores Islands
4%Kuwait
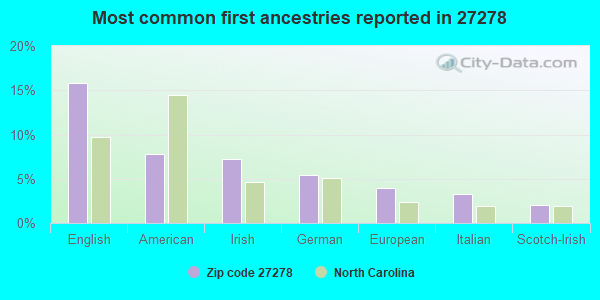
16%English
8%American
7%Irish
5%German
4%European
3%Italian
2%Scotch-Irish
Year of entry for the foreign-born population
6412010 or later
6382000 to 2009
4031990 to 1999
869Before 1990
Facilities with environmental interests located in this zip code:
DON LACEFIELD CHEVROLET (259 S CHURTON ST in HILLSBOROUGH, NC)
STATE MASTER (North Carolina facility info) - UNDERGROUND STORAGE TANK PROGRAM Conditionally Exempt Small Quantity Generators, less than 100 kg/month of hazardous waste (Resource Conservation and Recovery Act (tracking hazardous waste)) - notification Business SIC classification: NONCLASSIFIABLE ESTABLISHMENTS
CHANDLER CONCRETE CO INCORPORATED - HILLSBOROUGH (RT 3 OLD HIGHWAY 10 in HILLSBOROUGH, NC)
AIR MINOR (AIRS/AFS) STATE MASTER (North Carolina facility info) - AIR PROGRAM, -66AN2CF000X6DDA4A2PV81MWT7, WASTEWATER FACILITY CRITERIA AND HAZARDOUS AIR POLLUTANT INVENTORY (Inventory of air pollution sources) Business SIC classification: READY-MIXED CONCRETE
ARBOR HILLS MOBILE HOME PARK (4224 HIGHWAY 70 WEST in HILLSBOROUGH, NC)
STATE MASTER (North Carolina facility info) - -115DA4YG00M29W84AX3Y82Q2PG, WASTEWATER FACILITY National Pollutant Discharge Elimination System NON-MAJOR (Tracking pollutant discharge elimination systems) - permit Business SIC classification: OPERATORS OF RESIDENTIAL MOBILE HOME SITES Alternative names: ARBOR HILLS MHP
CHAPMAN'S AUTOMOTIVE INCORPORATED (2521 HIGHLAND FARM ROAD in HILLSBOROUGH, NC)
STATE MASTER (North Carolina facility info) - -115DA4YG00N6WW64FBEPG245H8, WASTEWATER FACILITY National Pollutant Discharge Elimination System NON-MAJOR (Tracking pollutant discharge elimination systems) - permit Business SIC classification: MOTOR VEHICLE PARTS, USED Alternative names: CHAPMAN S AUTOMOTIVE INCORPORATED
A L STANBACK MIDDLE (3700 NC #86 SOUTH in HILLSBOROUGH, NC)
(National Center for Education Statistics) - STATE ID-304 Organizations: ORANGE COUNTY SCHOOLS (SCHOOL DISTRICT)
CAMERON PARK ELEMENTARY (240 E KING ST in HILLSBOROUGH, NC)
(National Center for Education Statistics) - STATE ID-308 Organizations: ORANGE COUNTY SCHOOLS (SCHOOL DISTRICT)
CEDAR RIDGE HIGH (1125 NEW GRADY BROWN SCH RD in HILLSBOROUGH, NC)
(National Center for Education Statistics) - STATE ID-310 Organizations: ORANGE COUNTY SCHOOLS (SCHOOL DISTRICT)
CENTRAL ELEMENTARY (154 HAYES ST in HILLSBOROUGH, NC)
(National Center for Education Statistics) - STATE ID-312 Organizations: ORANGE COUNTY SCHOOLS (SCHOOL DISTRICT)
CHARLES W STANFORD MIDDLE (308 ORANGE HIGH RD in HILLSBOROUGH, NC)
(National Center for Education Statistics) - STATE ID-316 Organizations: ORANGE COUNTY SCHOOLS (SCHOOL DISTRICT)
CARDEN`S BODY & PAINT SERVICE INC (259 S CHURTON ST in HILLSBROUGH, NC)
(Resource Conservation and Recovery Act (tracking hazardous waste)) Organizations: WILLIAM CARDEN JR (CONTACT/OWNER)
Alternative names: CARDEN'S BODY & PAINT SERVICE INC
CHARLES BARTEE-RESIDENCE (1841 WASHINGTON DR in HILLSBOROUGH, NC)
National Pollutant Discharge Elimination System NON-MAJOR (Tracking pollutant discharge elimination systems) - permit
CHARLES CRANK - RESIDENCE (1902 ADAMS PL in HILLSBOROUGH, NC)
National Pollutant Discharge Elimination System NON-MAJOR (Tracking pollutant discharge elimination systems) - permit
Housing units lacking complete plumbing facilities: 3.1% Housing units lacking complete kitchen facilities: 3.3%
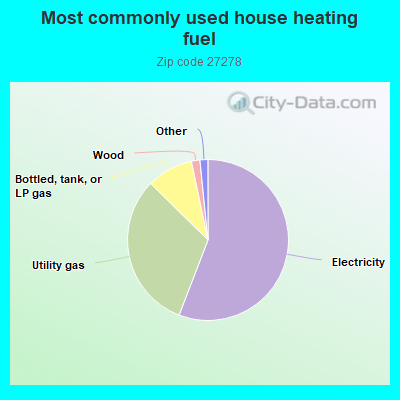
55.8%Electricity
31.5%Utility gas
9.3%Bottled, tank, or LP gas
1.7%Wood
1.0%Fuel oil, kerosene, etc.
0.5%Other fuel
Population in 1990: 15,811. Population change in the 1990s: +4,733 (+29.9%).
Place of birth for U.S.-born residents:
This state: 12,925
Northeast: 4,403
Midwest: 2,610
South: 4,585
West: 1,665
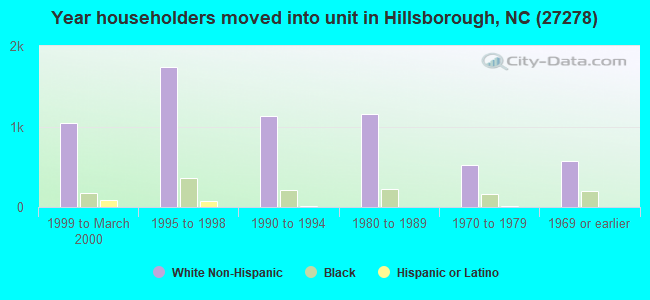
54% of the 27278 zip code residents lived in the same house 5 years ago. Out of people who lived in different houses, 50% lived in this county. Out of people who lived in different counties, 50% lived in North Carolina.
92% of the 27278 zip code residents lived in the same house 1 year ago. Out of people who lived in different houses, 33% moved from this county. Out of people who lived in different houses, 22% moved from different county within same state. Out of people who lived in different houses, 49% moved from different state. Out of people who lived in different houses, 1% moved from abroad.
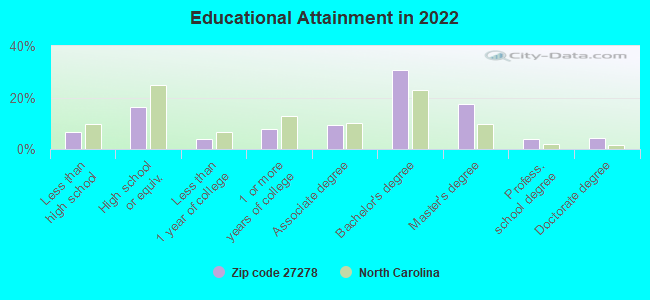
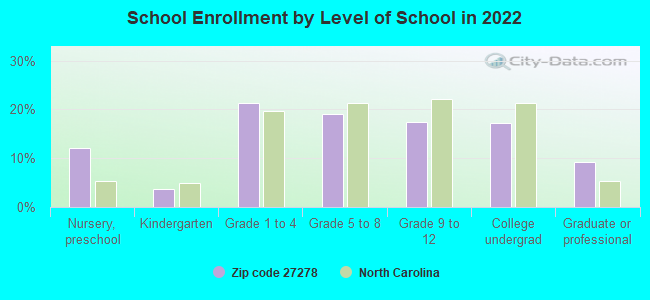
Private vs. public school enrollment:
Students in private schools in grades 1 to 8 (elementary and middle school): 423
Here:
16.5%
North Carolina:
13.8%
Students in private schools in grades 9 to 12 (high school): 73
Here:
6.6%
North Carolina:
11.9%
Students in private undergraduate colleges: 195
Here:
17.9%
North Carolina:
19.3%
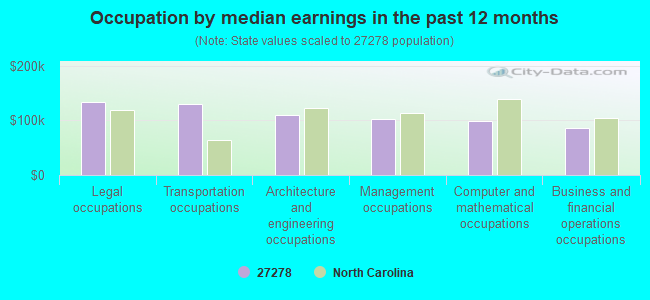
Occupation by median earnings in the past 12 months ($)
133,338Legal occupations
130,936Transportation occupations
110,260Architecture and engineering occupations
103,246Management occupations
99,699Computer and mathematical occupations
85,387Business and financial operations occupations
Companies with federal contracts located in this zip code (HILLSBOROUGH, NC):
BIOTECHNICS, INC (310 MILLSTONE DRIVE; small business) : $553,203 in 19 contractsfrom 2000 to 2006
Contracts for Pathology Services, Laboratory Testing Services by Army Signed by year:2000: $191,611; 2001: $56,381; 2002: $35,367; 2003: $169,993; 2004: $59,995; 2005: $19,999; 2006: $19,857.
Biggest contracts:
$148,625 with Army for Pathology Services. Signed on 2001-02-20. Completion date: 2002-02-28.
$144,250, same as above.Signed on 2000-03-29. Completion date: 2001-02-28.
$109,993, same as above.Signed on 2004-02-04. Completion date: 2004-02-29.
$79,995 with Army for Pathology Services. Taking place in MD. Signed on 2004-04-28. Completion date: 2005-04-30.
SOUTHERN SOLUTIONS (1007 TIMBERS LN) : $127,724 in 7 contractsfrom 2005 to 2006
Contracts for Fruits and Vegetables by Defense Logistics Agency Signed by year:2000: $0; 2001: $0; 2002: $0; 2003: $0; 2004: $0; 2005: $16,203; 2006: $111,521.
Biggest contracts:
$31,551 with Defense Logistics Agency for Fruits and Vegetables. Signed on 2006-01-16. Completion date: 2006-01-16.
$23,636, same as above.Signed on 2006-01-23. Completion date: 2006-01-23.
$23,043, same as above.Signed on 2006-01-18. Completion date: 2006-01-18.
$16,203, same as above.Signed on 2005-12-15. Completion date: 2005-12-15.
BOS, SHERRI (1026 ORANGE HIGH SCHOOL RD; small business) : $124,795 in 6 contractsfrom 2003 to 2006
Contracts for Maintenance, Repair or Alteration of Real Property -- Other Industrial Buildings, Maintenance, Repair or Alteration of Real Property -- Water Supply Facilities, Maintenance, Repair and Rebuilding of Equipment -- Special Industry Machinery, Maintenance, Repair and Rebuilding of Equipment -- Water Purification and Sewage Treatment Equipment by Navy Signed by year:2000: $0; 2001: $0; 2002: $0; 2003: $88,500; 2004: $28,325; 2005: $9,361; 2006: -$1,391.
Biggest contracts:
$83,250 with Navy for Maintenance, Repair or Alteration of Real Property -- Other Industrial Buildings. Signed on 2003-05-29. Completion date: 2003-07-31.
$28,325, same as above.Signed on 2004-11-19. Completion date: 2005-02-19.
$5,250 with Navy for Maintenance, Repair or Alteration of Real Property -- Water Supply Facilities. Signed on 2005-02-25. Completion date: 2006-04-28.
$5,250 with Navy for Maintenance, Repair or Alteration of Real Property -- Other Industrial Buildings. Signed on 2003-05-02. Completion date: 2004-04-30.
FEEDBACK INCORPORATED (437 DIMMOCKS MILL RD; small business) : $108,001 in 3 contractsfrom 2003 to 2005
$62,016 with Army for Training Aids. Signed on 2005-03-07. Completion date: 2005-05-06.
$40,586 with Navy for Operation Training Devices. Taking place in MD. Signed on 2003-12-09. Completion date: 2004-01-19.
$5,399 with Army for Combination and Miscellaneous Instruments. Signed on 2005-03-25. Completion date: 2005-05-13.
RESOURCE TECHNOLOGIES INC (387A CORNELIUS ST; small business) : $71,770 in 5 contractsfrom 2002 to 2005
Contracts for Modification of Equipment -- Electric Wire, and Power and Distribution Equipment, ADP Support Equipment, Facilities Operations Support Services, Installation of Equipment -- Communication, Detection, and Coherent Radiation Equipment by Navy, Federal Technology Service Signed by year:2000: $0; 2001: $0; 2002: $11,801; 2003: $28,522; 2004: $0; 2005: $31,447; 2006: $0.
Biggest contracts:
$31,447 with Navy for Modification of Equipment -- Electric Wire, and Power and Distribution Equipment. Signed on 2005-09-15. Completion date: 2005-11-18.
$14,070 with Federal Technology Service for ADP Support Equipment. Signed on 2003-05-15. Completion date: 2003-07-15.
$11,801 with Navy for Facilities Operations Support Services. Signed on 2002-12-31. Completion date: 2003-05-30.
$11,652 with Navy for Installation of Equipment -- Communication, Detection, and Coherent Radiation Equipment. Signed on 2003-03-10. Completion date: 2003-04-30.
ORIENTATION & MOBILITY SERVICE (2227 WYNGATE DRIVE; small business) : $32,846 in 7 contractsfrom 2003 to 2005
Contracts for Education Services by Army Signed by year:2000: $0; 2001: $0; 2002: $0; 2003: $7,446; 2004: $0; 2005: $25,400; 2006: $0.
Biggest contracts:
$12,700 with Army for Education Services. Signed on 2005-11-17. Completion date: 2003-09-30.
$12,700, same as above.Signed on 2005-01-29. Completion date: 2003-09-30.
$11,620, same as above.Signed on 2003-10-31. Completion date: 2003-09-30.
$0, same as above.Signed on 2005-11-17. Completion date: 2003-09-30.
DATA POWER & AIR INC (130 E ORANGE ST; small business) : $31,390 in 2 contractsfrom 2005 to 2006
$17,500 with Navy for Maintenance, Repair or Alteration of Real Property -- Miscellaneous Buildings. Signed on 2006-05-18. Completion date: 2006-05-31.
$13,890 with EPA for Miscellaneous Items. Signed on 2005-09-28. Completion date: 2006-09-27.
PROPHYSICS INNOVATIONS, INC (410-D MILLSTONE DRIVE; small business)
$18,475 with Navy for Medical and Surgical Instruments, Equipment, and Supplies. Signed on 2006-01-28. Completion date: 2006-09-30.
GROWTH UNLIMITED INC (2430 TIMBER OAK DR; small business) : $11,500 in 3 contractsin 2004
$4,000 with Army for Lectures For Training. Taking place in LA. Signed on 2004-12-14. Completion date: 2005-03-08.
$4,000 with U.S. Army Corps of Engineers - civil program financing only for Lectures For Training. Taking place in LA. Signed on 2004-12-14. Completion date: 2005-03-08.
$3,500 with Army for Other Professional Services. Taking place in MD. Signed on 2004-04-30. Completion date: 2004-05-06.
Top industries in this zip code by the number of employees in 2005:
2004 - 2018 National Fire Incident Reporting System (NFIRS) incidents
Based on the data from the years 2004 - 2018 the average number of fires per year is 100. The highest number of fires - 212 took place in 2007, and the least - 2 in 2005. The data has a growing trend.
When looking into fire subcategories, the most incidents belonged to: Structure Fires (43.3%), and Outside Fires (39.9%).
Fire incident types reported to NFIRS in Zip Code 27278
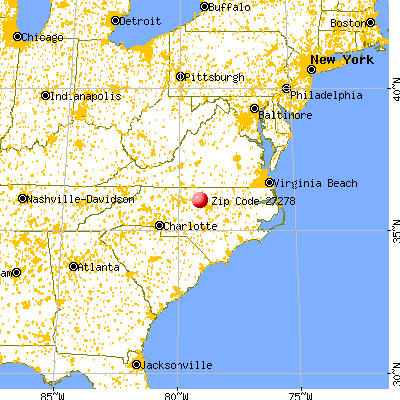


 Nearest zip codes: 27243, 27705, 27514, 27231, 27510, 27541.
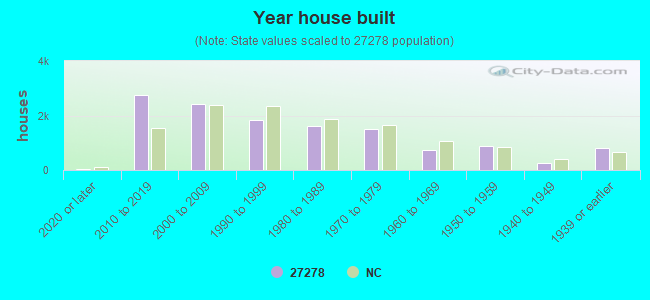


 Based on the data from the years 2004 - 2018 the average number of fires per year is 100. The highest number of fires - 212 took place in 2007, and the least - 2 in 2005. The data has a growing trend.
 When looking into fire subcategories, the most incidents belonged to: Structure Fires (43.3%), and Outside Fires (39.9%).