Estimated zip code population in 2022: 47,904 Zip code population in 2010: 46,282 Zip code population in 2000: 40,713
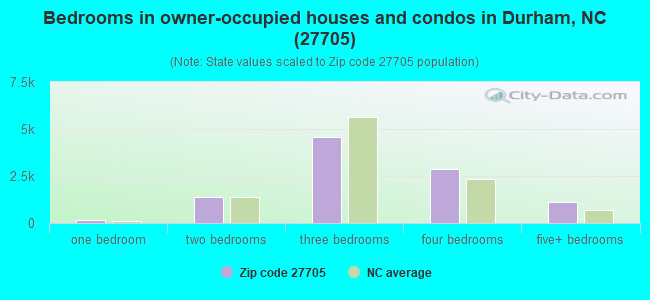
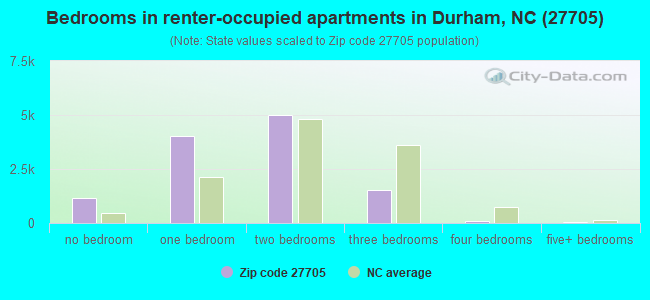
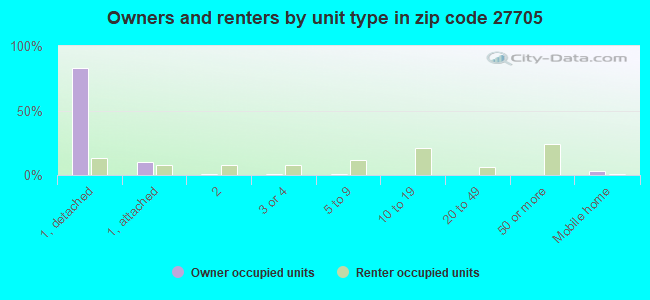
Houses and condos: 23,797 Renter-occupied apartments: 11,834
% of renters here:
54%
State:
33%
March 2022 cost of living index in zip code 27705: 95.8 (near average, U.S. average is 100)
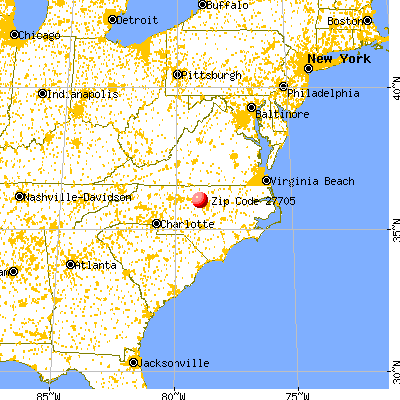
Land area: 43.9 sq. mi. Water area: 0.4 sq. mi.
Population density: 1,092 people per square mile
(low).
OSM Map
General Map
Google Map
MSN Map
OSM Map
General Map
Google Map
MSN Map
OSM Map
General Map
Google Map
MSN Map
OSM Map
General Map
Google Map
MSN Map
Please wait while loading the map...
Real estate property taxes paid for housing units in 2022:
This zip code:
0.8% ($3,654)
North Carolina:
0.6% ($1,769)
Median real estate property taxes paid for housing units with mortgages in 2022: $3,603 (0.8%) Median real estate property taxes paid for housing units with no mortgage in 2022: $3,726 (0.9%)
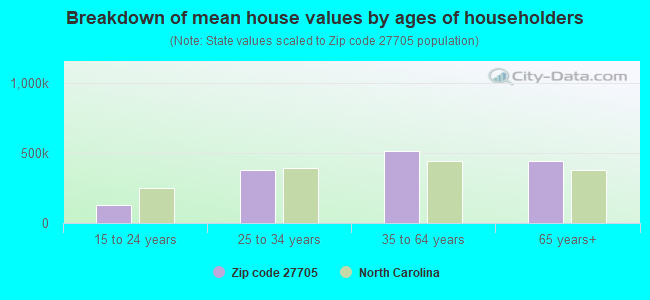
Estimated median house/condo value in 2022: $433,622
27705:
$433,622
North Carolina:
$280,600
According to our research of North Carolina and other state lists, there were 34 registered sex offenders living in 27705 zip code as of April 27, 2024. The ratio of all residents to sex offenders in zip code 27705 is 1,476 to 1. The ratio of registered sex offenders to all residents in this zip code is much lower than the state average.
Median resident age:
This zip code:
35.2 years
North Carolina median age:
39.2 years
Average household size:
This zip code:
2.0 people
North Carolina:
2.4 people
Averages for the 2020 tax year for zip code 27705, filed in 2021:
Average Adjusted Gross Income (AGI) in 2020: $96,932 (Individual Income Tax Returns)
Here:
$96,932
State:
$70,020
Salary/wage: $72,607 (reported on 79.3% of returns)
Here:
$72,607
State:
$58,387
(% of AGI for various income ranges: 1262.0% for AGIs below $25k, 3842.3% for AGIs $25k-50k, 6716.0% for AGIs $50k-75k, 9679.8% for AGIs $75k-100k, 18487.3% for AGIs $100k-200k, 89016.9% for AGIs over 200k)
Taxable interest for individuals: $1,822 (reported on 39.5% of returns)
This zip code:
$1,822
North Carolina:
$1,479
(% of AGI for various income ranges: 15.2% for AGIs below $25k, 23.0% for AGIs $25k-50k, 57.4% for AGIs $50k-75k, 113.3% for AGIs $75k-100k, 276.1% for AGIs $100k-200k, 1273.8% for AGIs over 200k)
Ordinary dividends: $10,920 (reported on 31.4% of returns)
Here:
$10,920
State:
$7,888
(% of AGI for various income ranges: 38.4% for AGIs below $25k, 71.4% for AGIs $25k-50k, 203.0% for AGIs $50k-75k, 420.2% for AGIs $75k-100k, 1277.0% for AGIs $100k-200k, 7125.9% for AGIs over 200k)
Net capital gain/loss in AGI: +$28,685 (reported on 28.1% of returns)
Here:
+$28,685
State:
+$23,652
(% of AGI for various income ranges: 18.9% for AGIs below $25k, 51.5% for AGIs $25k-50k, 162.3% for AGIs $50k-75k, 420.0% for AGIs $75k-100k, 1371.6% for AGIs $100k-200k, 24429.7% for AGIs over 200k)
Profit/loss from business: +$19,072 (reported on 21.2% of returns)
Here:
+$19,072
State:
+$11,710
(% of AGI for various income ranges: 192.8% for AGIs below $25k, 206.0% for AGIs $25k-50k, 257.1% for AGIs $50k-75k, 534.8% for AGIs $75k-100k, 933.8% for AGIs $100k-200k, 7875.9% for AGIs over 200k)
Taxable individual retirement arrangement distribution: $29,059 (reported on 10.6% of returns)
27705:
$29,059
North Carolina:
$20,247
(% of AGI for various income ranges: 42.5% for AGIs below $25k, 86.0% for AGIs $25k-50k, 249.2% for AGIs $50k-75k, 639.1% for AGIs $75k-100k, 1424.4% for AGIs $100k-200k, 4754.8% for AGIs over 200k)
Self-employed (Keogh) retirement plans: $34,193 (reported on 2.6% of returns)
27705:
$34,193
North Carolina:
$26,749
(% of AGI for various income ranges: 10.9% for AGIs $25k-50k, 28.8% for AGIs $75k-100k, 114.8% for AGIs $100k-200k, 2816.4% for AGIs over 200k)
Total itemized deductions: $48,544 (reported on 13.8% of returns)
Here:
$48,544
State:
$34,549
(% of AGI for various income ranges: 66.7% for AGIs below $25k, 157.2% for AGIs $25k-50k, 469.7% for AGIs $50k-75k, 1001.4% for AGIs $75k-100k, 2105.0% for AGIs $100k-200k, 14391.2% for AGIs over 200k)
Charity contributions: $17,180 (reported on 12.2% of returns)
Here:
$17,180
State:
$13,360
(% of AGI for various income ranges: 4.2% for AGIs below $25k, 22.5% for AGIs $25k-50k, 79.1% for AGIs $50k-75k, 206.0% for AGIs $75k-100k, 481.3% for AGIs $100k-200k, 5648.3% for AGIs over 200k)
Taxes paid: $7,702 (reported on 13.7% of returns)
27705:
$7,702
State:
$7,586
(% of AGI for various income ranges: 9.0% for AGIs below $25k, 22.2% for AGIs $25k-50k, 82.3% for AGIs $50k-75k, 206.0% for AGIs $75k-100k, 515.2% for AGIs $100k-200k, 1701.7% for AGIs over 200k)
Earned income credit: $2,046 (reported on 12.2% of returns)
Here:
$2,046
State:
$2,337
(% of AGI for various income ranges: 85.4% for AGIs below $25k, 44.2% for AGIs $25k-50k)
Percentage of individuals using paid preparers for their 2020 taxes: 90.8%
Here:
91%
State:
93%
(% for various income ranges: 86.5% for AGIs below $25k, 91.4% for AGIs $25k-50k, 92.3% for AGIs $50k-75k, 92.8% for AGIs $75k-100k, 93.4% for AGIs $100k-200k, 94.5% for AGIs over 200k)
Averages for the 2012 tax year for zip code 27705, filed in 2013:
Average Adjusted Gross Income (AGI) in 2012: $69,634 (Individual Income Tax Returns)
Here:
$69,634
State:
$54,937
Salary/wage: $53,746 (reported on 82.4% of returns)
Here:
$53,746
State:
$46,336
(% of AGI for various income ranges: 78.1% for AGIs below $25k, 82.3% for AGIs $25k-50k, 71.2% for AGIs $50k-75k, 67.6% for AGIs $75k-100k, 67.8% for AGIs $100k-200k, 48.2% for AGIs over 200k)
Taxable interest for individuals: $1,787 (reported on 39.4% of returns)
This zip code:
$1,787
North Carolina:
$1,298
(% of AGI for various income ranges: 1.2% for AGIs below $25k, 0.6% for AGIs $25k-50k, 1.0% for AGIs $50k-75k, 1.2% for AGIs $75k-100k, 0.8% for AGIs $100k-200k, 1.2% for AGIs over 200k)
Ordinary dividends: $9,872 (reported on 27.9% of returns)
Here:
$9,872
State:
$6,213
(% of AGI for various income ranges: 2.4% for AGIs below $25k, 1.5% for AGIs $25k-50k, 2.8% for AGIs $50k-75k, 3.6% for AGIs $75k-100k, 3.6% for AGIs $100k-200k, 5.8% for AGIs over 200k)
Net capital gain/loss in AGI: +$19,887 (reported on 22.1% of returns)
Here:
+$19,887
State:
+$12,740
(% of AGI for various income ranges: 0.3% for AGIs below $25k, 0.3% for AGIs $25k-50k, 0.8% for AGIs $50k-75k, 1.5% for AGIs $75k-100k, 2.2% for AGIs $100k-200k, 15.1% for AGIs over 200k)
Profit/loss from business: +$15,242 (reported on 17.7% of returns)
Here:
+$15,242
State:
+$10,311
(% of AGI for various income ranges: 7.1% for AGIs below $25k, 2.6% for AGIs $25k-50k, 3.6% for AGIs $50k-75k, 2.3% for AGIs $75k-100k, 3.6% for AGIs $100k-200k, 4.4% for AGIs over 200k)
Taxable individual retirement arrangement distribution: $22,625 (reported on 11.6% of returns)
27705:
$22,625
North Carolina:
$15,575
(% of AGI for various income ranges: 2.3% for AGIs below $25k, 1.8% for AGIs $25k-50k, 3.5% for AGIs $50k-75k, 4.5% for AGIs $75k-100k, 4.9% for AGIs $100k-200k, 3.9% for AGIs over 200k)
Self-employment retirement plans: $27,309 (reported on 2.2% of returns)
27705:
$27,309
North Carolina:
$21,078
(% of AGI for various income ranges: 0.2% for AGIs $25k-50k, 0.2% for AGIs $75k-100k, 0.5% for AGIs $100k-200k, 1.9% for AGIs over 200k)
Total itemized deductions: $27,867 (20% of AGI, reported on 37.6% of returns)
Here:
$27,867
State:
$23,438
Here:
20.2% of AGI
State:
21.5% of AGI
(% of AGI for various income ranges: 10.9% for AGIs below $25k, 10.2% for AGIs $25k-50k, 15.8% for AGIs $50k-75k, 18.7% for AGIs $75k-100k, 18.2% for AGIs $100k-200k, 14.3% for AGIs over 200k)
Charity contributions: $6,099 (reported on 32.9% of returns)
Here:
$6,099
State:
$4,687
(% of AGI for various income ranges: 1.0% for AGIs below $25k, 1.5% for AGIs $25k-50k, 2.4% for AGIs $50k-75k, 2.9% for AGIs $75k-100k, 3.1% for AGIs $100k-200k, 3.7% for AGIs over 200k)
Taxes paid: $11,340 (reported on 37.4% of returns)
27705:
$11,340
State:
$8,823
(% of AGI for various income ranges: 1.6% for AGIs below $25k, 2.5% for AGIs $25k-50k, 4.8% for AGIs $50k-75k, 6.4% for AGIs $75k-100k, 7.7% for AGIs $100k-200k, 7.4% for AGIs over 200k)
Earned income credit: $2,156 (reported on 14.4% of returns)
Here:
$2,156
State:
$2,376
(% of AGI for various income ranges: 5.3% for AGIs below $25k, 0.6% for AGIs $25k-50k)
Percentage of individuals using paid preparers for their 2012 taxes: 46.8%
Here:
47%
State:
53%
(% for various income ranges: 45.1% for AGIs below $25k, 40.6% for AGIs $25k-50k, 45.9% for AGIs $50k-75k, 50.3% for AGIs $75k-100k, 52.6% for AGIs $100k-200k, 69.7% for AGIs over 200k)
Averages for the 2004 tax year for zip code 27705, filed in 2005:
Average Adjusted Gross Income (AGI) in 2004: $57,197 (Individual Income Tax Returns)
Here:
$57,197
State:
$45,376
Salary/wage: $48,315 (reported on 80.2% of returns)
Here:
$48,315
State:
$39,442
(% of AGI for various income ranges: 114.3% for AGIs below $10k, 79.5% for AGIs $10k-25k, 80.9% for AGIs $25k-50k, 72.5% for AGIs $50k-75k, 72.5% for AGIs $75k-100k, 59.5% for AGIs over 100k)
Taxable interest for individuals: $1,966 (reported on 48.6% of returns)
This zip code:
$1,966
North Carolina:
$1,515
(% of AGI for various income ranges: 6.0% for AGIs below $10k, 2.4% for AGIs $10k-25k, 1.5% for AGIs $25k-50k, 1.9% for AGIs $50k-75k, 1.7% for AGIs $75k-100k, 1.5% for AGIs over 100k)
Taxable dividends: $5,833 (reported on 32.6% of returns)
Here:
$5,833
State:
$4,016
(% of AGI for various income ranges: 7.0% for AGIs below $10k, 1.9% for AGIs $10k-25k, 1.9% for AGIs $25k-50k, 3.1% for AGIs $50k-75k, 2.9% for AGIs $75k-100k, 4.0% for AGIs over 100k)
Net capital gain/loss: +$14,288 (reported on 26.6% of returns)
Here:
+$14,288
State:
+$11,152
(% of AGI for various income ranges: -1.4% for AGIs below $10k, 0.5% for AGIs $10k-25k, 1.0% for AGIs $25k-50k, 1.5% for AGIs $50k-75k, 1.9% for AGIs $75k-100k, 11.4% for AGIs over 100k)
Profit/loss from business: +$13,625 (reported on 16.3% of returns)
Here:
+$13,625
State:
+$9,490
(% of AGI for various income ranges: -0.6% for AGIs below $10k, 2.1% for AGIs $10k-25k, 1.9% for AGIs $25k-50k, 3.0% for AGIs $50k-75k, 3.2% for AGIs $75k-100k, 5.1% for AGIs over 100k)
IRA payment deduction: $3,000 (reported on 2.3% of returns)
27705:
$3,000
North Carolina:
$2,967
(% of AGI for various income ranges: 0.3% for AGIs below $10k, 0.2% for AGIs $10k-25k, 0.2% for AGIs $25k-50k, 0.2% for AGIs $50k-75k, 0.1% for AGIs $75k-100k, 0.1% for AGIs over 100k)
Self-employed pension: $16,568 (reported on 2.4% of returns)
Here:
$16,568
North Carolina:
$14,754
(% of AGI for various income ranges: 0.1% for AGIs $10k-25k, 0.1% for AGIs $25k-50k, 0.1% for AGIs $50k-75k, 0.3% for AGIs $75k-100k, 1.2% for AGIs over 100k)
Total itemized deductions: $22,158 (22% of AGI, reported on 43.1% of returns)
Here:
$22,158
State:
$19,464
Here:
21.8% of AGI
State:
22.7% of AGI
(% of AGI for various income ranges: 19.3% for AGIs below $10k, 12.6% for AGIs $10k-25k, 15.1% for AGIs $25k-50k, 19.8% for AGIs $50k-75k, 19.9% for AGIs $75k-100k, 16.3% for AGIs over 100k)
Charity contributions deductions: $5,014 (5% of AGI, reported on 37.9% of returns)
Here:
$5,014
State:
$4,035
Here:
4.6% of AGI
State:
4.5% of AGI
(% of AGI for various income ranges: 1.4% for AGIs below $10k, 1.4% for AGIs $10k-25k, 2.1% for AGIs $25k-50k, 3.5% for AGIs $50k-75k, 3.4% for AGIs $75k-100k, 3.9% for AGIs over 100k)
Total tax: $10,694 (reported on 74.1% of returns)
27705:
$10,694
State:
$7,257
(% of AGI for various income ranges: 3.1% for AGIs below $10k, 3.7% for AGIs $10k-25k, 7.0% for AGIs $25k-50k, 9.7% for AGIs $50k-75k, 10.8% for AGIs $75k-100k, 18.9% for AGIs over 100k)
Earned income credit: $1,697 (reported on 12.7% of returns)
Here:
$1,697
State:
$1,851
Percentage of individuals using paid preparers for their 2004 taxes: 51.4%
Here:
51%
State:
62%
(% for various income ranges: 43.8% for AGIs below $10k, 55.2% for AGIs $10k-25k, 48.0% for AGIs $25k-50k, 51.5% for AGIs $50k-75k, 51.1% for AGIs $75k-100k, 61.6% for AGIs over 100k)
Likely homosexual households (counted as self-reported same-sex unmarried-partner households)
Lesbian couples: 0.6% of all households
Gay men: 0.2% of all households
Household received Food Stamps/SNAP in the past 12 months: 1,615 Household did not receive Food Stamps/SNAP in the past 12 months: 20,305
Women who had a birth in the past 12 months: 298 (235 now married, 64 unmarried) Women who did not have a birth in the past 12 months: 12,589 (3,961 now married, 8,596 unmarried)
Housing units in zip code 27705 with a mortgage: 6,310 (895 second mortgage, 15 home equity loan, 818 both second mortgage and home equity loan) Houses without a mortgage: 192
Median monthly owner costs for units with a mortgage: $1,654 Median monthly owner costs for units without a mortgage: $614
Residents with income below the poverty level in 2022:
This zip code:
16.2%
Whole state:
12.8%
Residents with income below 50% of the poverty level in 2022:
This zip code:
6.3%
Whole state:
6.8%
Median number of rooms in houses and condos:
Here:
6.9
State:
6.4
Median number of rooms in apartments:
Here:
3.7
State:
4.4
Notable locations in this zip code not listed on our city pages
Notable locations in zip code 27705: Duke Homestead (A), Loehmanns Plaza at Croasdaile (B), Washington Duke Inn and Golf Club (C), Clock Tower Court (D), Ninth Street Shopping District (E), Regency Plaza (F), Croasdaile Country Club (G), Levine Science Research Center (H), Fitzpatrick Center for Interdisciplinary Engineering, Medicine and Applied Sciences (I), Joseph M and Kathleen Price Bryan University Center (J), Fuqua Keller Center (K), Trent Hall (L), Teer Engineering Library (M), Sanford Institute (N), Duke Ambulatory Surgery Center (O), John Hope Franklin Center (P), Pickens Building (Q), Perkins Administration Building (R), Few Quadrangle (S), Craven Quadrangle (T). Display/hide their locations on the map
Churches in zip code 27705 include: Westwood Baptist Church (A), The Summit Church (B), The Church of Jesus Christ of Latter Day Saints (C), Saint Lukes Episcopal Church (D), Saint John Baptist Church (E), Mount Olive African Methodist Episcopal Zion Church (F), Mount Gilead Orange Church (G), Mount Bethel Presbyterian Church (H), McMannen United Methodist Church (I). Display/hide their locations on the map
Tourist attractions (not listed on the city page) : Duke University - Libraries- Hours of Opening (2024 West Main Street) (1), McBroom Coach (Tours & Charters; 4203 Station Road) (2). Display/hide their approximate locations on the map
4,962 married couples with children.
2,702 single-parent households (1,007 men, 1,695 women).
79.1% of residents of 27705 zip code speak English at home.
11.8% of residents speak Spanish at home (54% very well, 8% well, 17% not well, 22% not at all).
3.6% of residents speak other Indo-European language at home (88% very well, 7% well, 4% not well, 1% not at all).
4.7% of residents speak Asian or Pacific Island language at home (71% very well, 28% well, 1% not well).
1.0% of residents speak other language at home (70% very well, 27% well, 3% not well).
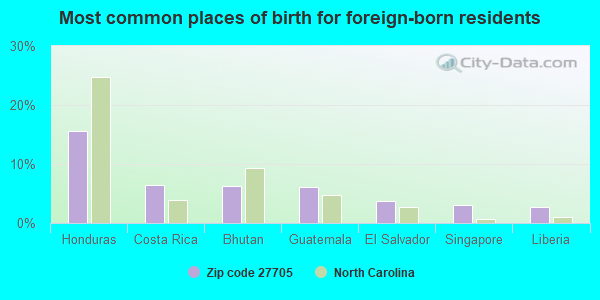
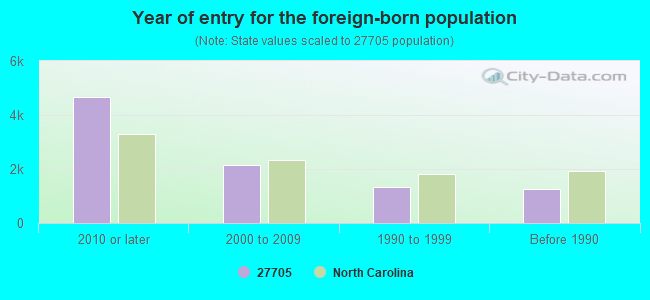
Foreign born population: 8,255 (17.2%) (31.5% of them are naturalized citizens)
Facilities with environmental interests located in this zip code:
CHAO, ISSAC (3038 ROSEWOOD CREEK in DURHAM, NC)
STATE MASTER (North Carolina facility info) - -115DA4YG00N29W84AY3XR7ME1X, WASTEWATER FACILITY National Pollutant Discharge Elimination System NON-MAJOR (Tracking pollutant discharge elimination systems) - permit Business SIC classification: SEWERAGE SYSTEMS Alternative names: CHAO, ISSAC - RESIDENCE, DAMON T VALENTINE RESIDENCE
CARTER COMMUNITY CHARTER (1305 WEST CLUB BLVD in DURHAM, NC)
(National Center for Education Statistics) - STATE ID-0
ACME CLEANERS - NEW BERN (904 NINTH STREET in DURHAM, NC)
AIR MINOR (AIRS/AFS) Business SIC classification: DRYCLEANING PLANTS, EXCEPT RUG CLEANING
ARMIN MEYER - SFR (3510 DONNIGALE AVE in DURHAM, NC)
National Pollutant Discharge Elimination System NON-MAJOR (Tracking pollutant discharge elimination systems) - permit
BERNARD`S FORMAL WEARE INC (734 NINTH ST in DURHAM, NC)
Conditionally Exempt Small Quantity Generators, less than 100 kg/month of hazardous waste (Resource Conservation and Recovery Act (tracking hazardous waste)) - notification Organizations: JEAN LORENZO (CONTACT/OWNER)
Alternative names: BERNARD'S FORMAL WEARE INC
DUKE HOMESTEAD (DUKE HOMESTEAD RD in DURHAM, NC)
Conditionally Exempt Small Quantity Generators, less than 100 kg/month of hazardous waste (Resource Conservation and Recovery Act (tracking hazardous waste)) - notification Organizations: DUKE UNV MEDICAL CTR (CONTACT/OWNER)
DICK PATTON REALTY/PROPERTY MANAGEMENT (3115 GUESS RD in DURHAM, NC)
ENFORCEMENT/COMPLIANCE ACTIVITY (Integrated Compliance Information System)
Housing units lacking complete plumbing facilities: 0.5% Housing units lacking complete kitchen facilities: 2.1%
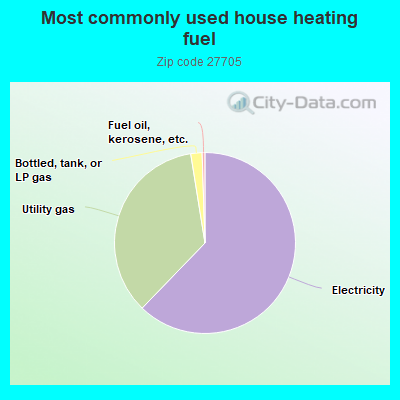
61.6%Electricity
34.9%Utility gas
2.0%Bottled, tank, or LP gas
0.5%Fuel oil, kerosene, etc.
Population in 1990: 32,916. Population change in the 1990s: +7,797 (+23.7%).
Place of birth for U.S.-born residents:
This state: 17,691
Northeast: 7,475
Midwest: 3,830
South: 7,630
West: 2,648
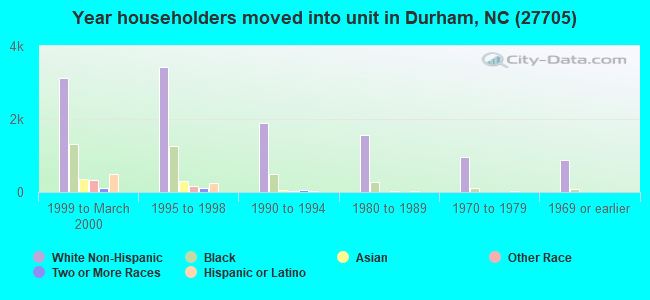
41% of the 27705 zip code residents lived in the same house 5 years ago. Out of people who lived in different houses, 40% lived in this county. Out of people who lived in different counties, 50% lived in North Carolina.
83% of the 27705 zip code residents lived in the same house 1 year ago. Out of people who lived in different houses, 32% moved from this county. Out of people who lived in different houses, 21% moved from different county within same state. Out of people who lived in different houses, 39% moved from different state. Out of people who lived in different houses, 8% moved from abroad.
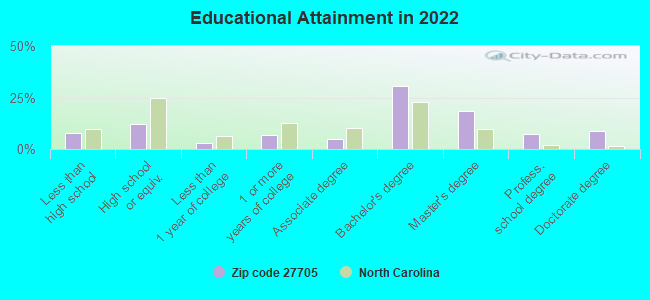
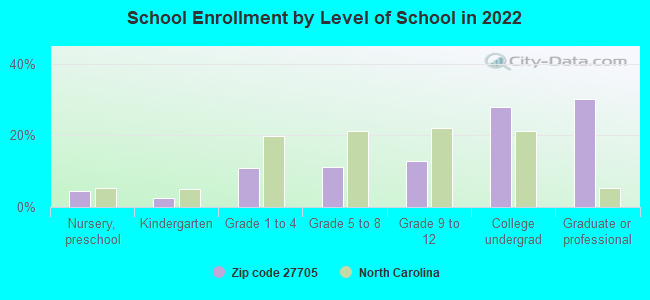
Private vs. public school enrollment:
Students in private schools in grades 1 to 8 (elementary and middle school): 903
Here:
28.8%
North Carolina:
13.8%
Students in private schools in grades 9 to 12 (high school): 606
Here:
32.5%
North Carolina:
11.9%
Students in private undergraduate colleges: 2,708
Here:
68.7%
North Carolina:
19.3%
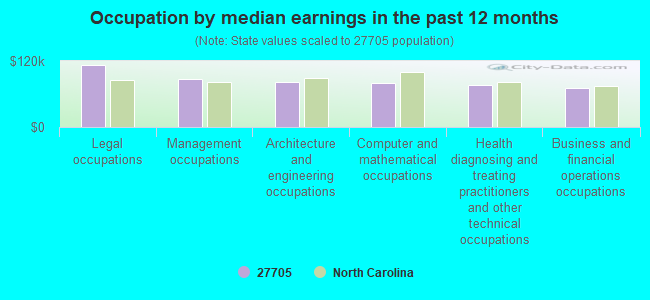
Occupation by median earnings in the past 12 months ($)
113,488Legal occupations
87,780Management occupations
81,613Architecture and engineering occupations
80,229Computer and mathematical occupations
75,809Health diagnosing and treating practitioners and other technical occupations
71,802Business and financial operations occupations
Companies with federal contracts located in this zip code (DURHAM, NC):
PHYAMERICA GOVERNMENT SERVICES (3104 CROASDAILE DRIVE; small business) : $109,157,582 in 576 contractsfrom 1999 to 2006
Contracts for Other Medical Services, General Health Care Services, Gynecology Services, Nursing Services, and moreby Navy, Army, Department of Veterans Affairs Signed by year:2000: $6,475,115; 2001: $9,526,850; 2002: $11,703,312; 2003: $18,323,322; 2004: $22,811,534; 2005: $32,372,780; 2006: $2,949,338.
Biggest contracts:
$3,647,003 with Navy for Other Medical Services. Taking place in FL. Signed on 2004-10-01. Completion date: 2005-09-30.
$3,171,360 with Navy for Other Medical Services. Taking place in WA. Signed on 1999-10-04. Completion date: 2000-09-30.
$2,643,235 with Army for General Health Care Services. Signed on 2003-11-20. Completion date: 2005-06-30.
$2,625,039, same as above.Signed on 2000-04-26. Completion date: 2005-06-30.
PHYAMERICA PHYSICIAN GROUP, IN (2828 CROASDAILE DR) : $8,751,981 in 9 contractsfrom 2000 to 2002
Contracts for Other Medical Services by Navy Signed by year:2000: $7,180,745; 2001: $1,401,707; 2002: $169,529; 2003: $0; 2004: $0; 2005: $0; 2006: $0.
Biggest contracts:
$4,849,630 with Navy for Other Medical Services. Taking place in WA. Signed on 2000-10-01. Completion date: 2001-09-30.
$2,396,500 with Navy for Other Medical Services. Signed on 2000-10-01. Completion date: 2001-09-30.
$1,021,595 with Navy for Other Medical Services. Taking place in MD. Signed on 2001-10-01. Completion date: 2002-09-30.
$339,058, same as above.Signed on 2001-12-20. Completion date: 2002-02-28.
DIVERS ALERT NETWORK, INC. (6 W COLONY PL) : $224,391 in 10 contractsfrom 2002 to 2006
Contracts for Other Research and Development -- Applied Research and Exploratory Development (R&D), Other Medical Services, Miscellaneous Items, Program Management/Support Services, and moreby Navy, Army Signed by year:2000: $0; 2001: $0; 2002: $74,445; 2003: $45,495; 2004: $45,650; 2005: $50,000; 2006: $8,801.
Biggest contracts:
$74,445 with Navy for Other Research and Development -- Applied Research and Exploratory Development (R&D). Signed on 2002-05-10. Completion date: 2004-01-31.
$50,000, same as above.Signed on 2005-03-16. Completion date: 2005-05-31.
$30,304, same as above.Signed on 2003-04-16. Completion date: 2005-05-31.
$15,191 with Navy for Other Medical Services. Signed on 2003-08-11. Completion date: 2004-07-31.
DUKE UNIVERSITY HOSPITAL INCORPORATED (TRENT & ELBA STS) 75 employees, $1100000 revenue: $171,500 in 16 contractsfrom 2003 to 2004
Contracts for Health Services -- Advanced Development (R&D), General Health Care Services by Bureau of Prisoners/Federal Prison System Signed by year:2000: $0; 2001: $0; 2002: $0; 2003: $46,500; 2004: $125,000; 2005: $0; 2006: $0.
Biggest contracts:
$46,500 with Bureau of Prisoners/Federal Prison System for Health Services -- Advanced Development (R&D). Signed on 2003-11-20. Effective on 2003-10-01. Completion date: 2003-12-31.
$46,500, same as above.Signed on 2004-05-10. Completion date: 2004-06-30.
$46,500 with Bureau of Prisoners/Federal Prison System for General Health Care Services. Signed on 2004-01-14. Completion date: 2004-03-31.
$32,000 with Bureau of Prisoners/Federal Prison System for Health Services -- Advanced Development (R&D). Signed on 2004-02-02. Completion date: 2003-12-31.
CURLEY, MICHAEL (4101 RICELAND DRIVE; small business)
$35,050 with Navy for Physical Sciences -- Applied Research and Exploratory Development (R&D). Taking place in FL. Signed on 2004-04-05. Completion date: 2005-04-04.
RAM JACK FOUNDATION REPAIR (4122 BENNETT MEMORIAL RD #) : $28,500 in 2 contractsin 2004
$14,600 with Army for Maintenance, Repair or Alteration of Real Property -- Miscellaneous Buildings. Signed on 2004-09-08. Completion date: 2004-08-02.
$13,900, same as above.Signed on 2004-09-29. Completion date: 2004-08-02.
NORTH CAROLINA DETECTIVE AGENC (1020 BROAD STREET; small business) : $7,680 in 2 contractsin 2001
$5,120 with Army for Guard Services. Signed on 2001-11-02. Completion date: 2001-12-31.
$2,560, same as above.Signed on 2001-12-21. Completion date: 2002-01-31.
BRADY, DAVID (2801 DOGWOOD; small business)
$7,500 with Army for Operations Research and Quantitative Analysis Services. Signed on 2002-07-29. Completion date: 2002-10-31.
HAROLD KOENIG (415 CLARION DR; small business) : $7,000 in 2 contractsfrom 2004 to 2005
$4,000 with Army for Educational Services. Taking place in TX. Signed on 2005-04-21. Completion date: 2005-05-06.
$3,000 with Army for Specialized Medical Services -- Management and Support (R&D). Taking place in TX. Signed on 2004-04-19. Completion date: 2004-04-30.
Top industries in this zip code by the number of employees in 2005:
Health Care and Social Assistance: General Medical and Surgical Hospitals (over 1000 employees: 1 establishment)
Professional, Scientific, and Technical Services: Research and Development in the Physical, Engineering, and Life Sciences (500-999: 1, 100-249: 1, 20-49: 1, 5-9: 1, 1-4: 4)
2004 - 2018 National Fire Incident Reporting System (NFIRS) incidents
According to the data from the years 2004 - 2018 the average number of fires per year is 98. The highest number of reported fires - 148 took place in 2016, and the least - 3 in 2006. The data has a rising trend.
When looking into fire subcategories, the most incidents belonged to: Structure Fires (41.4%), and Outside Fires (32.0%).
Fire incident types reported to NFIRS in Zip Code 27705


 Nearest zip codes: 27707, 27701, 27514, 27712, 27278, 27713.


 According to the data from the years 2004 - 2018 the average number of fires per year is 98. The highest number of reported fires - 148 took place in 2016, and the least - 3 in 2006. The data has a rising trend.
 When looking into fire subcategories, the most incidents belonged to: Structure Fires (41.4%), and Outside Fires (32.0%).