Estimated zip code population in 2022: 23,655 Zip code population in 2010: 20,035 Zip code population in 2000: 17,760
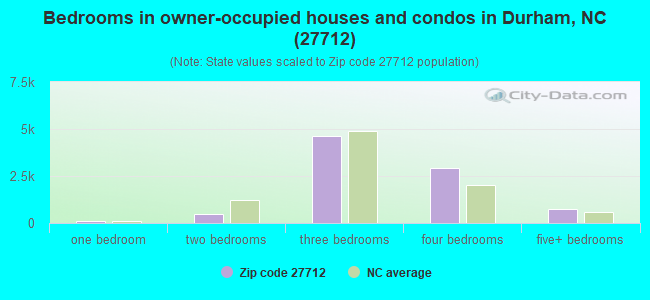
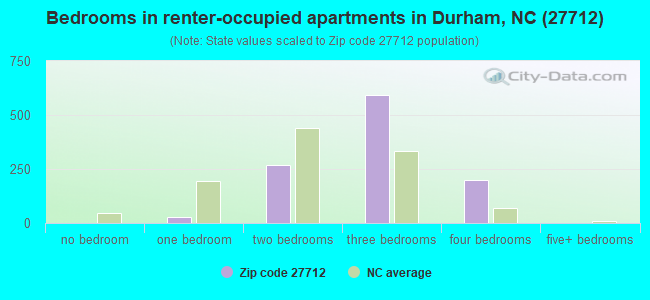
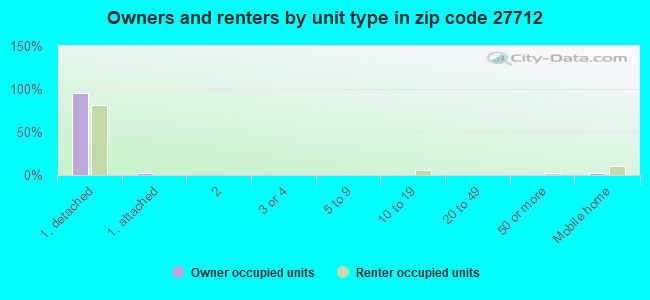
Houses and condos: 10,093 Renter-occupied apartments: 1,085
% of renters here:
11%
State:
33%
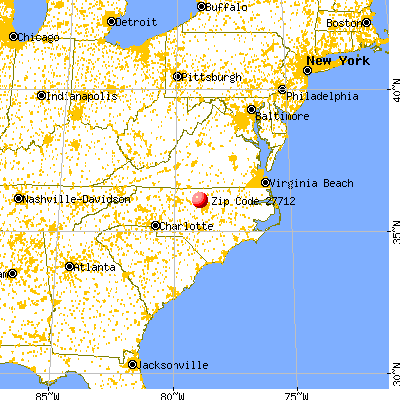
March 2022 cost of living index in zip code 27712: 94.4 (less than average, U.S. average is 100)
Land area: 33.5 sq. mi. Water area: 0.9 sq. mi.
Population density: 707 people per square mile
(low).
OSM Map
General Map
Google Map
MSN Map
OSM Map
General Map
Google Map
MSN Map
OSM Map
General Map
Google Map
MSN Map
OSM Map
General Map
Google Map
MSN Map
Please wait while loading the map...
Real estate property taxes paid for housing units in 2022:
This zip code:
0.8% ($2,852)
North Carolina:
0.6% ($1,769)
Median real estate property taxes paid for housing units with mortgages in 2022: $2,931 (0.8%) Median real estate property taxes paid for housing units with no mortgage in 2022: $2,708 (0.8%)
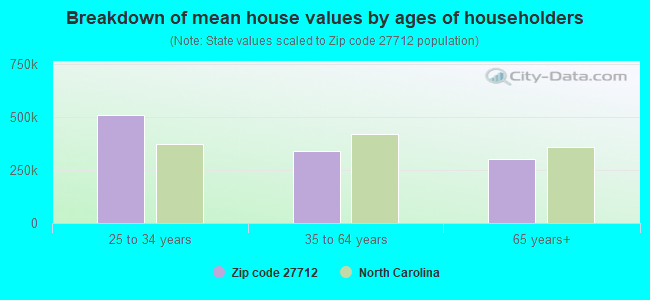
Estimated median house/condo value in 2022: $349,048
27712:
$349,048
North Carolina:
$280,600
According to our research of North Carolina and other state lists, there were 21 registered sex offenders living in 27712 zip code as of April 27, 2024. The ratio of all residents to sex offenders in zip code 27712 is 1,006 to 1. The ratio of registered sex offenders to all residents in this zip code is lower than the state average.
Median resident age:
This zip code:
45.0 years
North Carolina median age:
39.2 years
Average household size:
This zip code:
2.4 people
North Carolina:
2.4 people
Averages for the 2020 tax year for zip code 27712, filed in 2021:
Average Adjusted Gross Income (AGI) in 2020: $88,951 (Individual Income Tax Returns)
Here:
$88,951
State:
$70,020
Salary/wage: $72,383 (reported on 77.9% of returns)
Here:
$72,383
State:
$58,387
(% of AGI for various income ranges: 1148.1% for AGIs below $25k, 3563.9% for AGIs $25k-50k, 6673.6% for AGIs $50k-75k, 9762.0% for AGIs $75k-100k, 19700.1% for AGIs $100k-200k, 67435.5% for AGIs over 200k)
Taxable interest for individuals: $1,263 (reported on 43.2% of returns)
This zip code:
$1,263
North Carolina:
$1,479
(% of AGI for various income ranges: 23.2% for AGIs below $25k, 23.6% for AGIs $25k-50k, 63.0% for AGIs $50k-75k, 73.7% for AGIs $75k-100k, 138.6% for AGIs $100k-200k, 1010.0% for AGIs over 200k)
Ordinary dividends: $6,396 (reported on 27.2% of returns)
Here:
$6,396
State:
$7,888
(% of AGI for various income ranges: 43.8% for AGIs below $25k, 75.8% for AGIs $25k-50k, 146.3% for AGIs $50k-75k, 208.3% for AGIs $75k-100k, 435.1% for AGIs $100k-200k, 3855.0% for AGIs over 200k)
Net capital gain/loss in AGI: +$17,949 (reported on 23.1% of returns)
Here:
+$17,949
State:
+$23,652
(% of AGI for various income ranges: 12.4% for AGIs below $25k, 32.9% for AGIs $25k-50k, 118.8% for AGIs $50k-75k, 204.4% for AGIs $75k-100k, 637.8% for AGIs $100k-200k, 15357.7% for AGIs over 200k)
Profit/loss from business: +$13,004 (reported on 19.8% of returns)
Here:
+$13,004
State:
+$11,710
(% of AGI for various income ranges: 150.2% for AGIs below $25k, 272.1% for AGIs $25k-50k, 221.8% for AGIs $50k-75k, 245.7% for AGIs $75k-100k, 654.7% for AGIs $100k-200k, 4127.3% for AGIs over 200k)
Taxable individual retirement arrangement distribution: $22,782 (reported on 14.0% of returns)
27712:
$22,782
North Carolina:
$20,247
(% of AGI for various income ranges: 89.1% for AGIs below $25k, 221.0% for AGIs $25k-50k, 438.5% for AGIs $50k-75k, 563.0% for AGIs $75k-100k, 1047.0% for AGIs $100k-200k, 3499.5% for AGIs over 200k)
Self-employed (Keogh) retirement plans: $24,009 (reported on 1.0% of returns)
27712:
$24,009
North Carolina:
$26,749
(% of AGI for various income ranges: 44.8% for AGIs $100k-200k, 945.9% for AGIs over 200k)
Total itemized deductions: $30,788 (reported on 14.0% of returns)
Here:
$30,788
State:
$34,549
(% of AGI for various income ranges: 95.6% for AGIs below $25k, 222.2% for AGIs $25k-50k, 548.0% for AGIs $50k-75k, 783.0% for AGIs $75k-100k, 1374.6% for AGIs $100k-200k, 5790.0% for AGIs over 200k)
Charity contributions: $10,694 (reported on 11.7% of returns)
Here:
$10,694
State:
$13,360
(% of AGI for various income ranges: 8.7% for AGIs below $25k, 35.9% for AGIs $25k-50k, 92.2% for AGIs $50k-75k, 158.6% for AGIs $75k-100k, 404.2% for AGIs $100k-200k, 2576.4% for AGIs over 200k)
Taxes paid: $7,527 (reported on 14.0% of returns)
27712:
$7,527
State:
$7,586
(% of AGI for various income ranges: 15.6% for AGIs below $25k, 36.7% for AGIs $25k-50k, 121.7% for AGIs $50k-75k, 204.6% for AGIs $75k-100k, 397.9% for AGIs $100k-200k, 1250.0% for AGIs over 200k)
Earned income credit: $2,054 (reported on 9.1% of returns)
Here:
$2,054
State:
$2,337
(% of AGI for various income ranges: 72.8% for AGIs below $25k, 53.9% for AGIs $25k-50k, 1.0% for AGIs $50k-75k)
Percentage of individuals using paid preparers for their 2020 taxes: 89.8%
Here:
90%
State:
93%
(% for various income ranges: 87.4% for AGIs below $25k, 90.9% for AGIs $25k-50k, 90.3% for AGIs $50k-75k, 89.1% for AGIs $75k-100k, 90.5% for AGIs $100k-200k, 93.0% for AGIs over 200k)
Averages for the 2012 tax year for zip code 27712, filed in 2013:
Average Adjusted Gross Income (AGI) in 2012: $73,045 (Individual Income Tax Returns)
Here:
$73,045
State:
$54,937
Salary/wage: $62,334 (reported on 82.1% of returns)
Here:
$62,334
State:
$46,336
(% of AGI for various income ranges: 68.0% for AGIs below $25k, 72.7% for AGIs $25k-50k, 72.0% for AGIs $50k-75k, 72.4% for AGIs $75k-100k, 77.5% for AGIs $100k-200k, 55.1% for AGIs over 200k)
Taxable interest for individuals: $1,164 (reported on 47.5% of returns)
This zip code:
$1,164
North Carolina:
$1,298
(% of AGI for various income ranges: 1.4% for AGIs below $25k, 0.8% for AGIs $25k-50k, 0.6% for AGIs $50k-75k, 0.7% for AGIs $75k-100k, 0.4% for AGIs $100k-200k, 1.3% for AGIs over 200k)
Ordinary dividends: $4,591 (reported on 28.6% of returns)
Here:
$4,591
State:
$6,213
(% of AGI for various income ranges: 2.6% for AGIs below $25k, 1.2% for AGIs $25k-50k, 1.2% for AGIs $50k-75k, 1.2% for AGIs $75k-100k, 1.2% for AGIs $100k-200k, 3.6% for AGIs over 200k)
Net capital gain/loss in AGI: +$8,945 (reported on 21.6% of returns)
Here:
+$8,945
State:
+$12,740
(% of AGI for various income ranges: 0.4% for AGIs $25k-50k, 0.4% for AGIs $50k-75k, 0.5% for AGIs $75k-100k, 1.3% for AGIs $100k-200k, 9.3% for AGIs over 200k)
Profit/loss from business: +$11,823 (reported on 18.8% of returns)
Here:
+$11,823
State:
+$10,311
(% of AGI for various income ranges: 8.2% for AGIs below $25k, 3.8% for AGIs $25k-50k, 3.0% for AGIs $50k-75k, 2.6% for AGIs $75k-100k, 2.3% for AGIs $100k-200k, 3.1% for AGIs over 200k)
Taxable individual retirement arrangement distribution: $19,528 (reported on 15.2% of returns)
27712:
$19,528
North Carolina:
$15,575
(% of AGI for various income ranges: 5.2% for AGIs below $25k, 4.0% for AGIs $25k-50k, 3.9% for AGIs $50k-75k, 4.3% for AGIs $75k-100k, 4.0% for AGIs $100k-200k, 3.9% for AGIs over 200k)
Self-employment retirement plans: $20,382 (reported on 1.1% of returns)
27712:
$20,382
North Carolina:
$21,078
(% of AGI for various income ranges: 0.2% for AGIs $50k-75k, 0.2% for AGIs $100k-200k, 0.9% for AGIs over 200k)
Total itemized deductions: $23,362 (22% of AGI, reported on 55.4% of returns)
Here:
$23,362
State:
$23,438
Here:
22.0% of AGI
State:
21.5% of AGI
(% of AGI for various income ranges: 20.0% for AGIs below $25k, 17.8% for AGIs $25k-50k, 18.7% for AGIs $50k-75k, 18.5% for AGIs $75k-100k, 17.9% for AGIs $100k-200k, 15.7% for AGIs over 200k)
Charity contributions: $4,718 (reported on 48.6% of returns)
Here:
$4,718
State:
$4,687
(% of AGI for various income ranges: 2.3% for AGIs below $25k, 2.5% for AGIs $25k-50k, 2.9% for AGIs $50k-75k, 3.2% for AGIs $75k-100k, 3.2% for AGIs $100k-200k, 3.7% for AGIs over 200k)
Taxes paid: $9,090 (reported on 55.2% of returns)
27712:
$9,090
State:
$8,823
(% of AGI for various income ranges: 3.7% for AGIs below $25k, 4.5% for AGIs $25k-50k, 6.1% for AGIs $50k-75k, 6.8% for AGIs $75k-100k, 7.8% for AGIs $100k-200k, 7.6% for AGIs over 200k)
Earned income credit: $1,973 (reported on 10.6% of returns)
Here:
$1,973
State:
$2,376
(% of AGI for various income ranges: 4.7% for AGIs below $25k, 0.8% for AGIs $25k-50k)
Percentage of individuals using paid preparers for their 2012 taxes: 46.3%
Here:
46%
State:
53%
(% for various income ranges: 43.1% for AGIs below $25k, 44.3% for AGIs $25k-50k, 45.5% for AGIs $50k-75k, 46.5% for AGIs $75k-100k, 48.6% for AGIs $100k-200k, 69.0% for AGIs over 200k)
Averages for the 2004 tax year for zip code 27712, filed in 2005:
Average Adjusted Gross Income (AGI) in 2004: $64,119 (Individual Income Tax Returns)
Here:
$64,119
State:
$45,376
Salary/wage: $59,311 (reported on 84.1% of returns)
Here:
$59,311
State:
$39,442
(% of AGI for various income ranges: 221.2% for AGIs below $10k, 67.2% for AGIs $10k-25k, 77.6% for AGIs $25k-50k, 77.2% for AGIs $50k-75k, 82.4% for AGIs $75k-100k, 76.1% for AGIs over 100k)
Taxable interest for individuals: $1,492 (reported on 58.0% of returns)
This zip code:
$1,492
North Carolina:
$1,515
(% of AGI for various income ranges: 15.5% for AGIs below $10k, 3.0% for AGIs $10k-25k, 1.5% for AGIs $25k-50k, 1.0% for AGIs $50k-75k, 0.9% for AGIs $75k-100k, 1.3% for AGIs over 100k)
Taxable dividends: $3,737 (reported on 33.7% of returns)
Here:
$3,737
State:
$4,016
(% of AGI for various income ranges: 18.7% for AGIs below $10k, 2.1% for AGIs $10k-25k, 1.3% for AGIs $25k-50k, 1.1% for AGIs $50k-75k, 0.8% for AGIs $75k-100k, 2.8% for AGIs over 100k)
Net capital gain/loss: +$5,039 (reported on 25.8% of returns)
Here:
+$5,039
State:
+$11,152
(% of AGI for various income ranges: -0.8% for AGIs below $10k, 0.2% for AGIs $10k-25k, 0.4% for AGIs $25k-50k, 0.5% for AGIs $50k-75k, 0.7% for AGIs $75k-100k, 3.7% for AGIs over 100k)
Profit/loss from business: +$10,308 (reported on 18.9% of returns)
Here:
+$10,308
State:
+$9,490
(% of AGI for various income ranges: 25.3% for AGIs below $10k, 4.5% for AGIs $10k-25k, 2.6% for AGIs $25k-50k, 3.7% for AGIs $50k-75k, 1.9% for AGIs $75k-100k, 3.0% for AGIs over 100k)
IRA payment deduction: $2,902 (reported on 3.0% of returns)
27712:
$2,902
North Carolina:
$2,967
(% of AGI for various income ranges: 0.8% for AGIs below $10k, 0.3% for AGIs $10k-25k, 0.3% for AGIs $25k-50k, 0.1% for AGIs $50k-75k, 0.1% for AGIs $75k-100k, 0.1% for AGIs over 100k)
Self-employed pension: $17,796 (reported on 1.5% of returns)
Here:
$17,796
North Carolina:
$14,754
(% of AGI for various income ranges: 0.1% for AGIs $25k-50k, 0.1% for AGIs $50k-75k, 0.1% for AGIs $75k-100k, 0.8% for AGIs over 100k)
Total itemized deductions: $20,406 (23% of AGI, reported on 61.3% of returns)
Here:
$20,406
State:
$19,464
Here:
22.6% of AGI
State:
22.7% of AGI
(% of AGI for various income ranges: 60.8% for AGIs below $10k, 19.7% for AGIs $10k-25k, 21.7% for AGIs $25k-50k, 22.3% for AGIs $50k-75k, 21.1% for AGIs $75k-100k, 17.0% for AGIs over 100k)
Charity contributions deductions: $3,835 (4% of AGI, reported on 54.7% of returns)
Here:
$3,835
State:
$4,035
Here:
4.1% of AGI
State:
4.5% of AGI
(% of AGI for various income ranges: 4.3% for AGIs below $10k, 2.7% for AGIs $10k-25k, 3.1% for AGIs $25k-50k, 3.4% for AGIs $50k-75k, 3.6% for AGIs $75k-100k, 3.2% for AGIs over 100k)
Total tax: $9,907 (reported on 82.5% of returns)
27712:
$9,907
State:
$7,257
(% of AGI for various income ranges: 8.9% for AGIs below $10k, 4.4% for AGIs $10k-25k, 6.8% for AGIs $25k-50k, 8.6% for AGIs $50k-75k, 9.9% for AGIs $75k-100k, 17.6% for AGIs over 100k)
Earned income credit: $1,602 (reported on 7.5% of returns)
Here:
$1,602
State:
$1,851
Percentage of individuals using paid preparers for their 2004 taxes: 51.7%
Here:
52%
State:
62%
(% for various income ranges: 46.4% for AGIs below $10k, 53.2% for AGIs $10k-25k, 51.4% for AGIs $25k-50k, 51.4% for AGIs $50k-75k, 49.0% for AGIs $75k-100k, 57.5% for AGIs over 100k)
Likely homosexual households (counted as self-reported same-sex unmarried-partner households)
Lesbian couples: 0.4% of all households
Gay men: 0.0% of all households
Household received Food Stamps/SNAP in the past 12 months: 673 Household did not receive Food Stamps/SNAP in the past 12 months: 9,101
Women who had a birth in the past 12 months: 87 (83 now married, 5 unmarried) Women who did not have a birth in the past 12 months: 4,556 (2,584 now married, 1,984 unmarried)
Housing units in zip code 27712 with a mortgage: 5,665 (586 second mortgage, 509 both second mortgage and home equity loan) Houses without a mortgage: 203
Median monthly owner costs for units with a mortgage: $1,650 Median monthly owner costs for units without a mortgage: $506
Residents with income below the poverty level in 2022:
This zip code:
5.4%
Whole state:
12.8%
Residents with income below 50% of the poverty level in 2022:
This zip code:
2.9%
Whole state:
6.8%
Median number of rooms in houses and condos:
Here:
7.0
State:
6.4
Median number of rooms in apartments:
Here:
5.3
State:
4.4
Notable locations in this zip code not listed on our city pages
Notable locations in zip code 27712: Willowhaven Country Club (A), Durham Fire Station Number 14 (B), Durham Fire Station Number 10 (C). Display/hide their locations on the map
Churches in zip code 27712 include: Three Rivers Baptist Church (A), Temple Baptist Church (B), Springs of Life Bible Church (C), Saint Johns Presbyterian Church (D), Mill Grove Full Gospel Church (E), Korean Presbyterian Church of North Carolina (F), Iglesia Cristiana Renacer (G), Greater Orange Grove Baptist Church (H), Aldersgate United Methodist Church (I). Display/hide their locations on the map
Reservoirs: Willowhaven Lake Number One (A), Eden Lakes (B), Sykes Lake (C), Infinity Rd Raw Water Reservoir (D), Newcombs Lake (E), Willowhaven Lake Number Two (F). Display/hide their locations on the map
In group quarters: 176 (-1 institutionalized population)
Size of family households: 3,593 2-persons, 1,626 3-persons, 993 4-persons, 748 5-persons, 120 6-persons, 47 7-or-more-persons
Size of nonfamily households: 2,415 1-person, 302 2-persons
4,001 married couples with children.
740 single-parent households (311 men, 429 women).
90.9% of residents of 27712 zip code speak English at home.
6.2% of residents speak Spanish at home (63% very well, 10% well, 11% not well, 15% not at all).
0.9% of residents speak other Indo-European language at home (86% very well, 5% well, 9% not well).
1.2% of residents speak Asian or Pacific Island language at home (47% very well, 34% well, 11% not well, 8% not at all).
0.6% of residents speak other language at home (100% very well).
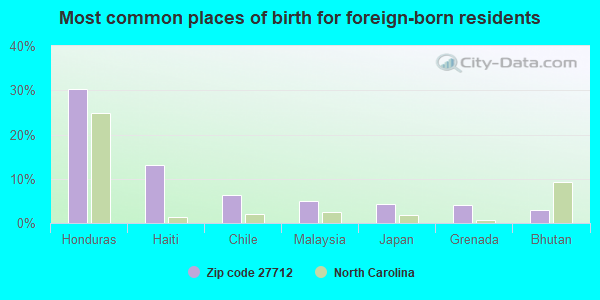
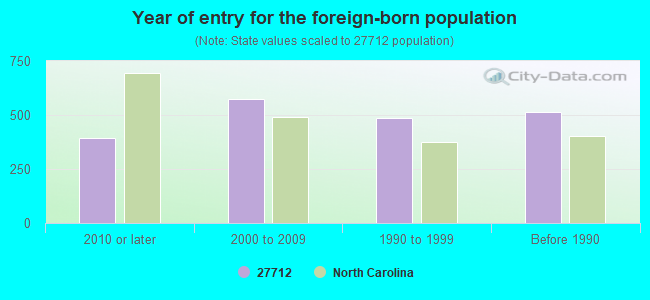
Foreign born population: 1,655 (7.0%) (54.6% of them are naturalized citizens)
Major facilities with environmental interests located in this zip code:
AW NORTH CAROLINA, INC. (4112 OLD OXFORD HIGHWAY in DURHAM, NC)
AIR MINOR (AIRS/AFS) (Integrated Compliance Information System) - ICIS-04-2004-9954, ENFORCEMENT/COMPLIANCE ACTIVITY FORMAL ENFORCEMENT ACTION (Integrated Compliance Information System) - ICIS-04-2004-9954, ENFORCEMENT/COMPLIANCE ACTIVITY STATE MASTER (North Carolina facility info) - AIR PROGRAM TRI REPORTER (Tracking of toxic chemicals releasing facilities) Business SIC classification: MOTOR VEHICLE PARTS AND ACCESSORIES Alternative names: A W NORTH CAROLINA INC
BOWEN, PATTI - RESIDENCE (646 DONLEE ROAD in DURHAM, NC)
STATE MASTER (North Carolina facility info) - -115DA4YG00M69W84AY3V84RTS5, WASTEWATER FACILITY STATE MASTER (North Carolina facility info) - -66AN2CF000YA8DA4A2PX805DA6, WASTEWATER FACILITY National Pollutant Discharge Elimination System NON-MAJOR (Tracking pollutant discharge elimination systems) - permit Business SIC classification: SEWERAGE SYSTEMS Alternative names: BOWEN PATTI SFR, BOWEN RESIDENCE PATTI
ARBOR HILL MHP (4620 REIGALWOOD ROAD in DURHAM, NC)
(Integrated Compliance Information System) - ICIS-04-2000-0617, FORMAL ENFORCEMENT ACTION COMMUNITY WATER SYSTEM (SDWIS) - SDWIS-NC0368108 1T, WATER TREATMENT PLANT Business SIC classification: WATER SUPPLY
BECTON DICKINSON LABWARE (ONE BECTON CIRCLE in DURHAM, NC)
AIR MINOR (AIRS/AFS) STATE MASTER (North Carolina facility info) - AIR PROGRAM CRITERIA AND HAZARDOUS AIR POLLUTANT INVENTORY (Inventory of air pollution sources) Business SIC classification: FABRICATED RUBBER PRODUCTS Business NAICS classification: SURGICAL APPLIANCE AND SUPPLIES MANUFACTURING.; SURGICAL APPLIANCE AND SUPPLIES MANUFACTURING.
BROWN WATER TREATMENT PLANT (1615 INFINITY ROAD in DURHAM, NC)
AIR MINOR (AIRS/AFS) STATE MASTER (North Carolina facility info) - UNDERGROUND STORAGE TANK PROGRAM, AIR PROGRAM CRITERIA AND HAZARDOUS AIR POLLUTANT INVENTORY (Inventory of air pollution sources) Business SIC classification: SEWERAGE SYSTEMS; NONCLASSIFIABLE ESTABLISHMENTS
ADAMS, JOHN M & MIRANDA - RES. (2309 MONT HAVEN DRIVE in DURHAM, NC)
STATE MASTER (North Carolina facility info) - -115DA4YG00M29W84AX3X8CDJPN, WASTEWATER FACILITY National Pollutant Discharge Elimination System NON-MAJOR (Tracking pollutant discharge elimination systems) - permit Business SIC classification: SEWERAGE SYSTEMS Alternative names: ADAMS JOHN M & SHELIA L SFR, TONYA E JACOBS SFR
ALBERT N. SMITH, III (5620 WILLOW DRIVE in DURHAM, NC)
STATE MASTER (North Carolina facility info) - -115DA4YG00M29W84AX3YGAWHY6, WASTEWATER FACILITY National Pollutant Discharge Elimination System NON-MAJOR (Tracking pollutant discharge elimination systems) - permit Business SIC classification: SEWERAGE SYSTEMS Alternative names: SMITH III, ALBERT N
CANUTO, JUAN & MARGARITO - RES (3826 ANGIER AVENUE in DURHAM, NC)
STATE MASTER (North Carolina facility info) - -115DA4YG00M69W84AY3X0B2BRR, WASTEWATER FACILITY National Pollutant Discharge Elimination System NON-MAJOR (Tracking pollutant discharge elimination systems) - permit Business SIC classification: SEWERAGE SYSTEMS
CHARLES VINCENT-RESIDENCE (1017 SNOW HILL ROAD in DURHAM, NC)
STATE MASTER (North Carolina facility info) - -115DA4YG00N61D64FBEM86PWH8, WASTEWATER FACILITY National Pollutant Discharge Elimination System NON-MAJOR (Tracking pollutant discharge elimination systems) - permit Business SIC classification: SEWERAGE SYSTEMS Alternative names: VINCENT, CHARLES
ANSTEAD, CARROLL - RESIDENCE (5729 BIRCH DRIVE in DURHAM, NC)
STATE MASTER (North Carolina facility info) - -115DA4YG00M29W84AX3YR6WQ6M, WASTEWATER FACILITY National Pollutant Discharge Elimination System NON-MAJOR (Tracking pollutant discharge elimination systems) - permit Business SIC classification: SEWERAGE SYSTEMS
ANTINORI, TICIA S (2631 UMSTEAD DR in DURHAM, NC)
STATE MASTER (North Carolina facility info) - -3M05FMYG00CJDWM4913A81A347, WASTEWATER PROGRAM, WASTEWATER FACILITY National Pollutant Discharge Elimination System NON-MAJOR (Tracking pollutant discharge elimination systems) - permit Business SIC classification: NONCLASSIFIABLE ESTABLISHMENTS Alternative names: TICIA S. ANTINORI - RESIDENCE, W. GRANVILLE BATTE - RESIDENCE
DRYMAN, WILLIAM MICHAEL - RES. (728 JONQUIL STREET in DURHAM, NC)
STATE MASTER (North Carolina facility info) - -115DA4YG00T2WW64FBEN0AJ5S8, WASTEWATER FACILITY National Pollutant Discharge Elimination System NON-MAJOR (Tracking pollutant discharge elimination systems) - permit Business SIC classification: SEWERAGE SYSTEMS Alternative names: WILLIAM MICHAEL DRYMAN - SFR
DUNLEVY, JAMES - RESIDENCE (5715 BLUE SPRUCE DRIVE in DURHAM, NC)
STATE MASTER (North Carolina facility info) - -115DA4YG00UAAD84AY3W0FGN4C, WASTEWATER FACILITY National Pollutant Discharge Elimination System NON-MAJOR (Tracking pollutant discharge elimination systems) - permit Business SIC classification: SEWERAGE SYSTEMS
Housing units lacking complete plumbing facilities: 0.9% Housing units lacking complete kitchen facilities: 1.2%
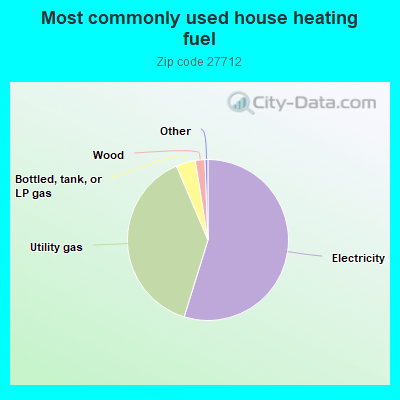
54.8%Electricity
38.8%Utility gas
3.9%Bottled, tank, or LP gas
1.9%Wood
Population in 1990: 15,138. Population change in the 1990s: +2,622 (+17.3%).
Place of birth for U.S.-born residents:
This state: 12,859
Northeast: 2,695
Midwest: 2,063
South: 3,411
West: 579
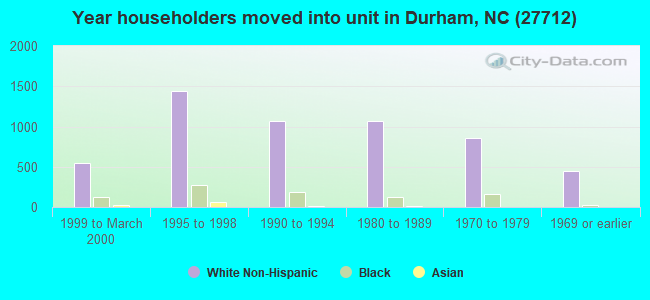
65% of the 27712 zip code residents lived in the same house 5 years ago. Out of people who lived in different houses, 56% lived in this county. Out of people who lived in different counties, 50% lived in North Carolina.
92% of the 27712 zip code residents lived in the same house 1 year ago. Out of people who lived in different houses, 32% moved from this county. Out of people who lived in different houses, 46% moved from different county within same state. Out of people who lived in different houses, 25% moved from different state. Out of people who lived in different houses, 4% moved from abroad.
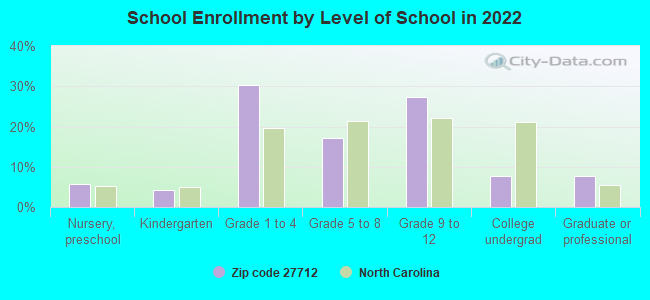
Private vs. public school enrollment:
Students in private schools in grades 1 to 8 (elementary and middle school): 191
Here:
7.0%
North Carolina:
13.8%
Students in private schools in grades 9 to 12 (high school): 305
Here:
19.0%
North Carolina:
11.9%
Students in private undergraduate colleges: 100
Here:
22.3%
North Carolina:
19.3%
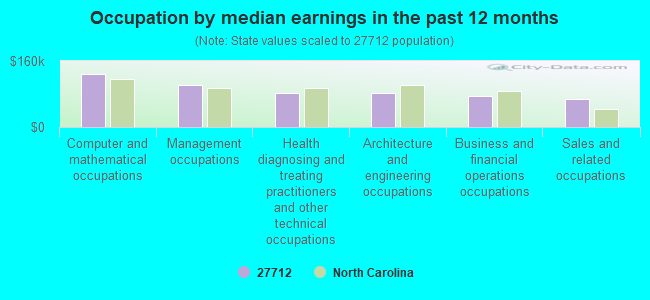
Occupation by median earnings in the past 12 months ($)
128,161Computer and mathematical occupations
102,085Management occupations
83,489Health diagnosing and treating practitioners and other technical occupations
81,974Architecture and engineering occupations
75,570Business and financial operations occupations
66,832Sales and related occupations
Companies with federal contracts located in this zip code:
THE AERO GROUP LTD (3007 TAVISOTCK DRIVE in DURHAM, NC; small business) : $38,365 in 2 contractsin 2003
$35,500 with Air Force for Aircraft Ground Servicing Equipment. Signed on 2003-07-08. Completion date: 2003-08-08.
$2,865 with Air Force for Maintenance, Repair or Alteration of Real Property -- Airport Runways. Taking place in NJ. Signed on 2003-11-25. Completion date: 2003-12-17.
BORAMED, INC (5100 INTERNATIONAL DRIVE in DURHAM, NC; small business)
$5,815 with Army for Pipe, Tube and Rigid Tubing. Signed on 2003-03-19. Completion date: 2003-04-10.
C&H SOLUTIONS, LLC (112 LOBLOLLY DR in DURHAM, NC; small business)
$4,531 with Defense Logistics Agency for Cabinets, Lockers, Bins, and Shelving. Signed on 2005-03-07. Completion date: 2005-03-16.
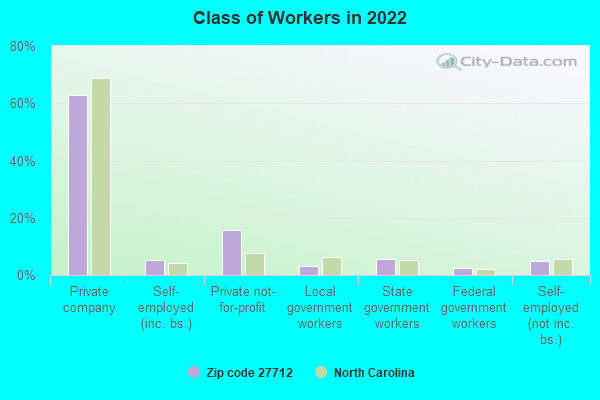
Top industries in this zip code by the number of employees in 2005:
Health Care and Social Assistance: Nursing Care Facilities (100-249 employees: 1 establishment)
Other Services (except Public Administration): Religious Organizations (50-99: 1, 20-49: 1, 10-19: 3, 5-9: 1, 1-4: 3)
2002 - 2018 National Fire Incident Reporting System (NFIRS) incidents
According to the data from the years 2002 - 2018 the average number of fire incidents per year is 62. The highest number of fire incidents - 111 took place in 2015, and the least - 2 in 2008. The data has a rising trend.
When looking into fire subcategories, the most incidents belonged to: Structure Fires (44.1%), and Outside Fires (37.8%).
Fire incident types reported to NFIRS in Zip Code 27712


 Nearest zip codes: 27503, 27704, 27701, 27705, 27509, 27707.


 According to the data from the years 2002 - 2018 the average number of fire incidents per year is 62. The highest number of fire incidents - 111 took place in 2015, and the least - 2 in 2008. The data has a rising trend.
 When looking into fire subcategories, the most incidents belonged to: Structure Fires (44.1%), and Outside Fires (37.8%).