Estimated zip code population in 2022: 6,161 Zip code population in 2010: 3,471 Zip code population in 2000: 3,304
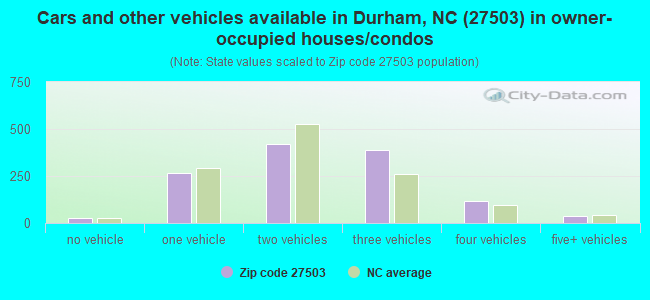
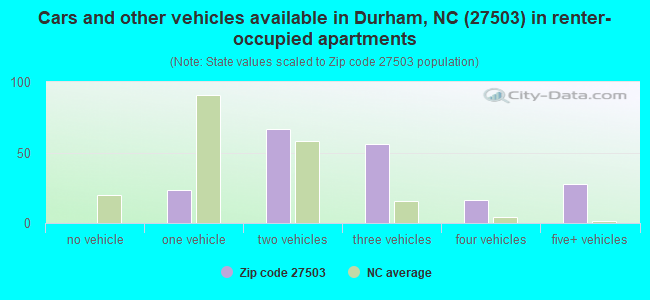
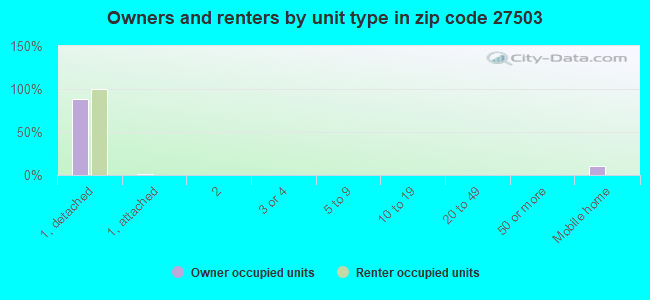
Houses and condos: 1,583 Renter-occupied apartments: 182
% of renters here:
13%
State:
33%
March 2022 cost of living index in zip code 27503: 79.7 (low, U.S. average is 100)
Land area: 36.5 sq. mi. Water area: 1.4 sq. mi.
Population density: 169 people per square mile
(very low).
OSM Map
General Map
Google Map
MSN Map
OSM Map
General Map
Google Map
MSN Map
OSM Map
General Map
Google Map
MSN Map
OSM Map
General Map
Google Map
MSN Map
Please wait while loading the map...
Real estate property taxes paid for housing units in 2022:
This zip code:
0.7% ($2,470)
North Carolina:
0.6% ($1,769)
Median real estate property taxes paid for housing units with mortgages in 2022: $2,779 (0.7%) Median real estate property taxes paid for housing units with no mortgage in 2022: $2,015 (0.8%)
Business Search- 14 Million verified businesses
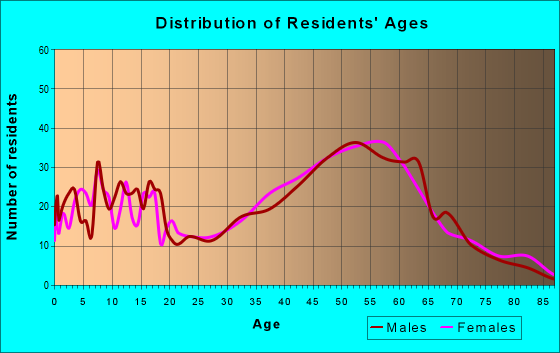
Males: 4,576
(74.4%)
Females: 1,577
(25.6%)
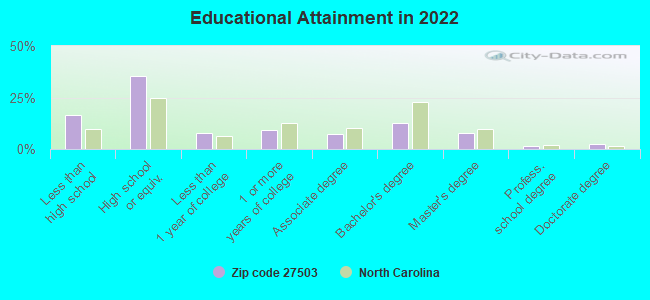
For population 25 years and over in 27503:
High school or higher: 82.6%
Bachelor's degree or higher: 23.6%
Graduate or professional degree: 11.1%
Mean travel time to work (commute): 28.5 minutes
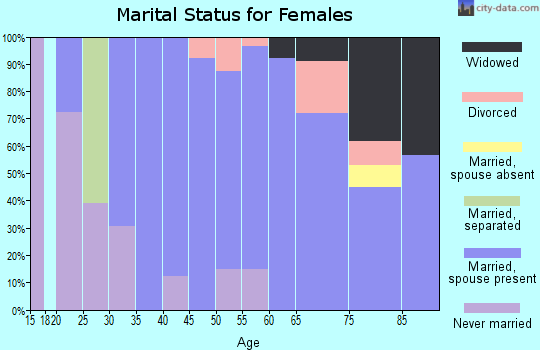
For population 15 years and over in 27503:
Never married: 38.0%
Now married: 38.4%
Separated: 3.9%
Widowed: 4.2%
Divorced: 15.5%
Zip code 27503 compared to state average:
Unemployed percentage significantly below state average.
Median age significantly above state average.
Renting percentage significantly below state average.
Length of stay since moving in significantly above state average.
Estimated median house/condo value in 2022: $375,328
27503:
$375,328
North Carolina:
$280,600
According to our research of North Carolina and other state lists, there were 3 registered sex offenders living in 27503 zip code as of April 27, 2024. The ratio of all residents to sex offenders in zip code 27503 is 2,112 to 1. The ratio of registered sex offenders to all residents in this zip code is much lower than the state average.
Median resident age:
This zip code:
48.4 years
North Carolina median age:
39.2 years
Average household size:
This zip code:
2.1 people
North Carolina:
2.4 people
Averages for the 2020 tax year for zip code 27503, filed in 2021:
Average Adjusted Gross Income (AGI) in 2020: $91,748 (Individual Income Tax Returns)
Here:
$91,748
State:
$70,020
Salary/wage: $74,235 (reported on 77.0% of returns)
Here:
$74,235
State:
$58,387
(% of AGI for various income ranges: 1055.2% for AGIs below $25k, 3709.6% for AGIs $25k-50k, 5928.9% for AGIs $50k-75k, 8516.2% for AGIs $75k-100k, 19581.4% for AGIs $100k-200k, 91523.3% for AGIs over 200k)
Taxable interest for individuals: $1,277 (reported on 48.9% of returns)
This zip code:
$1,277
North Carolina:
$1,479
(% of AGI for various income ranges: 25.2% for AGIs below $25k, 52.6% for AGIs $25k-50k, 35.6% for AGIs $50k-75k, 104.6% for AGIs $75k-100k, 169.5% for AGIs $100k-200k, 1220.0% for AGIs over 200k)
Ordinary dividends: $5,704 (reported on 29.2% of returns)
Here:
$5,704
State:
$7,888
(% of AGI for various income ranges: 64.1% for AGIs below $25k, 106.1% for AGIs $25k-50k, 105.6% for AGIs $50k-75k, 164.6% for AGIs $75k-100k, 363.3% for AGIs $100k-200k, 4606.7% for AGIs over 200k)
Net capital gain/loss in AGI: +$16,045 (reported on 26.4% of returns)
Here:
+$16,045
State:
+$23,652
(% of AGI for various income ranges: 46.7% for AGIs below $25k, 40.4% for AGIs $25k-50k, 139.4% for AGIs $50k-75k, 344.6% for AGIs $75k-100k, 578.1% for AGIs $100k-200k, 18030.0% for AGIs over 200k)
Profit/loss from business: +$15,671 (reported on 21.3% of returns)
Here:
+$15,671
State:
+$11,710
(% of AGI for various income ranges: 213.7% for AGIs below $25k, 412.6% for AGIs $25k-50k, 350.6% for AGIs $50k-75k, 233.8% for AGIs $75k-100k, 830.5% for AGIs $100k-200k, 5833.3% for AGIs over 200k)
Taxable individual retirement arrangement distribution: $22,384 (reported on 14.0% of returns)
27503:
$22,384
North Carolina:
$20,247
(% of AGI for various income ranges: 103.7% for AGIs below $25k, 204.3% for AGIs $25k-50k, 400.6% for AGIs $50k-75k, 379.2% for AGIs $75k-100k, 1193.3% for AGIs $100k-200k, 3753.3% for AGIs over 200k)
Total itemized deductions: $34,836 (reported on 14.0% of returns)
Here:
$34,836
State:
$34,549
(% of AGI for various income ranges: 284.8% for AGIs $25k-50k, 395.6% for AGIs $50k-75k, 687.7% for AGIs $75k-100k, 1623.3% for AGIs $100k-200k, 10130.0% for AGIs over 200k)
Charity contributions: $12,455 (reported on 11.2% of returns)
Here:
$12,455
State:
$13,360
(% of AGI for various income ranges: 38.5% for AGIs below $25k, 54.4% for AGIs $50k-75k, 136.2% for AGIs $75k-100k, 377.1% for AGIs $100k-200k, 4400.0% for AGIs over 200k)
Taxes paid: $8,020 (reported on 14.0% of returns)
27503:
$8,020
State:
$7,586
(% of AGI for various income ranges: 65.7% for AGIs $25k-50k, 82.8% for AGIs $50k-75k, 176.9% for AGIs $75k-100k, 445.7% for AGIs $100k-200k, 1796.7% for AGIs over 200k)
Earned income credit: $1,979 (reported on 7.9% of returns)
Here:
$1,979
State:
$2,337
(% of AGI for various income ranges: 60.7% for AGIs below $25k, 49.1% for AGIs $25k-50k)
Percentage of individuals using paid preparers for their 2020 taxes: 88.2%
Here:
88%
State:
93%
(% for various income ranges: 82.9% for AGIs below $25k, 91.4% for AGIs $25k-50k, 88.5% for AGIs $50k-75k, 90.0% for AGIs $75k-100k, 90.5% for AGIs $100k-200k, 85.7% for AGIs over 200k)
Averages for the 2012 tax year for zip code 27503, filed in 2013:
Average Adjusted Gross Income (AGI) in 2012: $79,827 (Individual Income Tax Returns)
Here:
$79,827
State:
$54,937
Salary/wage: $65,153 (reported on 83.2% of returns)
Here:
$65,153
State:
$46,336
(% of AGI for various income ranges: 67.2% for AGIs below $25k, 78.3% for AGIs $25k-50k, 67.4% for AGIs $50k-75k, 72.0% for AGIs $75k-100k, 76.1% for AGIs $100k-200k, 51.3% for AGIs over 200k)
Taxable interest for individuals: $832 (reported on 49.1% of returns)
This zip code:
$832
North Carolina:
$1,298
(% of AGI for various income ranges: 1.1% for AGIs below $25k, 0.4% for AGIs $25k-50k, 1.1% for AGIs $50k-75k, 0.4% for AGIs $75k-100k, 0.5% for AGIs $100k-200k, 0.3% for AGIs over 200k)
Ordinary dividends: $4,128 (reported on 28.1% of returns)
Here:
$4,128
State:
$6,213
(% of AGI for various income ranges: 1.9% for AGIs below $25k, 0.7% for AGIs $25k-50k, 0.8% for AGIs $50k-75k, 1.2% for AGIs $75k-100k, 1.4% for AGIs $100k-200k, 2.1% for AGIs over 200k)
Net capital gain/loss in AGI: +$4,384 (reported on 22.8% of returns)
Here:
+$4,384
State:
+$12,740
(% of AGI for various income ranges: 2.1% for AGIs $100k-200k, 2.2% for AGIs over 200k)
Profit/loss from business: +$14,615 (reported on 19.8% of returns)
Here:
+$14,615
State:
+$10,311
(% of AGI for various income ranges: 7.8% for AGIs below $25k, 3.9% for AGIs $25k-50k, 3.6% for AGIs $50k-75k, 2.7% for AGIs $75k-100k, 3.4% for AGIs $100k-200k, 3.7% for AGIs over 200k)
Taxable individual retirement arrangement distribution: $20,046 (reported on 14.4% of returns)
27503:
$20,046
North Carolina:
$15,575
(% of AGI for various income ranges: 6.6% for AGIs below $25k, 3.0% for AGIs $25k-50k, 4.2% for AGIs $50k-75k, 4.2% for AGIs $75k-100k, 5.8% for AGIs $100k-200k)
Self-employment retirement plans: $28,733 (reported on 1.8% of returns)
27503:
$28,733
North Carolina:
$21,078
Total itemized deductions: $24,841 (21% of AGI, reported on 55.1% of returns)
Here:
$24,841
State:
$23,438
Here:
21.2% of AGI
State:
21.5% of AGI
(% of AGI for various income ranges: 17.6% for AGIs below $25k, 15.4% for AGIs $25k-50k, 18.0% for AGIs $50k-75k, 18.9% for AGIs $75k-100k, 18.0% for AGIs $100k-200k, 15.3% for AGIs over 200k)
Charity contributions: $4,339 (reported on 47.3% of returns)
Here:
$4,339
State:
$4,687
(% of AGI for various income ranges: 1.7% for AGIs below $25k, 1.7% for AGIs $25k-50k, 2.7% for AGIs $50k-75k, 2.9% for AGIs $75k-100k, 2.4% for AGIs $100k-200k, 3.0% for AGIs over 200k)
Taxes paid: $9,575 (reported on 54.5% of returns)
27503:
$9,575
State:
$8,823
(% of AGI for various income ranges: 3.8% for AGIs below $25k, 4.0% for AGIs $25k-50k, 5.3% for AGIs $50k-75k, 6.1% for AGIs $75k-100k, 7.4% for AGIs $100k-200k, 7.5% for AGIs over 200k)
Earned income credit: $1,887 (reported on 9.0% of returns)
Here:
$1,887
State:
$2,376
(% of AGI for various income ranges: 4.6% for AGIs below $25k, 0.6% for AGIs $25k-50k)
Percentage of individuals using paid preparers for their 2012 taxes: 50.9%
Here:
51%
State:
53%
(% for various income ranges: 40.5% for AGIs below $25k, 50.0% for AGIs $25k-50k, 57.7% for AGIs $50k-75k, 52.4% for AGIs $75k-100k, 51.4% for AGIs $100k-200k, 77.8% for AGIs over 200k)
Averages for the 2004 tax year for zip code 27503, filed in 2005:
Average Adjusted Gross Income (AGI) in 2004: $66,285 (Individual Income Tax Returns)
Here:
$66,285
State:
$45,376
Salary/wage: $57,734 (reported on 83.8% of returns)
Here:
$57,734
State:
$39,442
(% of AGI for various income ranges: 289.6% for AGIs below $10k, 70.8% for AGIs $10k-25k, 79.7% for AGIs $25k-50k, 77.6% for AGIs $50k-75k, 81.4% for AGIs $75k-100k, 66.9% for AGIs over 100k)
Taxable interest for individuals: $1,161 (reported on 57.6% of returns)
This zip code:
$1,161
North Carolina:
$1,515
(% of AGI for various income ranges: 21.2% for AGIs below $10k, 2.1% for AGIs $10k-25k, 1.0% for AGIs $25k-50k, 1.4% for AGIs $50k-75k, 0.7% for AGIs $75k-100k, 0.8% for AGIs over 100k)
Taxable dividends: $2,587 (reported on 31.3% of returns)
Here:
$2,587
State:
$4,016
(% of AGI for various income ranges: 16.3% for AGIs below $10k, 1.8% for AGIs $10k-25k, 0.9% for AGIs $25k-50k, 1.1% for AGIs $50k-75k, 0.5% for AGIs $75k-100k, 1.4% for AGIs over 100k)
Net capital gain/loss: +$15,159 (reported on 27.0% of returns)
Here:
+$15,159
State:
+$11,152
(% of AGI for various income ranges: -10.1% for AGIs below $10k, 0.6% for AGIs $10k-25k, 1.1% for AGIs $25k-50k, -0.2% for AGIs $50k-75k, 1.7% for AGIs $75k-100k, 10.7% for AGIs over 100k)
Profit/loss from business: +$12,573 (reported on 19.4% of returns)
Here:
+$12,573
State:
+$9,490
(% of AGI for various income ranges: -29.8% for AGIs below $10k, 7.7% for AGIs $10k-25k, 6.1% for AGIs $25k-50k, 3.6% for AGIs $50k-75k, 3.4% for AGIs $75k-100k, 3.2% for AGIs over 100k)
IRA payment deduction: $3,283 (reported on 2.9% of returns)
27503:
$3,283
North Carolina:
$2,967
Self-employed pension: $25,636 (reported on 1.4% of returns)
Here:
$25,636
North Carolina:
$14,754
Total itemized deductions: $22,568 (22% of AGI, reported on 53.4% of returns)
Here:
$22,568
State:
$19,464
Here:
21.6% of AGI
State:
22.7% of AGI
(% of AGI for various income ranges: 78.8% for AGIs below $10k, 15.2% for AGIs $10k-25k, 16.9% for AGIs $25k-50k, 22.9% for AGIs $50k-75k, 19.8% for AGIs $75k-100k, 16.6% for AGIs over 100k)
Charity contributions deductions: $4,017 (4% of AGI, reported on 48.5% of returns)
Here:
$4,017
State:
$4,035
Here:
3.7% of AGI
State:
4.5% of AGI
(% of AGI for various income ranges: 4.3% for AGIs below $10k, 1.8% for AGIs $10k-25k, 2.1% for AGIs $25k-50k, 3.0% for AGIs $50k-75k, 3.2% for AGIs $75k-100k, 3.1% for AGIs over 100k)
Total tax: $10,878 (reported on 81.9% of returns)
27503:
$10,878
State:
$7,257
(% of AGI for various income ranges: 9.8% for AGIs below $10k, 4.8% for AGIs $10k-25k, 7.6% for AGIs $25k-50k, 8.4% for AGIs $50k-75k, 10.2% for AGIs $75k-100k, 17.6% for AGIs over 100k)
Earned income credit: $1,496 (reported on 7.3% of returns)
Here:
$1,496
State:
$1,851
Percentage of individuals using paid preparers for their 2004 taxes: 57.0%
Here:
57%
State:
62%
(% for various income ranges: 51.1% for AGIs below $10k, 58.8% for AGIs $10k-25k, 56.8% for AGIs $25k-50k, 59.6% for AGIs $50k-75k, 54.4% for AGIs $75k-100k, 60.5% for AGIs over 100k)
Household received Food Stamps/SNAP in the past 12 months: 83 Household did not receive Food Stamps/SNAP in the past 12 months: 1,335
Women who had a birth in the past 12 months: 21 (22 now married, 0 unmarried) Women who did not have a birth in the past 12 months: 448 (262 now married, 187 unmarried)
Housing units in zip code 27503 with a mortgage: 726 (123 second mortgage, 47 both second mortgage and home equity loan) Houses without a mortgage: 64
Median monthly owner costs for units with a mortgage: $1,740 Median monthly owner costs for units without a mortgage: $546
Residents with income below the poverty level in 2022:
This zip code:
3.8%
Whole state:
12.8%
Residents with income below 50% of the poverty level in 2022:
This zip code:
0.5%
Whole state:
6.8%
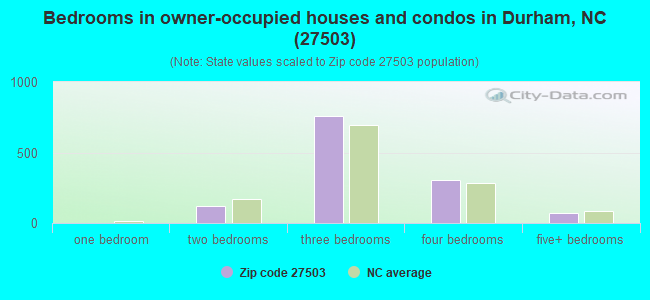
Median number of rooms in houses and condos:
Here:
6.8
State:
6.4
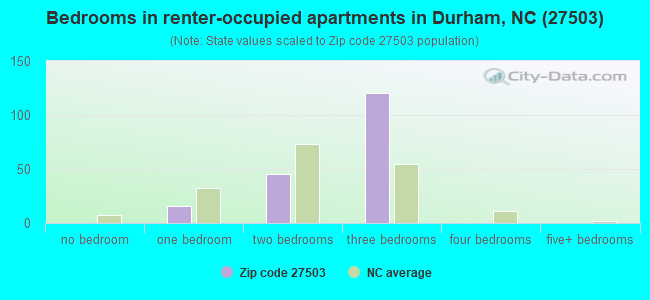
Median number of rooms in apartments:
Here:
5.7
State:
4.4
Notable locations in this zip code not listed on our city pages
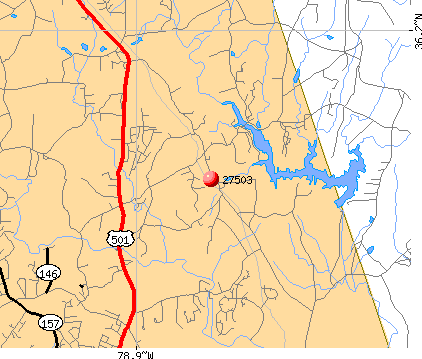
Churches in zip code 27503 include: Union Grove Church (A), Mount Calvert Church (B), Nothern Church (C), Ellis Chapel (D). Display/hide their locations on the map
Rivers and creeks: Dial Creek (A), North Fork Little River (B), Buffalo Creek (C), Dry Creek (D), Rocky Creek (E), South Fork Little River (F), Mountain Creek (G). Display/hide their locations on the map
In group quarters: 3,161 (-1 institutionalized population)
Size of family households: 607 2-persons, 234 3-persons, 59 4-persons, 22 5-persons, 22 6-persons
Size of nonfamily households: 406 1-person, 83 2-persons
340 married couples with children.
21 single-parent households (21 women).
90.5% of residents of 27503 zip code speak English at home.
6.9% of residents speak Spanish at home (62% very well, 24% well, 14% not well).
0.5% of residents speak other Indo-European language at home (25% very well, 75% well).
0.1% of residents speak Asian or Pacific Island language at home (100% well).
1.6% of residents speak other language at home (11% very well, 89% well).
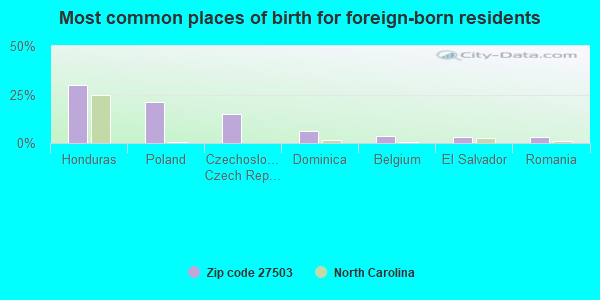
Foreign born population: 422 (6.9%) (49.8% of them are naturalized citizens)
This zip code:
6.9%
Whole state:
8.6%
30%Honduras
21%Poland
15%Czechoslovakia (includes Czech Republic and Slovakia)
6%Dominica
4%Belgium
3%El Salvador
3%Romania
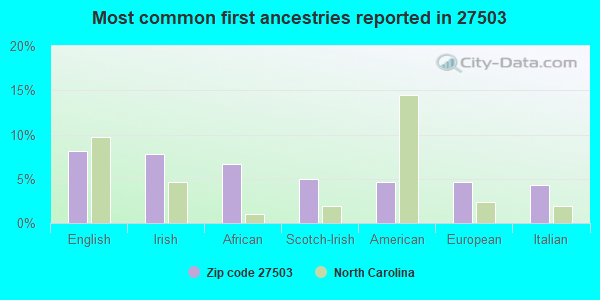
8%English
8%Irish
7%African
5%Scotch-Irish
5%American
5%European
4%Italian
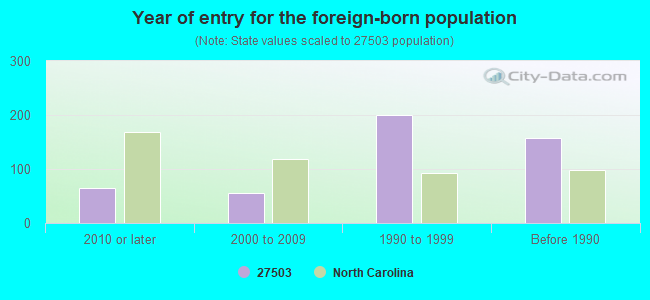
Year of entry for the foreign-born population
642010 or later
562000 to 2009
2001990 to 1999
157Before 1990
Public elementary/middle school in in zip code 27503 not listed on the city page:
Facilities with environmental interests located in this zip code:
B.KELLY & TAMMY ROWSEY RES (2414 ORANGE FACTORY RD in BAHAMA, NC)
STATE MASTER (North Carolina facility info) - -115DA4YG00M29W84AY3WR83F8B, WASTEWATER FACILITY National Pollutant Discharge Elimination System NON-MAJOR (Tracking pollutant discharge elimination systems) - permit Business SIC classification: SEWERAGE SYSTEMS Alternative names: KELLY ROWSEY, B
BRIGGS, JANE & KENNON - RES. (6915 INNESBROOK WAY in BAHAMA, NC)
STATE MASTER (North Carolina facility info) - -66AN2CF000QT8WA4A2PYRB1FT6, WASTEWATER FACILITY National Pollutant Discharge Elimination System NON-MAJOR (Tracking pollutant discharge elimination systems) - permit Business SIC classification: SEWERAGE SYSTEMS
BURGIN, DONALD F (6918 INNESBROOK WAY in BAHAMA, NC)
STATE MASTER (North Carolina facility info) - -66AN2CF000BX8WA4A2PWR9DEA6, WASTEWATER FACILITY National Pollutant Discharge Elimination System NON-MAJOR (Tracking pollutant discharge elimination systems) - permit Business SIC classification: SEWERAGE SYSTEMS Alternative names: BURGIN, DONALD E. - RESIDENCE
CATES, JOHNNY M. - RESIDENCE (6911 INNESBROOK WAY in BAHAMA, NC)
STATE MASTER (North Carolina facility info) - -115DA4YG00NP2W64FBEQR9U7S8, WASTEWATER FACILITY National Pollutant Discharge Elimination System NON-MAJOR (Tracking pollutant discharge elimination systems) - permit Business SIC classification: SEWERAGE SYSTEMS
CLAYTON JAMES & BARBARA RES (8604 ROXBORO ROAD in BAHAMA, NC)
STATE MASTER (North Carolina facility info) - -115DA4YG00PX9W84AY3WR6NV9X, WASTEWATER FACILITY National Pollutant Discharge Elimination System NON-MAJOR (Tracking pollutant discharge elimination systems) - permit Business SIC classification: SEWERAGE SYSTEMS Alternative names: CLAYTON, JAMES
ANN ATWATER COMMUNITY (8307 ROXBORO ROAD in BAHAMA, NC)
(National Center for Education Statistics) - STATE ID-0
BALL ROAD TRAILER (7208 BALL ROAD in BAHAMA, NC)
SUPERFUND (Superfund database) Alternative names: DURHAM ABANDONED DRUMS SITE
Housing units lacking complete plumbing facilities: 2.7%
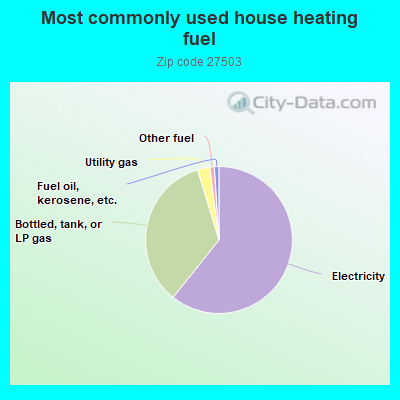
60.8%Electricity
34.6%Bottled, tank, or LP gas
2.7%Utility gas
1.0%Other fuel
1.0%Fuel oil, kerosene, etc.
Population in 1990: 3,276. Population change in the 1990s: +28 (+0.9%).
Place of birth for U.S.-born residents:
This state: 2,829
Northeast: 642
Midwest: 599
South: 1,444
West: 161
65% of the 27503 zip code residents lived in the same house 5 years ago. Out of people who lived in different houses, 60% lived in this county. Out of people who lived in different counties, 50% lived in North Carolina.
76% of the 27503 zip code residents lived in the same house 1 year ago. Out of people who lived in different houses, 5% moved from this county. Out of people who lived in different houses, 75% moved from different county within same state. Out of people who lived in different houses, 22% moved from different state. Out of people who lived in different houses, 1% moved from abroad.
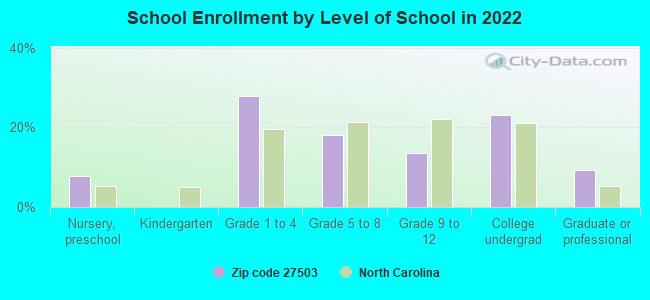
Private vs. public school enrollment:
Students in private schools in grades 1 to 8 (elementary and middle school): 28
Here:
11.8%
North Carolina:
13.8%
Students in private schools in grades 9 to 12 (high school): 1
Here:
1.6%
North Carolina:
11.9%
Students in private undergraduate colleges: 30
Here:
25.7%
North Carolina:
19.3%
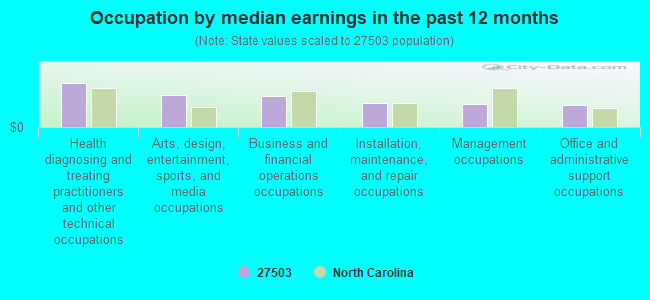
Occupation by median earnings in the past 12 months ($)
110,878Health diagnosing and treating practitioners and other technical occupations
80,432Arts, design, entertainment, sports, and media occupations
78,202Business and financial operations occupations
60,516Installation, maintenance, and repair occupations
58,542Management occupations
55,341Office and administrative support occupations
Companies with federal contracts located in this zip code:
PROMISE MANAGEMENT INC (8809 ROXBORO ROAD in BAHAMA, NC; small business) : $1,107,049 in 29 contractsfrom 2002 to 2005
Contracts for Lodging - Hotel/Motel by Army Signed by year:2000: $0; 2001: $0; 2002: $222,720; 2003: $780,877; 2004: $1,113,498; 2005: -$1,010,046; 2006: $0.
Biggest contracts:
$1,010,100 with Army for Lodging - Hotel/Motel. Signed on 2004-11-16. Completion date: 2004-10-01.
$677,100, same as above.Signed on 2004-06-03. Completion date: 2004-05-27.
$403,820, same as above.Signed on 2003-08-01. Completion date: 2003-11-30.
$301,210, same as above.Signed on 2003-12-10. Completion date: 2003-11-16.
Top industries in this zip code by the number of employees in 2005:
Health Care and Social Assistance: Child Day Care Services (20-49 employees: 1 establishment)
Construction: New Single-Family Housing Construction (except Operative Builders) (5-9: 3, 1-4: 4)
Administrative and Support and Waste Management and Remediation Services: Landscaping Services (10-19: 1, 5-9: 1, 1-4: 3)
Construction: Plumbing, Heating, and Air-Conditioning Contractors (5-9: 2, 1-4: 4)
Other Services (except Public Administration): Religious Organizations (10-19: 1, 1-4: 1)
Health Care and Social Assistance: Ambulance Services (10-19: 1)
Administrative and Support and Waste Management and Remediation Services: Exterminating and Pest Control Services (10-19: 1)
Construction: Site Preparation Contractors (5-9: 1, 1-4: 3)
Construction: Electrical Contractors (1-4: 5)
People in group quarters in 2010:
2 people in group homes for juveniles (non-correctional)
Fatal accident statistics in 2013:
Fatal accident count: 1
Vehicles involved in fatal accidents: 1
Fatal accidents caused by drunken drivers: 0
Fatalities: 1
Persons involved in fatal accidents: 1
Pedestrians involved in fatal accidents: 0
Home Mortgage Disclosure Act Aggregated Statistics For Year 2009 (Based on 6 partial tracts)
A) FHA, FSA/RHS & VA Home Purchase Loans
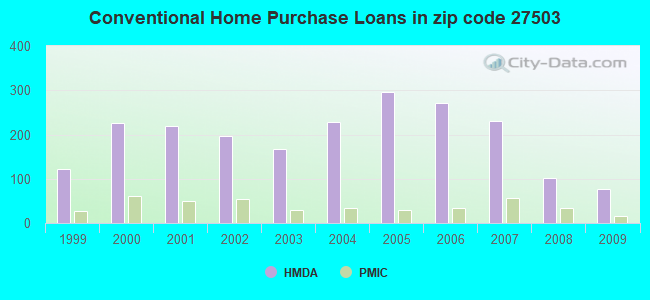
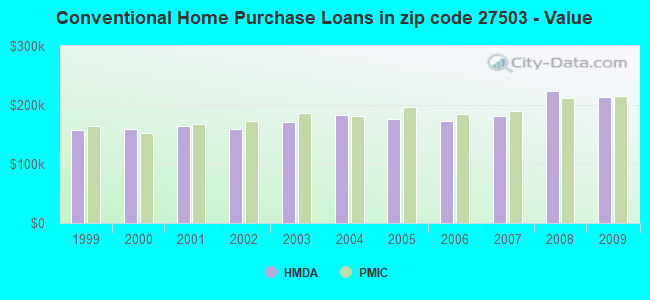
B) Conventional Home Purchase Loans
C) Refinancings
D) Home Improvement Loans
F) Non-occupant Loans on < 5 Family Dwellings (A B C & D)
G) Loans On Manufactured Home Dwelling (A B C & D)
Number
Average Value
Number
Average Value
Number
Average Value
Number
Average Value
Number
Average Value
Number
Average Value
LOANS ORIGINATED
60
$173,248
76
$212,847
371
$200,349
10
$78,762
11
$135,888
10
$139,371
APPLICATIONS APPROVED, NOT ACCEPTED
2
$214,265
3
$188,813
27
$205,024
3
$8,407
0
$0
1
$75,100
APPLICATIONS DENIED
6
$151,295
17
$213,561
108
$209,551
11
$47,891
4
$135,765
2
$69,900
APPLICATIONS WITHDRAWN
5
$183,706
9
$191,028
75
$207,606
4
$104,765
1
$160,120
2
$96,885
FILES CLOSED FOR INCOMPLETENESS
1
$351,700
1
$166,170
27
$208,686
1
$82,980
1
$264,250
1
$98,280
Aggregated Statistics For Year 2008 (Based on 6 partial tracts)
A) FHA, FSA/RHS & VA Home Purchase Loans
B) Conventional Home Purchase Loans
C) Refinancings
D) Home Improvement Loans
F) Non-occupant Loans on < 5 Family Dwellings (A B C & D)
G) Loans On Manufactured Home Dwelling (A B C & D)
Number
Average Value
Number
Average Value
Number
Average Value
Number
Average Value
Number
Average Value
Number
Average Value
LOANS ORIGINATED
29
$183,285
102
$223,148
229
$193,528
22
$77,233
25
$186,038
11
$78,884
APPLICATIONS APPROVED, NOT ACCEPTED
5
$171,852
8
$138,174
38
$186,027
4
$24,578
3
$84,783
3
$91,173
APPLICATIONS DENIED
10
$181,231
19
$202,342
148
$189,246
34
$113,438
7
$145,777
7
$110,749
APPLICATIONS WITHDRAWN
2
$156,130
14
$201,313
60
$214,293
4
$102,332
5
$184,920
3
$71,393
FILES CLOSED FOR INCOMPLETENESS
1
$198,640
7
$270,637
11
$172,467
1
$34,570
2
$188,805
0
$0
Aggregated Statistics For Year 2007 (Based on 6 partial tracts)
A) FHA, FSA/RHS & VA Home Purchase Loans
B) Conventional Home Purchase Loans
C) Refinancings
D) Home Improvement Loans
F) Non-occupant Loans on < 5 Family Dwellings (A B C & D)
G) Loans On Manufactured Home Dwelling (A B C & D)
Number
Average Value
Number
Average Value
Number
Average Value
Number
Average Value
Number
Average Value
Number
Average Value
LOANS ORIGINATED
18
$156,908
230
$180,509
232
$188,385
25
$81,527
43
$135,487
6
$85,952
APPLICATIONS APPROVED, NOT ACCEPTED
0
$0
24
$146,490
48
$136,470
10
$59,578
7
$99,626
5
$68,078
APPLICATIONS DENIED
1
$215,990
32
$272,951
189
$188,619
34
$83,032
9
$233,168
7
$64,950
APPLICATIONS WITHDRAWN
1
$376,890
23
$263,513
101
$202,780
5
$145,952
6
$155,852
1
$94,570
FILES CLOSED FOR INCOMPLETENESS
0
$0
5
$286,614
15
$216,866
0
$0
0
$0
0
$0
Aggregated Statistics For Year 2006 (Based on 6 partial tracts)
A) FHA, FSA/RHS & VA Home Purchase Loans
B) Conventional Home Purchase Loans
C) Refinancings
D) Home Improvement Loans
F) Non-occupant Loans on < 5 Family Dwellings (A B C & D)
G) Loans On Manufactured Home Dwelling (A B C & D)
Number
Average Value
Number
Average Value
Number
Average Value
Number
Average Value
Number
Average Value
Number
Average Value
LOANS ORIGINATED
15
$168,020
272
$172,222
271
$156,341
26
$70,503
38
$195,622
16
$70,154
APPLICATIONS APPROVED, NOT ACCEPTED
1
$90,870
19
$116,045
53
$145,267
3
$22,770
7
$93,034
5
$70,716
APPLICATIONS DENIED
2
$103,735
38
$193,750
173
$183,799
30
$68,054
10
$680,481
8
$92,485
APPLICATIONS WITHDRAWN
2
$91,755
22
$220,432
97
$152,454
2
$133,260
2
$154,410
0
$0
FILES CLOSED FOR INCOMPLETENESS
0
$0
5
$221,056
33
$181,562
0
$0
2
$209,105
0
$0
Aggregated Statistics For Year 2005 (Based on 6 partial tracts)
A) FHA, FSA/RHS & VA Home Purchase Loans
B) Conventional Home Purchase Loans
C) Refinancings
D) Home Improvement Loans
F) Non-occupant Loans on < 5 Family Dwellings (A B C & D)
G) Loans On Manufactured Home Dwelling (A B C & D)
Number
Average Value
Number
Average Value
Number
Average Value
Number
Average Value
Number
Average Value
Number
Average Value
LOANS ORIGINATED
17
$121,032
296
$175,808
274
$163,252
32
$72,909
36
$125,820
10
$64,762
APPLICATIONS APPROVED, NOT ACCEPTED
0
$0
19
$148,327
47
$134,652
7
$46,456
4
$117,862
3
$50,377
APPLICATIONS DENIED
2
$82,740
27
$151,780
177
$166,602
34
$66,697
3
$111,593
13
$79,378
APPLICATIONS WITHDRAWN
2
$123,170
26
$176,987
95
$170,192
13
$138,112
4
$419,402
1
$107,130
FILES CLOSED FOR INCOMPLETENESS
0
$0
6
$193,370
48
$200,923
0
$0
0
$0
2
$82,845
Aggregated Statistics For Year 2004 (Based on 6 partial tracts)
A) FHA, FSA/RHS & VA Home Purchase Loans
B) Conventional Home Purchase Loans
C) Refinancings
D) Home Improvement Loans
F) Non-occupant Loans on < 5 Family Dwellings (A B C & D)
G) Loans On Manufactured Home Dwelling (A B C & D)
Number
Average Value
Number
Average Value
Number
Average Value
Number
Average Value
Number
Average Value
Number
Average Value
LOANS ORIGINATED
16
$144,763
228
$182,311
318
$162,905
17
$91,276
35
$156,641
6
$76,853
APPLICATIONS APPROVED, NOT ACCEPTED
0
$0
23
$158,016
43
$175,173
5
$29,970
6
$162,608
0
$0
APPLICATIONS DENIED
1
$114,150
32
$152,992
168
$165,663
26
$35,903
10
$182,309
8
$99,794
APPLICATIONS WITHDRAWN
1
$178,400
17
$194,229
138
$176,873
3
$80,197
8
$131,579
4
$100,728
FILES CLOSED FOR INCOMPLETENESS
1
$104,350
3
$364,380
41
$185,831
1
$44,000
0
$0
1
$95,500
Aggregated Statistics For Year 2003 (Based on 6 partial tracts)
A) FHA, FSA/RHS & VA Home Purchase Loans
B) Conventional Home Purchase Loans
C) Refinancings
D) Home Improvement Loans
F) Non-occupant Loans on < 5 Family Dwellings (A B C & D)
Number
Average Value
Number
Average Value
Number
Average Value
Number
Average Value
Number
Average Value
LOANS ORIGINATED
23
$150,050
167
$171,380
843
$168,934
22
$51,861
38
$117,664
APPLICATIONS APPROVED, NOT ACCEPTED
2
$161,000
16
$125,582
73
$167,025
9
$17,073
1
$76,690
APPLICATIONS DENIED
2
$142,790
24
$201,681
187
$175,841
22
$23,158
5
$143,392
APPLICATIONS WITHDRAWN
3
$113,147
22
$168,423
119
$186,424
6
$97,255
4
$175,088
FILES CLOSED FOR INCOMPLETENESS
2
$120,655
2
$446,130
32
$204,958
0
$0
0
$0
Aggregated Statistics For Year 2002 (Based on 6 partial tracts)
A) FHA, FSA/RHS & VA Home Purchase Loans
B) Conventional Home Purchase Loans
C) Refinancings
D) Home Improvement Loans
F) Non-occupant Loans on < 5 Family Dwellings (A B C & D)
Number
Average Value
Number
Average Value
Number
Average Value
Number
Average Value
Number
Average Value
LOANS ORIGINATED
30
$138,116
197
$159,311
577
$170,333
23
$35,071
31
$111,526
APPLICATIONS APPROVED, NOT ACCEPTED
2
$109,060
26
$184,938
64
$145,156
8
$32,790
2
$433,670
APPLICATIONS DENIED
4
$154,032
35
$120,696
114
$143,312
17
$30,811
2
$122,960
APPLICATIONS WITHDRAWN
1
$194,240
12
$122,067
94
$140,470
8
$22,181
4
$149,902
FILES CLOSED FOR INCOMPLETENESS
2
$120,815
9
$180,804
17
$151,643
1
$25,360
0
$0
Aggregated Statistics For Year 2001 (Based on 6 partial tracts)
A) FHA, FSA/RHS & VA Home Purchase Loans
B) Conventional Home Purchase Loans
C) Refinancings
D) Home Improvement Loans
F) Non-occupant Loans on < 5 Family Dwellings (A B C & D)
Number
Average Value
Number
Average Value
Number
Average Value
Number
Average Value
Number
Average Value
LOANS ORIGINATED
51
$137,103
220
$164,745
489
$156,135
30
$38,667
34
$123,510
APPLICATIONS APPROVED, NOT ACCEPTED
4
$127,078
20
$120,556
42
$136,852
6
$17,835
1
$64,900
APPLICATIONS DENIED
3
$153,183
26
$98,770
111
$135,096
18
$19,851
4
$128,420
APPLICATIONS WITHDRAWN
4
$115,350
19
$160,392
78
$146,002
9
$41,418
1
$216,290
FILES CLOSED FOR INCOMPLETENESS
0
$0
5
$268,672
16
$168,042
0
$0
1
$119,300
Aggregated Statistics For Year 2000 (Based on 6 partial tracts)
A) FHA, FSA/RHS & VA Home Purchase Loans
B) Conventional Home Purchase Loans
C) Refinancings
D) Home Improvement Loans
F) Non-occupant Loans on < 5 Family Dwellings (A B C & D)
Number
Average Value
Number
Average Value
Number
Average Value
Number
Average Value
Number
Average Value
LOANS ORIGINATED
36
$134,827
227
$158,857
109
$138,027
24
$26,130
9
$103,186
APPLICATIONS APPROVED, NOT ACCEPTED
3
$67,483
28
$87,938
33
$118,884
8
$51,926
2
$125,005
APPLICATIONS DENIED
6
$88,075
71
$103,195
90
$107,073
14
$41,110
3
$86,883
APPLICATIONS WITHDRAWN
3
$109,097
26
$155,164
43
$99,649
3
$59,927
3
$87,457
FILES CLOSED FOR INCOMPLETENESS
1
$64,120
4
$110,340
10
$126,390
1
$48,450
1
$370,880
Aggregated Statistics For Year 1999 (Based on 3 partial tracts)
A) FHA, FSA/RHS & VA Home Purchase Loans
B) Conventional Home Purchase Loans
C) Refinancings
D) Home Improvement Loans
F) Non-occupant Loans on < 5 Family Dwellings (A B C & D)
2002 - 2016 National Fire Incident Reporting System (NFIRS) incidents
Based on the data from the years 2002 - 2016 the average number of fires per year is 15. The highest number of reported fires - 27 took place in 2010, and the least - 2 in 2008. The data has a dropping trend.
When looking into fire subcategories, the most reports belonged to: Outside Fires (43.1%), and Structure Fires (42.2%).
Fire incident types reported to NFIRS in Zip Code 27503


 Nearest zip codes: 27712, 27572, 27509, 27704, 27583, 27701.
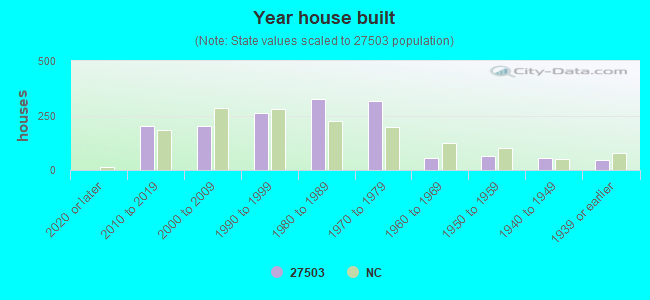


 (Location: 9008 QUAIL ROOST ROAD, Grades: KG-5)
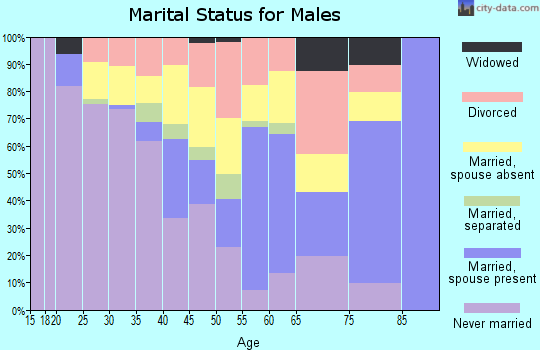
 Based on the data from the years 2002 - 2016 the average number of fires per year is 15. The highest number of reported fires - 27 took place in 2010, and the least - 2 in 2008. The data has a dropping trend.
 When looking into fire subcategories, the most reports belonged to: Outside Fires (43.1%), and Structure Fires (42.2%).