Estimated zip code population in 2022: 15,277
Zip code population in 2010: 15,052
Zip code population in 2000: 15,263
Houses and condos: 6,147
Renter-occupied apartments: 647
% of renters here:
11%State:
33%
March 2022 cost of living index in zip code 27370: 79.9
(low, U.S. average is 100)
Land area: 60.4
sq. mi.
Water area: 0.3
sq. mi.
Population density: 253 people per square mile (very low).
OSM Map
General Map
Google Map
MSN Map
OSM Map
General Map
Google Map
MSN Map
OSM Map
General Map
Google Map
MSN Map
OSM Map
General Map
Google Map
MSN Map
Please wait while loading the map...
Real estate property taxes paid for housing units in 2022:
This zip code:
0.7% ($1,227)North Carolina:
0.6% ($1,769)
Median real estate property taxes paid for housing units with mortgages in 2022: $1,343 (0.6%)
Median real estate property taxes paid for housing units with no mortgage in 2022: $1,058 (0.7%)
Business Search - 14 Million verified businesses
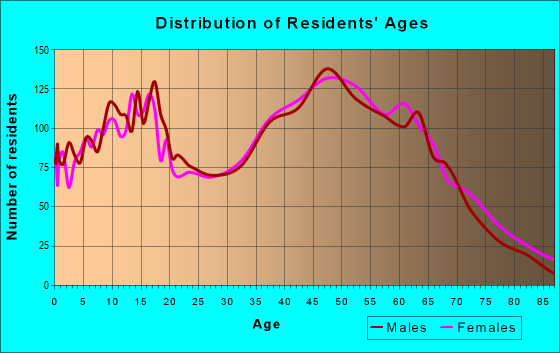
Males: 7,595 Females: 7,681
For population 25 years and over in 27370:
High school or higher: 88.8%Bachelor's degree or higher: 17.9%Graduate or professional degree: 5.8%Unemployed: 1.6%Mean travel time to work (commute): 25.3 minutes
For population 15 years and over in 27370:
Never married: 23.9%Now married: 57.8%Separated: 1.6%Widowed: 5.5%Divorced: 11.3%
Zip code 27370 compared to state average:
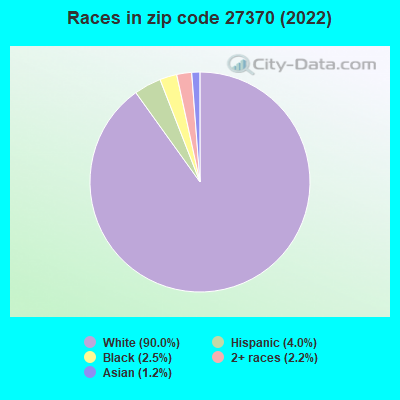
Unemployed percentage below state average. Black race population percentage significantly below state average. Hispanic race population percentage below state average. Foreign-born population percentage significantly below state average. Renting percentage significantly below state average. Length of stay since moving in significantly above state average. Percentage of population with a bachelor's degree or higher below state average. 13,746 90.0% White 610 4.0% Hispanic or Latino 384 2.5% Black 335 2.2% Two or more races 186 1.2% Asian 14 0.09% American Indian
Data:
Median household income ($)
Median household income (% change since 2000)
Household income diversity
Ratio of average income to average house value (%)
Ratio of average income to average rent
Median household income ($) - White
Median household income ($) - Black or African American
Median household income ($) - Asian
Median household income ($) - Hispanic or Latino
Median household income ($) - American Indian and Alaska Native
Median household income ($) - Multirace
Median household income ($) - Other Race
Median household income for houses/condos with a mortgage ($)
Median household income for apartments without a mortgage ($)
Races - White alone (%)
Races - White alone (% change since 2000)
Races - Black alone (%)
Races - Black alone (% change since 2000)
Races - American Indian alone (%)
Races - American Indian alone (% change since 2000)
Races - Asian alone (%)
Races - Asian alone (% change since 2000)
Races - Hispanic (%)
Races - Hispanic (% change since 2000)
Races - Native Hawaiian and Other Pacific Islander alone (%)
Races - Native Hawaiian and Other Pacific Islander alone (% change since 2000)
Races - Two or more races (%)
Races - Two or more races (% change since 2000)
Races - Other race alone (%)
Races - Other race alone (% change since 2000)
Racial diversity
Unemployment (%)
Unemployment (% change since 2000)
Unemployment (%) - White
Unemployment (%) - Black or African American
Unemployment (%) - Asian
Unemployment (%) - Hispanic or Latino
Unemployment (%) - American Indian and Alaska Native
Unemployment (%) - Multirace
Unemployment (%) - Other Race
Population density (people per square mile)
Population - Males (%)
Population - Females (%)
Population - Males (%) - White
Population - Males (%) - Black or African American
Population - Males (%) - Asian
Population - Males (%) - Hispanic or Latino
Population - Males (%) - American Indian and Alaska Native
Population - Males (%) - Multirace
Population - Males (%) - Other Race
Population - Females (%) - White
Population - Females (%) - Black or African American
Population - Females (%) - Asian
Population - Females (%) - Hispanic or Latino
Population - Females (%) - American Indian and Alaska Native
Population - Females (%) - Multirace
Population - Females (%) - Other Race
Coronavirus confirmed cases (Apr 27, 2024)
Deaths caused by coronavirus (Apr 27, 2024)
Coronavirus confirmed cases (per 100k population) (Apr 27, 2024)
Deaths caused by coronavirus (per 100k population) (Apr 27, 2024)
Daily increase in number of cases (Apr 27, 2024)
Weekly increase in number of cases (Apr 27, 2024)
Cases doubled (in days) (Apr 27, 2024)
Hospitalized patients (Apr 18, 2022)
Negative test results (Apr 18, 2022)
Total test results (Apr 18, 2022)
COVID Vaccine doses distributed (per 100k population) (Sep 19, 2023)
COVID Vaccine doses administered (per 100k population) (Sep 19, 2023)
COVID Vaccine doses distributed (Sep 19, 2023)
COVID Vaccine doses administered (Sep 19, 2023)
Likely homosexual households (%)
Likely homosexual households (% change since 2000)
Likely homosexual households - Lesbian couples (%)
Likely homosexual households - Lesbian couples (% change since 2000)
Likely homosexual households - Gay men (%)
Likely homosexual households - Gay men (% change since 2000)
Cost of living index
Median gross rent ($)
Median contract rent ($)
Median monthly housing costs ($)
Median house or condo value ($)
Median house or condo value ($ change since 2000)
Mean house or condo value by units in structure - 1, detached ($)
Mean house or condo value by units in structure - 1, attached ($)
Mean house or condo value by units in structure - 2 ($)
Mean house or condo value by units in structure by units in structure - 3 or 4 ($)
Mean house or condo value by units in structure - 5 or more ($)
Mean house or condo value by units in structure - Boat, RV, van, etc. ($)
Mean house or condo value by units in structure - Mobile home ($)
Median house or condo value ($) - White
Median house or condo value ($) - Black or African American
Median house or condo value ($) - Asian
Median house or condo value ($) - Hispanic or Latino
Median house or condo value ($) - American Indian and Alaska Native
Median house or condo value ($) - Multirace
Median house or condo value ($) - Other Race
Median resident age
Resident age diversity
Median resident age - Males
Median resident age - Females
Median resident age - White
Median resident age - Black or African American
Median resident age - Asian
Median resident age - Hispanic or Latino
Median resident age - American Indian and Alaska Native
Median resident age - Multirace
Median resident age - Other Race
Median resident age - Males - White
Median resident age - Males - Black or African American
Median resident age - Males - Asian
Median resident age - Males - Hispanic or Latino
Median resident age - Males - American Indian and Alaska Native
Median resident age - Males - Multirace
Median resident age - Males - Other Race
Median resident age - Females - White
Median resident age - Females - Black or African American
Median resident age - Females - Asian
Median resident age - Females - Hispanic or Latino
Median resident age - Females - American Indian and Alaska Native
Median resident age - Females - Multirace
Median resident age - Females - Other Race
Commute - mean travel time to work (minutes)
Travel time to work - Less than 5 minutes (%)
Travel time to work - Less than 5 minutes (% change since 2000)
Travel time to work - 5 to 9 minutes (%)
Travel time to work - 5 to 9 minutes (% change since 2000)
Travel time to work - 10 to 19 minutes (%)
Travel time to work - 10 to 19 minutes (% change since 2000)
Travel time to work - 20 to 29 minutes (%)
Travel time to work - 20 to 29 minutes (% change since 2000)
Travel time to work - 30 to 39 minutes (%)
Travel time to work - 30 to 39 minutes (% change since 2000)
Travel time to work - 40 to 59 minutes (%)
Travel time to work - 40 to 59 minutes (% change since 2000)
Travel time to work - 60 to 89 minutes (%)
Travel time to work - 60 to 89 minutes (% change since 2000)
Travel time to work - 90 or more minutes (%)
Travel time to work - 90 or more minutes (% change since 2000)
Marital status - Never married (%)
Marital status - Now married (%)
Marital status - Separated (%)
Marital status - Widowed (%)
Marital status - Divorced (%)
Median family income ($)
Median family income (% change since 2000)
Median non-family income ($)
Median non-family income (% change since 2000)
Median per capita income ($)
Median per capita income (% change since 2000)
Median family income ($) - White
Median family income ($) - Black or African American
Median family income ($) - Asian
Median family income ($) - Hispanic or Latino
Median family income ($) - American Indian and Alaska Native
Median family income ($) - Multirace
Median family income ($) - Other Race
Median year house/condo built
Median year apartment built
Year house built - Built 2005 or later (%)
Year house built - Built 2000 to 2004 (%)
Year house built - Built 1990 to 1999 (%)
Year house built - Built 1980 to 1989 (%)
Year house built - Built 1970 to 1979 (%)
Year house built - Built 1960 to 1969 (%)
Year house built - Built 1950 to 1959 (%)
Year house built - Built 1940 to 1949 (%)
Year house built - Built 1939 or earlier (%)
Average household size
Household density (households per square mile)
Average household size - White
Average household size - Black or African American
Average household size - Asian
Average household size - Hispanic or Latino
Average household size - American Indian and Alaska Native
Average household size - Multirace
Average household size - Other Race
Occupied housing units (%)
Vacant housing units (%)
Owner occupied housing units (%)
Renter occupied housing units (%)
Vacancy status - For rent (%)
Vacancy status - For sale only (%)
Vacancy status - Rented or sold, not occupied (%)
Vacancy status - For seasonal, recreational, or occasional use (%)
Vacancy status - For migrant workers (%)
Vacancy status - Other vacant (%)
Residents with income below the poverty level (%)
Residents with income below 50% of the poverty level (%)
Children below poverty level (%)
Poor families by family type - Married-couple family (%)
Poor families by family type - Male, no wife present (%)
Poor families by family type - Female, no husband present (%)
Poverty status for native-born residents (%)
Poverty status for foreign-born residents (%)
Poverty among high school graduates not in families (%)
Poverty among people who did not graduate high school not in families (%)
Residents with income below the poverty level (%) - White
Residents with income below the poverty level (%) - Black or African American
Residents with income below the poverty level (%) - Asian
Residents with income below the poverty level (%) - Hispanic or Latino
Residents with income below the poverty level (%) - American Indian and Alaska Native
Residents with income below the poverty level (%) - Multirace
Residents with income below the poverty level (%) - Other Race
Air pollution - Air Quality Index (AQI)
Air pollution - CO
Air pollution - NO2
Air pollution - SO2
Air pollution - Ozone
Air pollution - PM10
Air pollution - PM25
Air pollution - Pb
Crime - Murders per 100,000 population
Crime - Rapes per 100,000 population
Crime - Robberies per 100,000 population
Crime - Assaults per 100,000 population
Crime - Burglaries per 100,000 population
Crime - Thefts per 100,000 population
Crime - Auto thefts per 100,000 population
Crime - Arson per 100,000 population
Crime - City-data.com crime index
Crime - Violent crime index
Crime - Property crime index
Crime - Murders per 100,000 population (5 year average)
Crime - Rapes per 100,000 population (5 year average)
Crime - Robberies per 100,000 population (5 year average)
Crime - Assaults per 100,000 population (5 year average)
Crime - Burglaries per 100,000 population (5 year average)
Crime - Thefts per 100,000 population (5 year average)
Crime - Auto thefts per 100,000 population (5 year average)
Crime - Arson per 100,000 population (5 year average)
Crime - City-data.com crime index (5 year average)
Crime - Violent crime index (5 year average)
Crime - Property crime index (5 year average)
1996 Presidential Elections Results (%) - Democratic Party (Clinton)
1996 Presidential Elections Results (%) - Republican Party (Dole)
1996 Presidential Elections Results (%) - Other
2000 Presidential Elections Results (%) - Democratic Party (Gore)
2000 Presidential Elections Results (%) - Republican Party (Bush)
2000 Presidential Elections Results (%) - Other
2004 Presidential Elections Results (%) - Democratic Party (Kerry)
2004 Presidential Elections Results (%) - Republican Party (Bush)
2004 Presidential Elections Results (%) - Other
2008 Presidential Elections Results (%) - Democratic Party (Obama)
2008 Presidential Elections Results (%) - Republican Party (McCain)
2008 Presidential Elections Results (%) - Other
2012 Presidential Elections Results (%) - Democratic Party (Obama)
2012 Presidential Elections Results (%) - Republican Party (Romney)
2012 Presidential Elections Results (%) - Other
2016 Presidential Elections Results (%) - Democratic Party (Clinton)
2016 Presidential Elections Results (%) - Republican Party (Trump)
2016 Presidential Elections Results (%) - Other
2020 Presidential Elections Results (%) - Democratic Party (Biden)
2020 Presidential Elections Results (%) - Republican Party (Trump)
2020 Presidential Elections Results (%) - Other
Ancestries Reported - Arab (%)
Ancestries Reported - Czech (%)
Ancestries Reported - Danish (%)
Ancestries Reported - Dutch (%)
Ancestries Reported - English (%)
Ancestries Reported - French (%)
Ancestries Reported - French Canadian (%)
Ancestries Reported - German (%)
Ancestries Reported - Greek (%)
Ancestries Reported - Hungarian (%)
Ancestries Reported - Irish (%)
Ancestries Reported - Italian (%)
Ancestries Reported - Lithuanian (%)
Ancestries Reported - Norwegian (%)
Ancestries Reported - Polish (%)
Ancestries Reported - Portuguese (%)
Ancestries Reported - Russian (%)
Ancestries Reported - Scotch-Irish (%)
Ancestries Reported - Scottish (%)
Ancestries Reported - Slovak (%)
Ancestries Reported - Subsaharan African (%)
Ancestries Reported - Swedish (%)
Ancestries Reported - Swiss (%)
Ancestries Reported - Ukrainian (%)
Ancestries Reported - United States (%)
Ancestries Reported - Welsh (%)
Ancestries Reported - West Indian (%)
Ancestries Reported - Other (%)
Educational Attainment - No schooling completed (%)
Educational Attainment - Less than high school (%)
Educational Attainment - High school or equivalent (%)
Educational Attainment - Less than 1 year of college (%)
Educational Attainment - 1 or more years of college (%)
Educational Attainment - Associate degree (%)
Educational Attainment - Bachelor's degree (%)
Educational Attainment - Master's degree (%)
Educational Attainment - Professional school degree (%)
Educational Attainment - Doctorate degree (%)
School Enrollment - Nursery, preschool (%)
School Enrollment - Kindergarten (%)
School Enrollment - Grade 1 to 4 (%)
School Enrollment - Grade 5 to 8 (%)
School Enrollment - Grade 9 to 12 (%)
School Enrollment - College undergrad (%)
School Enrollment - Graduate or professional (%)
School Enrollment - Not enrolled in school (%)
School enrollment - Public schools (%)
School enrollment - Private schools (%)
School enrollment - Not enrolled (%)
Median number of rooms in houses and condos
Median number of rooms in apartments
Housing units lacking complete plumbing facilities (%)
Housing units lacking complete kitchen facilities (%)
Density of houses
Urban houses (%)
Rural houses (%)
Households with people 60 years and over (%)
Households with people 65 years and over (%)
Households with people 75 years and over (%)
Households with one or more nonrelatives (%)
Households with no nonrelatives (%)
Population in households (%)
Family households (%)
Nonfamily households (%)
Population in families (%)
Family households with own children (%)
Median number of bedrooms in owner occupied houses
Mean number of bedrooms in owner occupied houses
Median number of bedrooms in renter occupied houses
Mean number of bedrooms in renter occupied houses
Median number of vehichles in owner occupied houses
Mean number of vehichles in owner occupied houses
Median number of vehichles in renter occupied houses
Mean number of vehichles in renter occupied houses
Mortgage status - with mortgage (%)
Mortgage status - with second mortgage (%)
Mortgage status - with home equity loan (%)
Mortgage status - with both second mortgage and home equity loan (%)
Mortgage status - without a mortgage (%)
Average family size
Average family size - White
Average family size - Black or African American
Average family size - Asian
Average family size - Hispanic or Latino
Average family size - American Indian and Alaska Native
Average family size - Multirace
Average family size - Other Race
Geographical mobility - Same house 1 year ago (%)
Geographical mobility - Moved within same county (%)
Geographical mobility - Moved from different county within same state (%)
Geographical mobility - Moved from different state (%)
Geographical mobility - Moved from abroad (%)
Place of birth - Born in state of residence (%)
Place of birth - Born in other state (%)
Place of birth - Native, outside of US (%)
Place of birth - Foreign born (%)
Housing units in structures - 1, detached (%)
Housing units in structures - 1, attached (%)
Housing units in structures - 2 (%)
Housing units in structures - 3 or 4 (%)
Housing units in structures - 5 to 9 (%)
Housing units in structures - 10 to 19 (%)
Housing units in structures - 20 to 49 (%)
Housing units in structures - 50 or more (%)
Housing units in structures - Mobile home (%)
Housing units in structures - Boat, RV, van, etc. (%)
House/condo owner moved in on average (years ago)
Renter moved in on average (years ago)
Year householder moved into unit - Moved in 1999 to March 2000 (%)
Year householder moved into unit - Moved in 1995 to 1998 (%)
Year householder moved into unit - Moved in 1990 to 1994 (%)
Year householder moved into unit - Moved in 1980 to 1989 (%)
Year householder moved into unit - Moved in 1970 to 1979 (%)
Year householder moved into unit - Moved in 1969 or earlier (%)
Means of transportation to work - Drove car alone (%)
Means of transportation to work - Carpooled (%)
Means of transportation to work - Public transportation (%)
Means of transportation to work - Bus or trolley bus (%)
Means of transportation to work - Streetcar or trolley car (%)
Means of transportation to work - Subway or elevated (%)
Means of transportation to work - Railroad (%)
Means of transportation to work - Ferryboat (%)
Means of transportation to work - Taxicab (%)
Means of transportation to work - Motorcycle (%)
Means of transportation to work - Bicycle (%)
Means of transportation to work - Walked (%)
Means of transportation to work - Other means (%)
Working at home (%)
Industry diversity
Most Common Industries - Agriculture, forestry, fishing and hunting, and mining (%)
Most Common Industries - Agriculture, forestry, fishing and hunting (%)
Most Common Industries - Mining, quarrying, and oil and gas extraction (%)
Most Common Industries - Construction (%)
Most Common Industries - Manufacturing (%)
Most Common Industries - Wholesale trade (%)
Most Common Industries - Retail trade (%)
Most Common Industries - Transportation and warehousing, and utilities (%)
Most Common Industries - Transportation and warehousing (%)
Most Common Industries - Utilities (%)
Most Common Industries - Information (%)
Most Common Industries - Finance and insurance, and real estate and rental and leasing (%)
Most Common Industries - Finance and insurance (%)
Most Common Industries - Real estate and rental and leasing (%)
Most Common Industries - Professional, scientific, and management, and administrative and waste management services (%)
Most Common Industries - Professional, scientific, and technical services (%)
Most Common Industries - Management of companies and enterprises (%)
Most Common Industries - Administrative and support and waste management services (%)
Most Common Industries - Educational services, and health care and social assistance (%)
Most Common Industries - Educational services (%)
Most Common Industries - Health care and social assistance (%)
Most Common Industries - Arts, entertainment, and recreation, and accommodation and food services (%)
Most Common Industries - Arts, entertainment, and recreation (%)
Most Common Industries - Accommodation and food services (%)
Most Common Industries - Other services, except public administration (%)
Most Common Industries - Public administration (%)
Occupation diversity
Most Common Occupations - Management, business, science, and arts occupations (%)
Most Common Occupations - Management, business, and financial occupations (%)
Most Common Occupations - Management occupations (%)
Most Common Occupations - Business and financial operations occupations (%)
Most Common Occupations - Computer, engineering, and science occupations (%)
Most Common Occupations - Computer and mathematical occupations (%)
Most Common Occupations - Architecture and engineering occupations (%)
Most Common Occupations - Life, physical, and social science occupations (%)
Most Common Occupations - Education, legal, community service, arts, and media occupations (%)
Most Common Occupations - Community and social service occupations (%)
Most Common Occupations - Legal occupations (%)
Most Common Occupations - Education, training, and library occupations (%)
Most Common Occupations - Arts, design, entertainment, sports, and media occupations (%)
Most Common Occupations - Healthcare practitioners and technical occupations (%)
Most Common Occupations - Health diagnosing and treating practitioners and other technical occupations (%)
Most Common Occupations - Health technologists and technicians (%)
Most Common Occupations - Service occupations (%)
Most Common Occupations - Healthcare support occupations (%)
Most Common Occupations - Protective service occupations (%)
Most Common Occupations - Fire fighting and prevention, and other protective service workers including supervisors (%)
Most Common Occupations - Law enforcement workers including supervisors (%)
Most Common Occupations - Food preparation and serving related occupations (%)
Most Common Occupations - Building and grounds cleaning and maintenance occupations (%)
Most Common Occupations - Personal care and service occupations (%)
Most Common Occupations - Sales and office occupations (%)
Most Common Occupations - Sales and related occupations (%)
Most Common Occupations - Office and administrative support occupations (%)
Most Common Occupations - Natural resources, construction, and maintenance occupations (%)
Most Common Occupations - Farming, fishing, and forestry occupations (%)
Most Common Occupations - Construction and extraction occupations (%)
Most Common Occupations - Installation, maintenance, and repair occupations (%)
Most Common Occupations - Production, transportation, and material moving occupations (%)
Most Common Occupations - Production occupations (%)
Most Common Occupations - Transportation occupations (%)
Most Common Occupations - Material moving occupations (%)
People in Group quarters - Institutionalized population (%)
People in Group quarters - Correctional institutions (%)
People in Group quarters - Federal prisons and detention centers (%)
People in Group quarters - Halfway houses (%)
People in Group quarters - Local jails and other confinement facilities (including police lockups) (%)
People in Group quarters - Military disciplinary barracks (%)
People in Group quarters - State prisons (%)
People in Group quarters - Other types of correctional institutions (%)
People in Group quarters - Nursing homes (%)
People in Group quarters - Hospitals/wards, hospices, and schools for the handicapped (%)
People in Group quarters - Hospitals/wards and hospices for chronically ill (%)
People in Group quarters - Hospices or homes for chronically ill (%)
People in Group quarters - Military hospitals or wards for chronically ill (%)
People in Group quarters - Other hospitals or wards for chronically ill (%)
People in Group quarters - Hospitals or wards for drug/alcohol abuse (%)
People in Group quarters - Mental (Psychiatric) hospitals or wards (%)
People in Group quarters - Schools, hospitals, or wards for the mentally retarded (%)
People in Group quarters - Schools, hospitals, or wards for the physically handicapped (%)
People in Group quarters - Institutions for the deaf (%)
People in Group quarters - Institutions for the blind (%)
People in Group quarters - Orthopedic wards and institutions for the physically handicapped (%)
People in Group quarters - Wards in general hospitals for patients who have no usual home elsewhere (%)
People in Group quarters - Wards in military hospitals for patients who have no usual home elsewhere (%)
People in Group quarters - Juvenile institutions (%)
People in Group quarters - Long-term care (%)
People in Group quarters - Homes for abused, dependent, and neglected children (%)
People in Group quarters - Residential treatment centers for emotionally disturbed children (%)
People in Group quarters - Training schools for juvenile delinquents (%)
People in Group quarters - Short-term care, detention or diagnostic centers for delinquent children (%)
People in Group quarters - Type of juvenile institution unknown (%)
People in Group quarters - Noninstitutionalized population (%)
People in Group quarters - College dormitories (includes college quarters off campus) (%)
People in Group quarters - Military quarters (%)
People in Group quarters - On base (%)
People in Group quarters - Barracks, unaccompanied personnel housing (UPH), (Enlisted/Officer), ;and similar group living quarters for military personnel (%)
People in Group quarters - Transient quarters for temporary residents (%)
People in Group quarters - Military ships (%)
People in Group quarters - Group homes (%)
People in Group quarters - Homes or halfway houses for drug/alcohol abuse (%)
People in Group quarters - Homes for the mentally ill (%)
People in Group quarters - Homes for the mentally retarded (%)
People in Group quarters - Homes for the physically handicapped (%)
People in Group quarters - Other group homes (%)
People in Group quarters - Religious group quarters (%)
People in Group quarters - Dormitories (%)
People in Group quarters - Agriculture workers' dormitories on farms (%)
People in Group quarters - Job Corps and vocational training facilities (%)
People in Group quarters - Other workers' dormitories (%)
People in Group quarters - Crews of maritime vessels (%)
People in Group quarters - Other nonhousehold living situations (%)
People in Group quarters - Other noninstitutional group quarters (%)
Residents speaking English at home (%)
Residents speaking English at home - Born in the United States (%)
Residents speaking English at home - Native, born elsewhere (%)
Residents speaking English at home - Foreign born (%)
Residents speaking Spanish at home (%)
Residents speaking Spanish at home - Born in the United States (%)
Residents speaking Spanish at home - Native, born elsewhere (%)
Residents speaking Spanish at home - Foreign born (%)
Residents speaking other language at home (%)
Residents speaking other language at home - Born in the United States (%)
Residents speaking other language at home - Native, born elsewhere (%)
Residents speaking other language at home - Foreign born (%)
Class of Workers - Employee of private company (%)
Class of Workers - Self-employed in own incorporated business (%)
Class of Workers - Private not-for-profit wage and salary workers (%)
Class of Workers - Local government workers (%)
Class of Workers - State government workers (%)
Class of Workers - Federal government workers (%)
Class of Workers - Self-employed workers in own not incorporated business and Unpaid family workers (%)
House heating fuel used in houses and condos - Utility gas (%)
House heating fuel used in houses and condos - Bottled, tank, or LP gas (%)
House heating fuel used in houses and condos - Electricity (%)
House heating fuel used in houses and condos - Fuel oil, kerosene, etc. (%)
House heating fuel used in houses and condos - Coal or coke (%)
House heating fuel used in houses and condos - Wood (%)
House heating fuel used in houses and condos - Solar energy (%)
House heating fuel used in houses and condos - Other fuel (%)
House heating fuel used in houses and condos - No fuel used (%)
House heating fuel used in apartments - Utility gas (%)
House heating fuel used in apartments - Bottled, tank, or LP gas (%)
House heating fuel used in apartments - Electricity (%)
House heating fuel used in apartments - Fuel oil, kerosene, etc. (%)
House heating fuel used in apartments - Coal or coke (%)
House heating fuel used in apartments - Wood (%)
House heating fuel used in apartments - Solar energy (%)
House heating fuel used in apartments - Other fuel (%)
House heating fuel used in apartments - No fuel used (%)
Armed forces status - In Armed Forces (%)
Armed forces status - Civilian (%)
Armed forces status - Civilian - Veteran (%)
Armed forces status - Civilian - Nonveteran (%)
Fatal accidents locations in years 2005-2021
Fatal accidents locations in 2005
Fatal accidents locations in 2006
Fatal accidents locations in 2007
Fatal accidents locations in 2008
Fatal accidents locations in 2009
Fatal accidents locations in 2010
Fatal accidents locations in 2011
Fatal accidents locations in 2012
Fatal accidents locations in 2013
Fatal accidents locations in 2014
Fatal accidents locations in 2015
Fatal accidents locations in 2016
Fatal accidents locations in 2017
Fatal accidents locations in 2018
Fatal accidents locations in 2019
Fatal accidents locations in 2020
Fatal accidents locations in 2021
Alcohol use - People drinking some alcohol every month (%)
Alcohol use - People not drinking at all (%)
Alcohol use - Average days/month drinking alcohol
Alcohol use - Average drinks/week
Alcohol use - Average days/year people drink much
Audiometry - Average condition of hearing (%)
Audiometry - People that can hear a whisper from across a quiet room (%)
Audiometry - People that can hear normal voice from across a quiet room (%)
Audiometry - Ears ringing, roaring, buzzing (%)
Audiometry - Had a job exposure to loud noise (%)
Audiometry - Had off-work exposure to loud noise (%)
Blood Pressure & Cholesterol - Has high blood pressure (%)
Blood Pressure & Cholesterol - Checking blood pressure at home (%)
Blood Pressure & Cholesterol - Frequently checking blood cholesterol (%)
Blood Pressure & Cholesterol - Has high cholesterol level (%)
Consumer Behavior - Money monthly spent on food at supermarket/grocery store
Consumer Behavior - Money monthly spent on food at other stores
Consumer Behavior - Money monthly spent on eating out
Consumer Behavior - Money monthly spent on carryout/delivered foods
Consumer Behavior - Income spent on food at supermarket/grocery store (%)
Consumer Behavior - Income spent on food at other stores (%)
Consumer Behavior - Income spent on eating out (%)
Consumer Behavior - Income spent on carryout/delivered foods (%)
Current Health Status - General health condition (%)
Current Health Status - Blood donors (%)
Current Health Status - Has blood ever tested for HIV virus (%)
Current Health Status - Left-handed people (%)
Dermatology - People using sunscreen (%)
Diabetes - Diabetics (%)
Diabetes - Had a blood test for high blood sugar (%)
Diabetes - People taking insulin (%)
Diet Behavior & Nutrition - Diet health (%)
Diet Behavior & Nutrition - Milk product consumption (# of products/month)
Diet Behavior & Nutrition - Meals not home prepared (#/week)
Diet Behavior & Nutrition - Meals from fast food or pizza place (#/week)
Diet Behavior & Nutrition - Ready-to-eat foods (#/month)
Diet Behavior & Nutrition - Frozen meals/pizza (#/month)
Drug Use - People that ever used marijuana or hashish (%)
Drug Use - Ever used hard drugs (%)
Drug Use - Ever used any form of cocaine (%)
Drug Use - Ever used heroin (%)
Drug Use - Ever used methamphetamine (%)
Health Insurance - People covered by health insurance (%)
Kidney Conditions-Urology - Avg. # of times urinating at night
Medical Conditions - People with asthma (%)
Medical Conditions - People with anemia (%)
Medical Conditions - People with psoriasis (%)
Medical Conditions - People with overweight (%)
Medical Conditions - Elderly people having difficulties in thinking or remembering (%)
Medical Conditions - People who ever received blood transfusion (%)
Medical Conditions - People having trouble seeing even with glass/contacts (%)
Medical Conditions - People with arthritis (%)
Medical Conditions - People with gout (%)
Medical Conditions - People with congestive heart failure (%)
Medical Conditions - People with coronary heart disease (%)
Medical Conditions - People with angina pectoris (%)
Medical Conditions - People who ever had heart attack (%)
Medical Conditions - People who ever had stroke (%)
Medical Conditions - People with emphysema (%)
Medical Conditions - People with thyroid problem (%)
Medical Conditions - People with chronic bronchitis (%)
Medical Conditions - People with any liver condition (%)
Medical Conditions - People who ever had cancer or malignancy (%)
Mental Health - People who have little interest in doing things (%)
Mental Health - People feeling down, depressed, or hopeless (%)
Mental Health - People who have trouble sleeping or sleeping too much (%)
Mental Health - People feeling tired or having little energy (%)
Mental Health - People with poor appetite or overeating (%)
Mental Health - People feeling bad about themself (%)
Mental Health - People who have trouble concentrating on things (%)
Mental Health - People moving or speaking slowly or too fast (%)
Mental Health - People having thoughts they would be better off dead (%)
Oral Health - Average years since last visit a dentist
Oral Health - People embarrassed because of mouth (%)
Oral Health - People with gum disease (%)
Oral Health - General health of teeth and gums (%)
Oral Health - Average days a week using dental floss/device
Oral Health - Average days a week using mouthwash for dental problem
Oral Health - Average number of teeth
Pesticide Use - Households using pesticides to control insects (%)
Pesticide Use - Households using pesticides to kill weeds (%)
Physical Activity - People doing vigorous-intensity work activities (%)
Physical Activity - People doing moderate-intensity work activities (%)
Physical Activity - People walking or bicycling (%)
Physical Activity - People doing vigorous-intensity recreational activities (%)
Physical Activity - People doing moderate-intensity recreational activities (%)
Physical Activity - Average hours a day doing sedentary activities
Physical Activity - Average hours a day watching TV or videos
Physical Activity - Average hours a day using computer
Physical Functioning - People having limitations keeping them from working (%)
Physical Functioning - People limited in amount of work they can do (%)
Physical Functioning - People that need special equipment to walk (%)
Physical Functioning - People experiencing confusion/memory problems (%)
Physical Functioning - People requiring special healthcare equipment (%)
Prescription Medications - Average number of prescription medicines taking
Preventive Aspirin Use - Adults 40+ taking low-dose aspirin (%)
Reproductive Health - Vaginal deliveries (%)
Reproductive Health - Cesarean deliveries (%)
Reproductive Health - Deliveries resulted in a live birth (%)
Reproductive Health - Pregnancies resulted in a delivery (%)
Reproductive Health - Women breastfeeding newborns (%)
Reproductive Health - Women that had a hysterectomy (%)
Reproductive Health - Women that had both ovaries removed (%)
Reproductive Health - Women that have ever taken birth control pills (%)
Reproductive Health - Women taking birth control pills (%)
Reproductive Health - Women that have ever used Depo-Provera or injectables (%)
Reproductive Health - Women that have ever used female hormones (%)
Sexual Behavior - People 18+ that ever had sex (vaginal, anal, or oral) (%)
Sexual Behavior - Males 18+ that ever had vaginal sex with a woman (%)
Sexual Behavior - Males 18+ that ever performed oral sex on a woman (%)
Sexual Behavior - Males 18+ that ever had anal sex with a woman (%)
Sexual Behavior - Males 18+ that ever had any sex with a man (%)
Sexual Behavior - Females 18+ that ever had vaginal sex with a man (%)
Sexual Behavior - Females 18+ that ever performed oral sex on a man (%)
Sexual Behavior - Females 18+ that ever had anal sex with a man (%)
Sexual Behavior - Females 18+ that ever had any kind of sex with a woman (%)
Sexual Behavior - Average age people first had sex
Sexual Behavior - Average number of female sex partners in lifetime (males 18+)
Sexual Behavior - Average number of female vaginal sex partners in lifetime (males 18+)
Sexual Behavior - Average age people first performed oral sex on a woman (18+)
Sexual Behavior - Average number of woman performed oral sex on in lifetime (18+)
Sexual Behavior - Average number of male sex partners in lifetime (males 18+)
Sexual Behavior - Average number of male anal sex partners in lifetime (males 18+)
Sexual Behavior - Average age people first performed oral sex on a man (18+)
Sexual Behavior - Average number of male oral sex partners in lifetime (18+)
Sexual Behavior - People using protection when performing oral sex (%)
Sexual Behavior - Average number of times people have vaginal or anal sex a year
Sexual Behavior - People having sex without condom (%)
Sexual Behavior - Average number of male sex partners in lifetime (females 18+)
Sexual Behavior - Average number of male vaginal sex partners in lifetime (females 18+)
Sexual Behavior - Average number of female sex partners in lifetime (females 18+)
Sexual Behavior - Circumcised males 18+ (%)
Sleep Disorders - Average hours sleeping at night
Sleep Disorders - People that has trouble sleeping (%)
Smoking-Cigarette Use - People smoking cigarettes (%)
Taste & Smell - People 40+ having problems with smell (%)
Taste & Smell - People 40+ having problems with taste (%)
Taste & Smell - People 40+ that ever had wisdom teeth removed (%)
Taste & Smell - People 40+ that ever had tonsils teeth removed (%)
Taste & Smell - People 40+ that ever had a loss of consciousness because of a head injury (%)
Taste & Smell - People 40+ that ever had a broken nose or other serious injury to face or skull (%)
Taste & Smell - People 40+ that ever had two or more sinus infections (%)
Weight - Average height (inches)
Weight - Average weight (pounds)
Weight - Average BMI
Weight - People that are obese (%)
Weight - People that ever were obese (%)
Weight - People trying to lose weight (%)
Urban population: 7,267
Rural population: 8,009
Estimated median house/condo value in 2022: $187,186
27370:
$187,186North Carolina:
$280,600
Median resident age: This zip code:
42.9 yearsNorth Carolina median age:
39.2 years
Average household size: This zip code:
2.6 peopleNorth Carolina:
2.4 people
Averages for the 2020 tax year for zip code 27370, filed in 2021:
Average Adjusted Gross Income (AGI) in 2020: $63,636 (Individual Income Tax Returns) Here:
$63,636State:
$70,020
Salary/wage: $50,634 (reported on 83.3% of returns )Here:
$50,634State:
$58,387
(% of AGI for various income ranges: 1151.3% for AGIs below $25k , 3642.9% for AGIs $25k-50k , 6781.0% for AGIs $50k-75k , 10466.6% for AGIs $75k-100k , 19481.8% for AGIs $100k-200k , 74902.0% for AGIs over 200k ) Taxable interest for individuals: $1,008 (reported on 26.9% of returns )This zip code:
$1,008North Carolina:
$1,479
(% of AGI for various income ranges: 18.9% for AGIs below $25k , 14.0% for AGIs $25k-50k , 27.7% for AGIs $50k-75k , 24.3% for AGIs $75k-100k , 104.4% for AGIs $100k-200k , 1216.0% for AGIs over 200k ) Ordinary dividends: $4,835 (reported on 12.8% of returns )(% of AGI for various income ranges: 14.5% for AGIs below $25k , 20.6% for AGIs $25k-50k , 53.7% for AGIs $50k-75k , 51.1% for AGIs $75k-100k , 215.6% for AGIs $100k-200k , 4476.0% for AGIs over 200k ) Net capital gain/loss in AGI: +$15,863 (reported on 11.9% of returns )Here:
+$15,863State:
+$23,652
(% of AGI for various income ranges: 11.5% for AGIs below $25k , 21.4% for AGIs $25k-50k , 65.5% for AGIs $50k-75k , 133.4% for AGIs $75k-100k , 601.3% for AGIs $100k-200k , 18550.0% for AGIs over 200k ) Profit/loss from business: +$10,752 (reported on 16.8% of returns )Here:
+$10,752State:
+$11,710
(% of AGI for various income ranges: 186.1% for AGIs below $25k , 204.9% for AGIs $25k-50k , 188.3% for AGIs $50k-75k , 362.0% for AGIs $75k-100k , 726.9% for AGIs $100k-200k , 490.0% for AGIs over 200k ) Taxable individual retirement arrangement distribution: $15,125 (reported on 9.6% of returns )27370:
$15,125North Carolina:
$20,247
(% of AGI for various income ranges: 77.6% for AGIs below $25k , 131.7% for AGIs $25k-50k , 172.0% for AGIs $50k-75k , 413.9% for AGIs $75k-100k , 572.9% for AGIs $100k-200k , 2488.0% for AGIs over 200k ) Total itemized deductions: $34,242 (reported on 4.6% of returns )Here:
$34,242State:
$34,549
(% of AGI for various income ranges: 51.2% for AGIs below $25k , 44.8% for AGIs $25k-50k , 142.7% for AGIs $50k-75k , 323.2% for AGIs $75k-100k , 949.1% for AGIs $100k-200k , 5696.0% for AGIs over 200k ) Charity contributions: $12,704 (reported on 3.9% of returns )Here:
$12,704State:
$13,360
(% of AGI for various income ranges: 11.6% for AGIs $25k-50k , 22.9% for AGIs $50k-75k , 59.3% for AGIs $75k-100k , 329.6% for AGIs $100k-200k , 2884.0% for AGIs over 200k ) Taxes paid: $6,900 (reported on 4.6% of returns )(% of AGI for various income ranges: 5.8% for AGIs below $25k , 6.2% for AGIs $25k-50k , 22.5% for AGIs $50k-75k , 79.1% for AGIs $75k-100k , 213.8% for AGIs $100k-200k , 1170.0% for AGIs over 200k ) Earned income credit: $2,329 (reported on 18.3% of returns )(% of AGI for various income ranges: 105.2% for AGIs below $25k , 82.9% for AGIs $25k-50k , 1.2% for AGIs $50k-75k ) Percentage of individuals using paid preparers for their 2020 taxes: 94.3%(% for various income ranges: 93.2% for AGIs below $25k , 94.4% for AGIs $25k-50k , 94.7% for AGIs $50k-75k , 94.1% for AGIs $75k-100k , 96.6% for AGIs $100k-200k , 94.4% for AGIs over 200k )
Averages for the 2012 tax year for zip code 27370, filed in 2013:
Average Adjusted Gross Income (AGI) in 2012: $49,425 (Individual Income Tax Returns) Here:
$49,425State:
$54,937
Salary/wage: $42,206 (reported on 86.0% of returns )Here:
$42,206State:
$46,336
(% of AGI for various income ranges: 73.2% for AGIs below $25k , 82.9% for AGIs $25k-50k , 82.2% for AGIs $50k-75k , 82.5% for AGIs $75k-100k , 77.4% for AGIs $100k-200k , 41.2% for AGIs over 200k ) Taxable interest for individuals: $887 (reported on 30.0% of returns )This zip code:
$887North Carolina:
$1,298
(% of AGI for various income ranges: 1.1% for AGIs below $25k , 0.5% for AGIs $25k-50k , 0.4% for AGIs $50k-75k , 0.4% for AGIs $75k-100k , 0.4% for AGIs $100k-200k , 0.8% for AGIs over 200k ) Ordinary dividends: $2,174 (reported on 12.9% of returns )(% of AGI for various income ranges: 0.7% for AGIs below $25k , 0.5% for AGIs $25k-50k , 0.5% for AGIs $50k-75k , 0.5% for AGIs $75k-100k , 0.8% for AGIs $100k-200k , 0.4% for AGIs over 200k ) Net capital gain/loss in AGI: +$1,921 (reported on 9.7% of returns )Here:
+$1,921State:
+$12,740
(% of AGI for various income ranges: 0.3% for AGIs below $25k , 0.2% for AGIs $25k-50k , 0.3% for AGIs $50k-75k , 0.1% for AGIs $75k-100k , 0.9% for AGIs $100k-200k , 0.5% for AGIs over 200k ) Profit/loss from business: +$8,759 (reported on 16.9% of returns )Here:
+$8,759State:
+$10,311
(% of AGI for various income ranges: 8.3% for AGIs below $25k , 3.3% for AGIs $25k-50k , 2.2% for AGIs $50k-75k , 1.8% for AGIs $75k-100k , 3.1% for AGIs $100k-200k , 1.3% for AGIs over 200k ) Taxable individual retirement arrangement distribution: $12,656 (reported on 10.2% of returns )27370:
$12,656North Carolina:
$15,575
(% of AGI for various income ranges: 3.9% for AGIs below $25k , 2.6% for AGIs $25k-50k , 2.4% for AGIs $50k-75k , 2.8% for AGIs $75k-100k , 4.4% for AGIs $100k-200k ) Self-employment retirement plans: $13,550 (reported on 0.3% of returns )27370:
$13,550North Carolina:
$21,078
Total itemized deductions: $20,628 (22% of AGI, reported on 31.4% of returns )Here:
$20,628State:
$23,438
Here:
21.9% of AGIState:
21.5% of AGI
(% of AGI for various income ranges: 9.2% for AGIs below $25k , 11.0% for AGIs $25k-50k , 12.9% for AGIs $50k-75k , 15.4% for AGIs $75k-100k , 16.6% for AGIs $100k-200k , 12.4% for AGIs over 200k ) Charity contributions: $4,198 (reported on 25.3% of returns )(% of AGI for various income ranges: 1.0% for AGIs below $25k , 1.5% for AGIs $25k-50k , 1.9% for AGIs $50k-75k , 2.6% for AGIs $75k-100k , 3.0% for AGIs $100k-200k , 2.6% for AGIs over 200k ) Taxes paid: $7,649 (reported on 31.3% of returns )(% of AGI for various income ranges: 1.6% for AGIs below $25k , 2.6% for AGIs $25k-50k , 3.7% for AGIs $50k-75k , 5.4% for AGIs $75k-100k , 6.8% for AGIs $100k-200k , 8.0% for AGIs over 200k ) Earned income credit: $2,264 (reported on 21.9% of returns )(% of AGI for various income ranges: 7.0% for AGIs below $25k , 1.5% for AGIs $25k-50k ) Percentage of individuals using paid preparers for their 2012 taxes: 56.2%(% for various income ranges: 51.3% for AGIs below $25k , 54.6% for AGIs $25k-50k , 61.2% for AGIs $50k-75k , 61.0% for AGIs $75k-100k , 68.9% for AGIs $100k-200k , 80.0% for AGIs over 200k )
Averages for the 2004 tax year for zip code 27370, filed in 2005:
Average Adjusted Gross Income (AGI) in 2004: $41,054 (Individual Income Tax Returns) Here:
$41,054State:
$45,376
Salary/wage: $37,389 (reported on 89.2% of returns )Here:
$37,389State:
$39,442
(% of AGI for various income ranges: 104.9% for AGIs below $10k , 80.7% for AGIs $10k-25k , 86.7% for AGIs $25k-50k , 87.4% for AGIs $50k-75k , 86.6% for AGIs $75k-100k , 65.3% for AGIs over 100k ) Taxable interest for individuals: $1,039 (reported on 35.5% of returns )This zip code:
$1,039North Carolina:
$1,515
(% of AGI for various income ranges: 3.2% for AGIs below $10k , 1.6% for AGIs $10k-25k , 0.7% for AGIs $25k-50k , 0.4% for AGIs $50k-75k , 0.4% for AGIs $75k-100k , 1.3% for AGIs over 100k ) Taxable dividends: $1,297 (reported on 15.7% of returns )(% of AGI for various income ranges: 1.1% for AGIs below $10k , 0.5% for AGIs $10k-25k , 0.3% for AGIs $25k-50k , 0.3% for AGIs $50k-75k , 0.3% for AGIs $75k-100k , 0.9% for AGIs over 100k ) Net capital gain/loss: +$7,028 (reported on 11.1% of returns )Here:
+$7,028State:
+$11,152
(% of AGI for various income ranges: 0.7% for AGIs below $10k , 0.4% for AGIs $10k-25k , 0.1% for AGIs $25k-50k , 0.6% for AGIs $50k-75k , 0.9% for AGIs $75k-100k , 6.2% for AGIs over 100k ) Profit/loss from business: +$10,171 (reported on 18.6% of returns )Here:
+$10,171State:
+$9,490
(% of AGI for various income ranges: 8.8% for AGIs below $10k , 8.2% for AGIs $10k-25k , 4.1% for AGIs $25k-50k , 3.0% for AGIs $50k-75k , 2.8% for AGIs $75k-100k , 5.9% for AGIs over 100k ) IRA payment deduction: $3,027 (reported on 2.8% of returns )27370:
$3,027North Carolina:
$2,967
(% of AGI for various income ranges: 0.1% for AGIs $10k-25k , 0.3% for AGIs $25k-50k , 0.2% for AGIs $50k-75k , 0.1% for AGIs $75k-100k , 0.2% for AGIs over 100k ) Self-employed pension: $11,472 (reported on 0.5% of returns )Here:
$11,472North Carolina:
$14,754
Total itemized deductions: $16,717 (23% of AGI, reported on 35.9% of returns )Here:
$16,717State:
$19,464
Here:
23.1% of AGIState:
22.7% of AGI
(% of AGI for various income ranges: 14.1% for AGIs below $10k , 9.8% for AGIs $10k-25k , 12.9% for AGIs $25k-50k , 15.6% for AGIs $50k-75k , 17.8% for AGIs $75k-100k , 15.4% for AGIs over 100k ) Charity contributions deductions: $3,376 (4% of AGI, reported on 30.5% of returns )Here:
4.4% of AGIState:
4.5% of AGI
(% of AGI for various income ranges: 1.1% for AGIs below $10k , 1.3% for AGIs $10k-25k , 1.9% for AGIs $25k-50k , 2.6% for AGIs $50k-75k , 3.3% for AGIs $75k-100k , 3.1% for AGIs over 100k ) Total tax: $5,471 (reported on 74.7% of returns )(% of AGI for various income ranges: 3.4% for AGIs below $10k , 4.3% for AGIs $10k-25k , 6.3% for AGIs $25k-50k , 8.1% for AGIs $50k-75k , 9.8% for AGIs $75k-100k , 18.4% for AGIs over 100k ) Earned income credit: $1,741 (reported on 18.8% of returns )Percentage of individuals using paid preparers for their 2004 taxes: 63.1%(% for various income ranges: 56.0% for AGIs below $10k , 65.3% for AGIs $10k-25k , 62.2% for AGIs $25k-50k , 65.2% for AGIs $50k-75k , 65.1% for AGIs $75k-100k , 71.7% for AGIs over 100k )
Estimated median household income in 2022: This zip code:
$70,416North Carolina:
$67,481
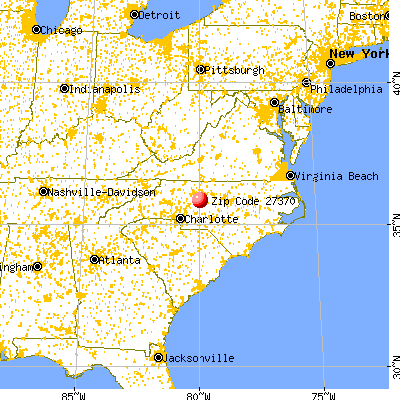
Nearest zip codes: 27350 ,
27263 ,
27360 ,
27260 ,
27262 ,
27317 .
Trinity Zip Code Map
Percentage of family households: This zip code:
46.9%North Carolina:
46.1%
Percentage of households with unmarried partners: This zip code:
5.1%North Carolina:
47.9%
No gay or lesbian households reported
Household received Food Stamps/SNAP in the past 12 months: 882Household did not receive Food Stamps/SNAP in the past 12 months: 4,926
Women who had a birth in the past 12 months: 262 (137 now married , 121 unmarried) Women who did not have a birth in the past 12 months: 3,010 (1,310 now married , 1,699 unmarried)
Housing units in zip code 27370 with a mortgage: 2,834 (370
second mortgage , 378
both second mortgage and home equity loan )
Houses without a mortgage: 200
Median monthly owner costs for units with a mortgage: $1,137
Median monthly owner costs for units without a mortgage: $328
Residents with income below the poverty level in 2022:
This zip code:
9.1%Whole state:
12.8%
Residents with income below 50% of the poverty level in 2022:
This zip code:
3.7%Whole state:
6.8%
Median number of rooms in houses and condos: Median number of rooms in apartments: Notable locations in this zip code not listed on our city pages
Click to draw/clear zip code borders Notable location: (A) . Display/hide its location on the map
Churches in zip code 27370 include: (A) , Andrews Grove Church (B) , Liberty Grove Church (C) , Trindale Church (D) , Westfield Church (E) , Mount Gilead Church (F) , Mount Pleasant Church (G) , Mount Vernon Church (H) , Mount Zion Church (I) . Display/hide their locations on the map
Cemetery: (1) . Display/hide its location on the map
Reservoirs: (A) , Mendenhall Lake (B) , Leath Lake (C) , Thomas Lake (D) . Display/hide their locations on the map
River: (A) . Display/hide its location on the map
Year house built (houses)
4 2020 or later796 2010 to 2019505 2000 to 2009940 1990 to 19991,333 1980 to 19891,218 1970 to 1979589 1960 to 1969325 1950 to 195976 1940 to 1949140 1939 or earlier
Zip code 27370 household income distribution in 2022 306 Less than $10,000324 $10,000 to $14,999173 $15,000 to $19,99998 $20,000 to $24,999185 $25,000 to $29,999120 $30,000 to $34,999306 $35,000 to $39,999273 $40,000 to $44,999154 $45,000 to $49,999502 $50,000 to $59,999648 $60,000 to $74,999832 $75,000 to $99,999793 $100,000 to $124,999358 $125,000 to $149,999546 $150,000 to $199,999187 $200,000 or moreEstimate of home value of owner-occupied houses/condos in 2022 in zip code 27370 13 Less than $10,00089 $10,000 to $14,999135 $15,000 to $19,9997 $25,000 to $29,99929 $30,000 to $34,99935 $35,000 to $39,999223 $40,000 to $49,99932 $50,000 to $59,99936 $60,000 to $69,999192 $70,000 to $79,999184 $80,000 to $89,99990 $90,000 to $99,999509 $100,000 to $124,999310 $125,000 to $149,999674 $150,000 to $174,999384 $175,000 to $199,999485 $200,000 to $249,999285 $250,000 to $299,999366 $300,000 to $399,999250 $400,000 to $499,999150 $500,000 to $749,99934 $750,000 to $999,99918 $1,500,000 to $1,999,999Rent paid by renters in 2022 in zip code 27370 23 $100 to $1499 $200 to $24924 $250 to $29921 $300 to $34956 $350 to $3999 $400 to $44913 $450 to $49949 $500 to $54949 $550 to $5996 $600 to $64983 $700 to $74954 $800 to $89942 $900 to $99912 $1,000 to $1,24912 $1,250 to $1,49912 $2,000 to $2,499118 No cash rent
Median gross rent in 2022: $966.
Median price asked for vacant for-sale houses and condos in 2022: $350,807.
Estimated median house (or condo) value in 2022 for: White Non-Hispanic householders: $207,963Black or African American householders: $176,118American Indian or Alaska Native householders: $165,050Asian householders: $601,947Some other race householders: $145,632Two or more races householders: $199,030Hispanic or Latino householders: $144,078Estimated median house or condo value in 2022: $187,186
27370:
$187,186North Carolina:
$280,600
Lower value quartile - upper value quartile: $119,055 - $254,641
Mean price in 2022: Detached houses: $228,655Here:
$228,655State:
$375,326
Townhouses or other attached units: $216,264Here:
$216,264State:
$317,935
Mobile homes: $85,486Here:
$85,486State:
$124,933
Housing units in structures:
One, detached: 4,829One, attached: 95Two: 3310 to 19: 6Mobile homes: 1,109Boats, RVs, vans, etc.: 12Unemployment : 1.6%
Means of transportation to work in zip code 27370 78.5% 6,005 Drove a car alone7.5% 576 Carpooled0.0% 1 Streetcar or trolley car0.7% 54 Walked0.5% 37 Other means11.1% 851 Worked at homeTravel time to work (commute) in zip code 27370 46 Less than 5 minutes570 5 to 9 minutes546 10 to 14 minutes1,197 15 to 19 minutes1,463 20 to 24 minutes467 25 to 29 minutes908 30 to 34 minutes553 35 to 39 minutes67 40 to 44 minutes514 45 to 59 minutes243 60 to 89 minutes89 90 or more minutes
Percentage of zip code residents living and working in this county: 35.5%
Household type by relationship:
Households: 15,277
Male householders: 2,957 (686 living alone ), Female householders: 2,836 (664 living alone )3,368 spouses (3,342 opposite-sex spouses ), 357 unmarried partners , (357 opposite-sex unmarried partners ), 4,067 children (3,544 natural , 178 adopted , 344 stepchildren ), 546 grandchildren , 25 brothers or sisters , 89 parents , 0 foster children , 700 other relatives , 236 non-relatives In group quarters: 129 (-1 institutionalized population )
Size of family households: 2,103 2-persons , 830 3-persons , 571 4-persons , 449 5-persons , 241 6-persons , 28 7-or-more-persons
Size of nonfamily households: 1,351 1-person , 176 2-persons , 49 4-persons
1,789 married couples with children. single-parent households (341 men , 459 women ).
96.1% of residents of 27370 zip code speak English at home. of residents speak Spanish at home (96% very well, 4% well ).of residents speak other Indo-European language at home (49% very well, 5% well, 27% not well, 19% not at all ).of residents speak Asian or Pacific Island language at home (100% very well ).
Foreign born population: 205 (1.3%)
(43.9%
of them are naturalized citizens )
This zip code:
1.3%Whole state:
8.6%
26% Malaysia 26% Honduras 16% Nepal 13% France 9% Burma (Myanmar) 1% El Salvador 19% American 14% English 7% German 4% Irish 3% African 2% Scotch-Irish 2% Scottish
Year of entry for the foreign-born population
147 2010 or later 75 2000 to 2009 10 1990 to 1999 47 Before 1990
Facilities with environmental interests located in this zip code:
ARCHDALE-TRINITY MIDDLE SCHOO (5105 ARCHDALE ROAD in TRINITY, NC)
(Geographic Names Information System) STATE MASTER (North Carolina facility info) - UNDERGROUND STORAGE TANK PROGRAM (National Center for Education Statistics) - STATE ID-378 Business SIC classification: NONCLASSIFIABLE ESTABLISHMENTSOrganizations: RANDOLPH COUNTY SCHOOLS (SCHOOL DISTRICT)
Alternative names: ARCHDALE-TRINITY MIDDLE SCHOOL
BRAXTON CRAVEN MIDDLE (7037 NC HIGHWAY 62 in TRINITY, NC)
(National Center for Education Statistics) - STATE ID-308 Organizations: RANDOLPH COUNTY SCHOOLS (SCHOOL DISTRICT)
Housing units lacking complete plumbing facilities: 1.8%
Housing units lacking complete kitchen facilities: 1.3%
77.8% Electricity 9.4% Utility gas 5.8% Fuel oil, kerosene, etc. 5.0% Bottled, tank, or LP gas 1.2% Wood 0.6% No fuel used
Population in 1990: 14,290. Population change in the 1990s: +973 (+6.8%).
Place of birth for U.S.-born residents:
This state: 10,459Northeast: 1,135Midwest: 869South: 2,226West: 186
63% of the 27370 zip code residents lived in the same house 5 years ago.
Out of people who lived in different houses, 48% lived in this county.
Out of people who lived in different counties, 50% lived in North Carolina.
91% of the 27370 zip code residents lived in the same house 1 year ago.
Out of people who lived in different houses, 35% moved from this county.
Out of people who lived in different houses, 47% moved from different county within same state.
Out of people who lived in different houses, 21% moved from different state.
Private vs. public school enrollment:
Students in private schools in grades 1 to 8 (elementary and middle school): 228
Here:
18.1%North Carolina:
13.8%
Students in private schools in grades 9 to 12 (high school): 182
Here:
17.4%North Carolina:
11.9%
Students in private undergraduate colleges: 40
Here:
7.7%North Carolina:
19.3%
Occupation by median earnings in the past 12 months ($)
102,926 Computer and mathematical occupations 72,222 Business and financial operations occupations 67,769 Transportation occupations 67,191 Architecture and engineering occupations 59,215 Health technologists and technicians 57,819 Management occupations
Top industries in this zip code by the number of employees in 2005:
Management of Companies and Enterprises: Corporate, Subsidiary, and Regional Managing Offices (500-999 employees: 1 establishment)Health Care and Social Assistance: Nursing Care Facilities (100-249: 1)Other Services (except Public Administration): Religious Organizations (10-19: 1, 5-9: 5, 1-4: 6)Health Care and Social Assistance: Child Day Care Services (20-49: 1, 1-4: 3)Professional, Scientific, and Technical Services: Commercial Photography (20-49: 1, 1-4: 2)
People in group quarters in 2010:
133 people in nursing facilities/skilled-nursing facilities
10 people in residential treatment centers for adults
People in group quarters in 2000:
137 people in nursing homes
Fatal accident statistics in 2014:
Fatal accident count: 4Vehicles involved in fatal accidents: 10Fatal accidents caused by drunken drivers: 1Fatalities: 4Persons involved in fatal accidents: 14Pedestrians involved in fatal accidents: 0
Fatal accident statistics in 2013:
Fatal accident count: 1Vehicles involved in fatal accidents: 1Fatal accidents caused by drunken drivers: 1Fatalities: 1Persons involved in fatal accidents: 1Pedestrians involved in fatal accidents: 0
Home Mortgage Disclosure Act Aggregated Statistics For Year 2009(Based on 8 partial tracts) A) FHA, FSA/RHS & VA B) Conventional C) Refinancings D) Home Improvement Loans F) Non-occupant Loans on G) Loans On Manufactured Number Average Value Number Average Value Number Average Value Number Average Value Number Average Value Number Average Value
LOANS ORIGINATED 115 $131,589 123 $134,667 657 $150,206 32 $40,762 40 $99,700 35 $74,491 APPLICATIONS APPROVED, NOT ACCEPTED 7 $144,757 9 $126,341 49 $146,545 5 $18,620 0 $0 4 $49,862 APPLICATIONS DENIED 25 $110,819 29 $78,938 285 $150,188 24 $23,891 18 $80,641 19 $84,775 APPLICATIONS WITHDRAWN 8 $91,842 28 $140,703 143 $156,112 8 $89,349 3 $87,993 5 $69,468 FILES CLOSED FOR INCOMPLETENESS 2 $85,970 1 $158,330 74 $154,443 2 $72,660 1 $132,060 5 $73,100
Aggregated Statistics For Year 2008(Based on 8 partial tracts) A) FHA, FSA/RHS & VA B) Conventional C) Refinancings D) Home Improvement Loans F) Non-occupant Loans on G) Loans On Manufactured Number Average Value Number Average Value Number Average Value Number Average Value Number Average Value Number Average Value
LOANS ORIGINATED 125 $122,838 195 $156,272 473 $146,448 44 $61,437 39 $105,588 41 $73,196 APPLICATIONS APPROVED, NOT ACCEPTED 2 $126,525 15 $77,803 88 $117,067 11 $37,565 6 $100,260 7 $43,926 APPLICATIONS DENIED 28 $139,856 32 $135,822 433 $127,983 64 $42,940 12 $139,418 66 $79,544 APPLICATIONS WITHDRAWN 23 $118,558 24 $108,824 195 $142,848 6 $79,703 10 $108,915 17 $80,375 FILES CLOSED FOR INCOMPLETENESS 3 $111,660 2 $109,855 32 $134,145 2 $23,030 0 $0 6 $74,750
Aggregated Statistics For Year 2007(Based on 8 partial tracts) A) FHA, FSA/RHS & VA B) Conventional C) Refinancings D) Home Improvement Loans F) Non-occupant Loans on G) Loans On Manufactured Number Average Value Number Average Value Number Average Value Number Average Value Number Average Value Number Average Value
LOANS ORIGINATED 59 $115,907 414 $140,321 499 $124,797 83 $41,515 64 $123,640 54 $71,147 APPLICATIONS APPROVED, NOT ACCEPTED 1 $92,650 43 $134,880 118 $100,985 18 $33,423 11 $157,493 9 $58,719 APPLICATIONS DENIED 7 $103,021 72 $116,084 417 $113,493 68 $54,335 19 $135,682 55 $76,582 APPLICATIONS WITHDRAWN 5 $101,366 34 $122,573 204 $135,354 7 $67,927 8 $117,721 18 $94,639 FILES CLOSED FOR INCOMPLETENESS 2 $113,605 5 $119,480 60 $158,459 2 $80,600 1 $28,350 5 $61,002
Aggregated Statistics For Year 2006(Based on 8 partial tracts) A) FHA, FSA/RHS & VA B) Conventional C) Refinancings D) Home Improvement Loans F) Non-occupant Loans on G) Loans On Manufactured Number Average Value Number Average Value Number Average Value Number Average Value Number Average Value Number Average Value
LOANS ORIGINATED 69 $119,125 458 $125,288 634 $105,388 70 $45,424 64 $91,595 60 $66,904 APPLICATIONS APPROVED, NOT ACCEPTED 5 $112,644 54 $115,019 130 $92,093 20 $32,842 3 $54,010 11 $55,923 APPLICATIONS DENIED 9 $117,300 90 $114,417 481 $110,632 69 $61,332 14 $150,159 74 $66,954 APPLICATIONS WITHDRAWN 6 $107,838 52 $114,662 198 $112,221 28 $74,320 3 $109,063 20 $81,176 FILES CLOSED FOR INCOMPLETENESS 1 $80,200 11 $180,441 73 $142,874 4 $42,585 3 $124,623 1 $133,440
Aggregated Statistics For Year 2005(Based on 8 partial tracts) A) FHA, FSA/RHS & VA B) Conventional C) Refinancings D) Home Improvement Loans E) Loans on Dwellings For 5+ Families F) Non-occupant Loans on G) Loans On Manufactured Number Average Value Number Average Value Number Average Value Number Average Value Number Average Value Number Average Value Number Average Value
LOANS ORIGINATED 67 $124,669 489 $122,944 781 $105,544 85 $47,345 2 $102,090 71 $85,762 73 $68,920 APPLICATIONS APPROVED, NOT ACCEPTED 10 $101,614 67 $105,028 157 $92,484 20 $33,306 0 $0 9 $80,154 22 $67,255 APPLICATIONS DENIED 12 $98,655 102 $101,216 641 $106,814 91 $49,028 0 $0 18 $60,530 130 $62,310 APPLICATIONS WITHDRAWN 6 $97,870 56 $125,511 306 $114,293 24 $109,704 0 $0 10 $139,562 25 $66,398 FILES CLOSED FOR INCOMPLETENESS 2 $60,640 9 $143,260 54 $140,685 0 $0 0 $0 0 $0 1 $89,190
Aggregated Statistics For Year 2004(Based on 8 partial tracts) A) FHA, FSA/RHS & VA B) Conventional C) Refinancings D) Home Improvement Loans F) Non-occupant Loans on G) Loans On Manufactured Number Average Value Number Average Value Number Average Value Number Average Value Number Average Value Number Average Value
LOANS ORIGINATED 61 $101,065 505 $116,470 673 $105,245 59 $30,147 59 $76,085 70 $64,363 APPLICATIONS APPROVED, NOT ACCEPTED 4 $90,895 53 $90,376 116 $99,703 7 $39,213 5 $79,442 22 $57,019 APPLICATIONS DENIED 11 $101,044 116 $85,817 484 $99,822 69 $51,861 16 $65,915 123 $66,536 APPLICATIONS WITHDRAWN 8 $133,362 32 $127,949 228 $105,050 16 $60,520 3 $91,727 21 $84,290 FILES CLOSED FOR INCOMPLETENESS 0 $0 9 $99,393 49 $124,161 5 $29,816 5 $87,250 2 $40,090
Aggregated Statistics For Year 2003(Based on 8 partial tracts) A) FHA, FSA/RHS & VA B) Conventional C) Refinancings D) Home Improvement Loans F) Non-occupant Loans on Number Average Value Number Average Value Number Average Value Number Average Value Number Average Value
LOANS ORIGINATED 61 $113,675 389 $113,343 1,494 $111,690 76 $19,917 75 $114,695 APPLICATIONS APPROVED, NOT ACCEPTED 7 $107,367 71 $87,964 155 $109,750 11 $15,501 9 $81,807 APPLICATIONS DENIED 6 $62,687 137 $81,683 446 $100,646 51 $29,766 13 $70,693 APPLICATIONS WITHDRAWN 9 $139,051 45 $141,112 227 $114,340 4 $29,905 4 $66,230 FILES CLOSED FOR INCOMPLETENESS 0 $0 8 $144,601 31 $91,244 5 $32,644 0 $0
Aggregated Statistics For Year 2002(Based on 8 partial tracts) A) FHA, FSA/RHS & VA B) Conventional C) Refinancings D) Home Improvement Loans E) Loans on Dwellings For 5+ Families F) Non-occupant Loans on Number Average Value Number Average Value Number Average Value Number Average Value Number Average Value Number Average Value
LOANS ORIGINATED 106 $105,354 425 $108,175 1,062 $105,630 55 $21,810 5 $444,440 82 $83,996 APPLICATIONS APPROVED, NOT ACCEPTED 8 $93,004 96 $83,701 175 $88,243 11 $14,913 0 $0 3 $6,680 APPLICATIONS DENIED 25 $102,907 165 $70,219 371 $88,452 72 $16,702 0 $0 12 $63,814 APPLICATIONS WITHDRAWN 15 $100,581 46 $127,138 198 $97,242 17 $48,566 0 $0 5 $81,046 FILES CLOSED FOR INCOMPLETENESS 5 $122,714 8 $71,180 33 $81,845 0 $0 0 $0 2 $94,380
Aggregated Statistics For Year 2001(Based on 8 partial tracts) A) FHA, FSA/RHS & VA B) Conventional C) Refinancings D) Home Improvement Loans F) Non-occupant Loans on Number Average Value Number Average Value Number Average Value Number Average Value Number Average Value
LOANS ORIGINATED 77 $103,762 412 $108,646 899 $102,342 106 $23,664 46 $77,113 APPLICATIONS APPROVED, NOT ACCEPTED 6 $115,198 93 $62,027 130 $88,030 13 $66,565 8 $58,271 APPLICATIONS DENIED 5 $83,678 220 $66,811 355 $84,279 79 $14,337 21 $29,820 APPLICATIONS WITHDRAWN 7 $98,830 55 $94,660 158 $82,462 24 $37,576 4 $44,335 FILES CLOSED FOR INCOMPLETENESS 0 $0 8 $140,199 25 $108,088 2 $39,605 0 $0
Aggregated Statistics For Year 2000(Based on 8 partial tracts) A) FHA, FSA/RHS & VA B) Conventional C) Refinancings D) Home Improvement Loans F) Non-occupant Loans on Number Average Value Number Average Value Number Average Value Number Average Value Number Average Value
LOANS ORIGINATED 85 $102,786 403 $95,858 298 $75,508 90 $21,072 54 $50,180 APPLICATIONS APPROVED, NOT ACCEPTED 30 $70,218 98 $55,059 107 $65,549 31 $16,501 7 $42,323 APPLICATIONS DENIED 31 $56,856 364 $51,874 266 $70,567 63 $18,170 13 $54,499 APPLICATIONS WITHDRAWN 7 $82,460 35 $90,793 138 $78,971 8 $45,911 1 $55,310 FILES CLOSED FOR INCOMPLETENESS 0 $0 11 $55,034 34 $74,827 1 $6,220 3 $129,603
Aggregated Statistics For Year 1999(Based on 4 partial tracts) A) FHA, FSA/RHS & VA B) Conventional C) Refinancings D) Home Improvement Loans E) Loans on Dwellings For 5+ Families F) Non-occupant Loans on Number Average Value Number Average Value Number Average Value Number Average Value Number Average Value Number Average Value
LOANS ORIGINATED 38 $99,879 215 $90,553 279 $78,612 47 $18,830 1 $760,720 26 $45,391 APPLICATIONS APPROVED, NOT ACCEPTED 1 $43,830 87 $57,622 113 $62,826 11 $15,681 0 $0 11 $62,685 APPLICATIONS DENIED 3 $72,153 196 $55,090 166 $66,680 32 $14,393 0 $0 13 $70,675 APPLICATIONS WITHDRAWN 2 $91,930 17 $83,006 98 $69,991 10 $31,872 0 $0 2 $59,730 FILES CLOSED FOR INCOMPLETENESS 0 $0 14 $95,364 35 $71,611 0 $0 0 $0 2 $96,895
Detailed HMDA statistics for the following Tracts:
0305.01
,
0315.01 ,
0315.02 ,
0316.02
Private Mortgage Insurance Companies Aggregated Statistics For Year 2009(Based on 8 partial tracts) A) Conventional B) Refinancings C) Non-occupant Loans on D) Loans On Manufactured Number Average Value Number Average Value Number Average Value Number Average Value
LOANS ORIGINATED 20 $184,002 27 $150,401 0 $0 0 $0 APPLICATIONS APPROVED, NOT ACCEPTED 2 $166,175 14 $229,131 0 $0 0 $0 APPLICATIONS DENIED 4 $155,340 3 $181,720 0 $0 1 $142,430 APPLICATIONS WITHDRAWN 0 $0 2 $273,470 0 $0 0 $0 FILES CLOSED FOR INCOMPLETENESS 4 $202,230 2 $93,645 2 $90,200 0 $0
Aggregated Statistics For Year 2008(Based on 8 partial tracts) A) Conventional B) Refinancings C) Non-occupant Loans on Number Average Value Number Average Value Number Average Value
LOANS ORIGINATED 69 $168,036 67 $187,655 3 $130,040 APPLICATIONS APPROVED, NOT ACCEPTED 19 $176,266 18 $223,391 1 $142,430 APPLICATIONS DENIED 4 $176,405 8 $190,835 3 $253,143 APPLICATIONS WITHDRAWN 2 $194,255 0 $0 2 $90,200 FILES CLOSED FOR INCOMPLETENESS 0 $0 0 $0 0 $0
Aggregated Statistics For Year 2007(Based on 8 partial tracts) A) Conventional B) Refinancings C) Non-occupant Loans on D) Loans On Manufactured Number Average Value Number Average Value Number Average Value Number Average Value
LOANS ORIGINATED 140 $151,929 38 $145,603 6 $118,072 2 $93,605 APPLICATIONS APPROVED, NOT ACCEPTED 13 $191,845 14 $197,654 2 $58,465 1 $46,320 APPLICATIONS DENIED 0 $0 2 $90,200 0 $0 0 $0 APPLICATIONS WITHDRAWN 2 $333,140 3 $322,717 0 $0 0 $0 FILES CLOSED FOR INCOMPLETENESS 0 $0 0 $0 0 $0 0 $0
Aggregated Statistics For Year 2006(Based on 8 partial tracts) A) Conventional B) Refinancings C) Non-occupant Loans on D) Loans On Manufactured Number Average Value Number Average Value Number Average Value Number Average Value
LOANS ORIGINATED 88 $150,366 45 $145,744 6 $113,773 1 $82,970 APPLICATIONS APPROVED, NOT ACCEPTED 11 $145,221 14 $126,449 5 $107,638 0 $0 APPLICATIONS DENIED 2 $109,000 1 $53,240 0 $0 1 $53,240 APPLICATIONS WITHDRAWN 2 $295,015 5 $118,518 0 $0 0 $0 FILES CLOSED FOR INCOMPLETENESS 0 $0 0 $0 0 $0 0 $0
Aggregated Statistics For Year 2005(Based on 8 partial tracts) A) Conventional B) Refinancings C) Non-occupant Loans on D) Loans On Manufactured Number Average Value Number Average Value Number Average Value Number Average Value
LOANS ORIGINATED 71 $143,572 76 $120,800 10 $130,069 5 $75,830 APPLICATIONS APPROVED, NOT ACCEPTED 12 $126,542 31 $125,138 0 $0 1 $67,070 APPLICATIONS DENIED 0 $0 0 $0 0 $0 0 $0 APPLICATIONS WITHDRAWN 7 $188,893 8 $100,531 0 $0 2 $92,975 FILES CLOSED FOR INCOMPLETENESS 0 $0 0 $0 0 $0 0 $0
Aggregated Statistics For Year 2004(Based on 8 partial tracts) A) Conventional B) Refinancings C) Non-occupant Loans on D) Loans On Manufactured Number Average Value Number Average Value Number Average Value Number Average Value
LOANS ORIGINATED 90 $134,976 89 $120,835 6 $75,737 6 $88,715 APPLICATIONS APPROVED, NOT ACCEPTED 21 $123,517 26 $151,026 0 $0 1 $136,210 APPLICATIONS DENIED 2 $69,085 6 $116,485 2 $66,815 1 $73,980 APPLICATIONS WITHDRAWN 2 $283,130 6 $208,773 1 $426,590 0 $0 FILES CLOSED FOR INCOMPLETENESS 2 $106,905 2 $94,415 0 $0 0 $0
Aggregated Statistics For Year 2003(Based on 8 partial tracts) A) Conventional B) Refinancings C) Non-occupant Loans on Number Average Value Number Average Value Number Average Value
LOANS ORIGINATED 127 $131,268 228 $124,725 5 $114,832 APPLICATIONS APPROVED, NOT ACCEPTED 27 $128,983 44 $131,313 2 $105,160 APPLICATIONS DENIED 3 $146,153 6 $100,957 0 $0 APPLICATIONS WITHDRAWN 6 $145,897 12 $126,196 0 $0 FILES CLOSED FOR INCOMPLETENESS 0 $0 2 $109,410 0 $0
Aggregated Statistics For Year 2002(Based on 8 partial tracts) A) Conventional B) Refinancings C) Non-occupant Loans on Number Average Value Number Average Value Number Average Value
LOANS ORIGINATED 117 $119,335 202 $117,699 8 $82,316 APPLICATIONS APPROVED, NOT ACCEPTED 14 $122,214 65 $126,158 3 $64,530 APPLICATIONS DENIED 4 $87,138 20 $115,408 2 $66,815 APPLICATIONS WITHDRAWN 5 $236,030 12 $94,572 1 $31,110 FILES CLOSED FOR INCOMPLETENESS 0 $0 2 $94,815 0 $0
Aggregated Statistics For Year 2001(Based on 8 partial tracts) A) Conventional B) Refinancings C) Non-occupant Loans on Number Average Value Number Average Value Number Average Value
LOANS ORIGINATED 140 $123,735 149 $114,609 8 $71,582 APPLICATIONS APPROVED, NOT ACCEPTED 23 $119,949 26 $117,211 2 $137,385 APPLICATIONS DENIED 4 $132,322 20 $130,900 0 $0 APPLICATIONS WITHDRAWN 5 $116,062 4 $128,040 0 $0 FILES CLOSED FOR INCOMPLETENESS 2 $91,870 6 $107,128 0 $0
Aggregated Statistics For Year 2000(Based on 8 partial tracts) A) Conventional B) Refinancings C) Non-occupant Loans on Number Average Value Number Average Value Number Average Value
LOANS ORIGINATED 91 $120,395 29 $90,269 1 $43,560 APPLICATIONS APPROVED, NOT ACCEPTED 14 $123,724 5 $84,816 0 $0 APPLICATIONS DENIED 11 $124,481 4 $101,290 1 $54,620 APPLICATIONS WITHDRAWN 2 $98,255 1 $162,480 0 $0 FILES CLOSED FOR INCOMPLETENESS 0 $0 0 $0 0 $0
Aggregated Statistics For Year 1999(Based on 4 partial tracts) A) Conventional B) Refinancings C) Non-occupant Loans on Number Average Value Number Average Value Number Average Value
LOANS ORIGINATED 56 $117,503 25 $97,610 1 $82,470 APPLICATIONS APPROVED, NOT ACCEPTED 3 $179,080 4 $148,258 0 $0 APPLICATIONS DENIED 1 $114,760 3 $122,727 0 $0 APPLICATIONS WITHDRAWN 0 $0 2 $138,670 0 $0 FILES CLOSED FOR INCOMPLETENESS 1 $65,360 1 $99,880 0 $0
Detailed PMIC statistics for the following Tracts:
0305.01
,
0315.01 ,
0315.02 ,
0316.02
2002 - 2018 National Fire Incident Reporting System (NFIRS) incidents See full 2006 National Fire Incident Reporting System statistics for zip code 27370, North Carolina
Most common first names in zip code 27370 among deceased individuals Name Count Lived (average)
William 71 73.4 years John 67 74.1 years James 60 69.6 years Robert 49 72.3 years Mary 47 79.0 years Thomas 36 76.5 years Charles 26 72.5 years Ruth 24 77.7 years Ruby 22 77.0 years George 20 75.8 years
Most common last names in zip code 27370 among deceased individuals Last name Count Lived (average)
Smith 38 69.1 years Brown 37 71.6 years Hill 34 73.1 years Kennedy 30 74.5 years Davis 28 73.8 years Miller 26 74.4 years Johnson 25 72.9 years Wall 22 71.1 years Hughes 19 74.9 years Pierce 19 76.1 years
Businesses in zip code 27370
Domino's Pizza: 1YMCA: 1


 Nearest zip codes: 27350, 27263, 27360, 27260, 27262, 27317.
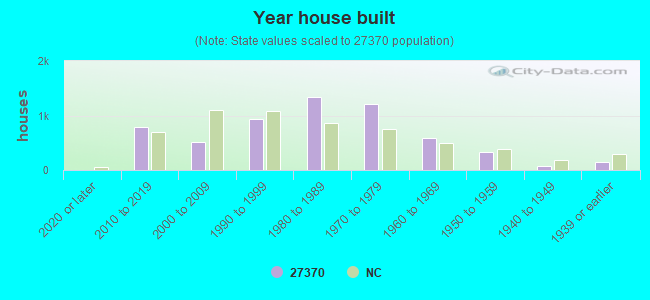

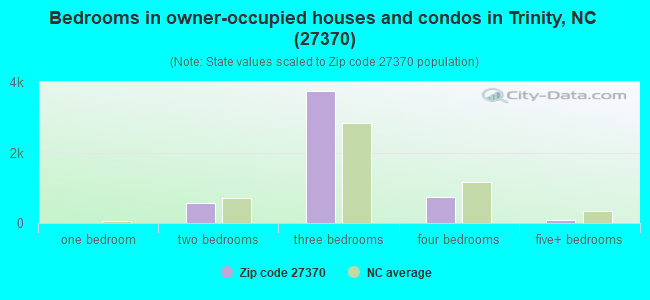
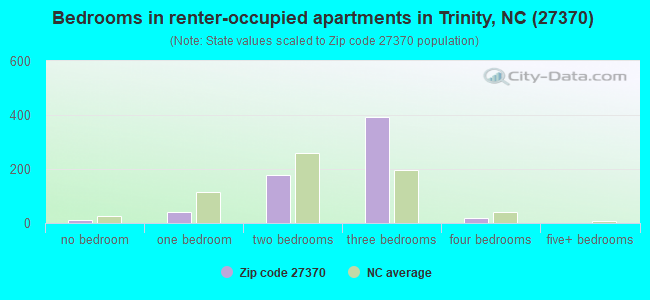
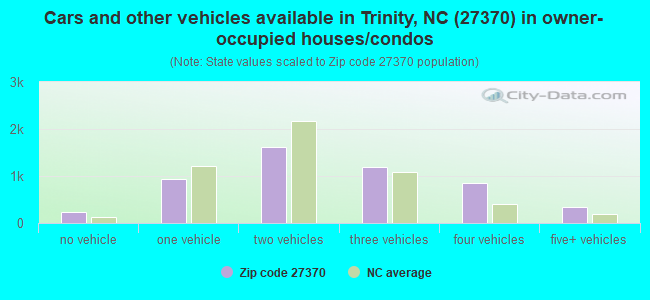
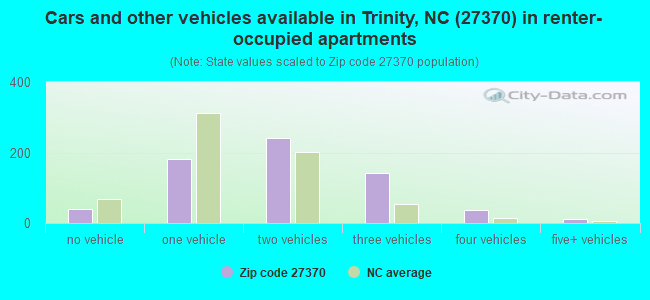


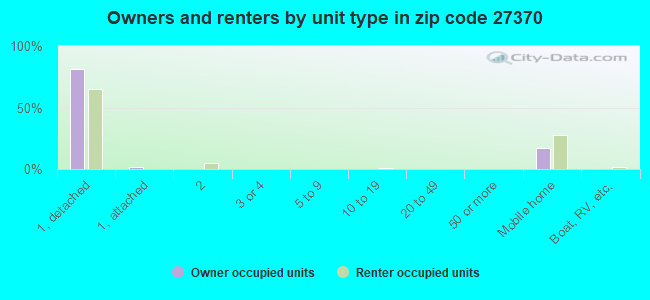


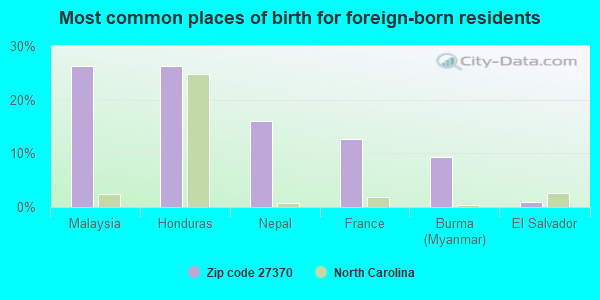
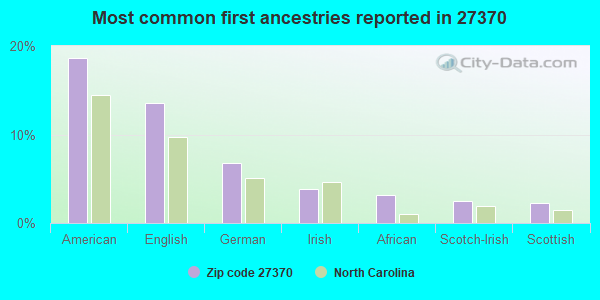
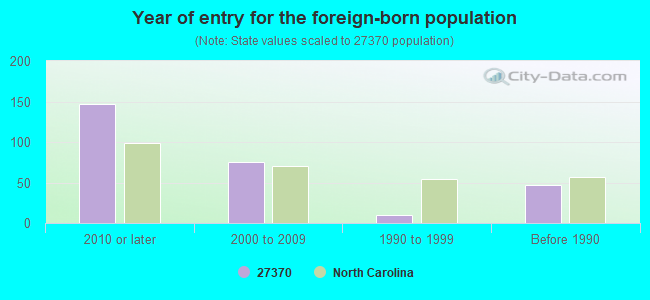

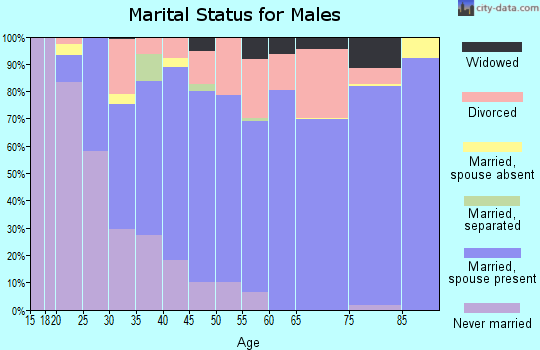
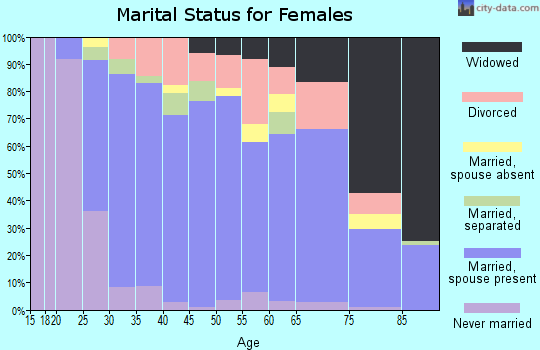
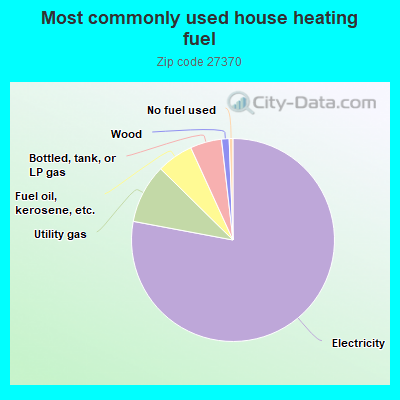
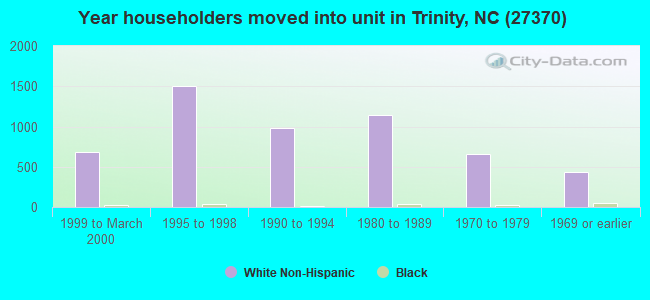
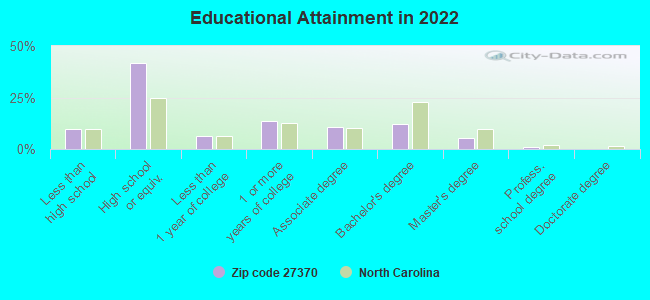
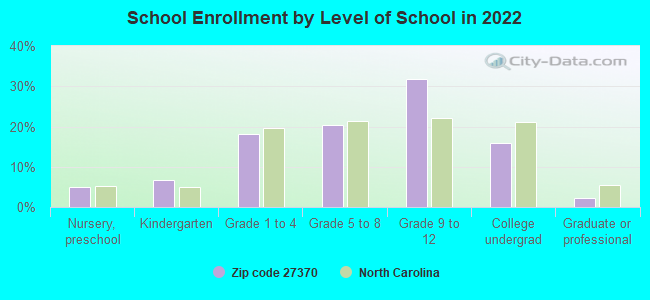
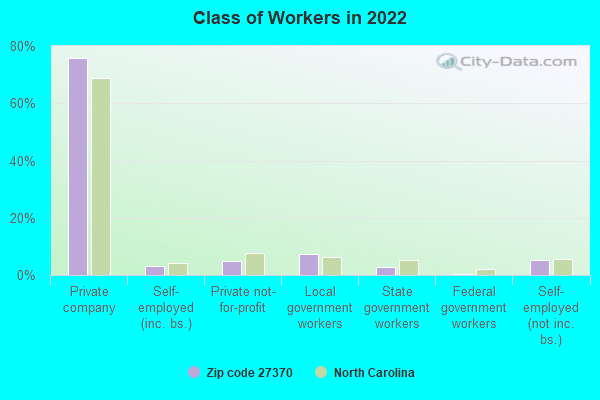
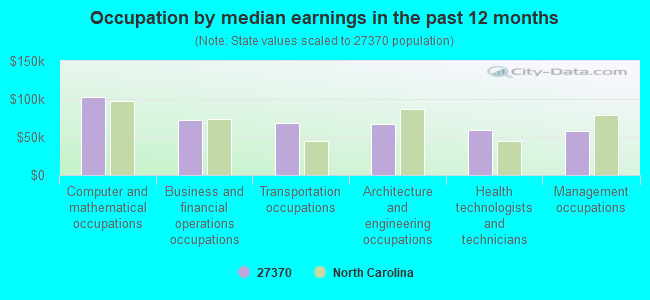
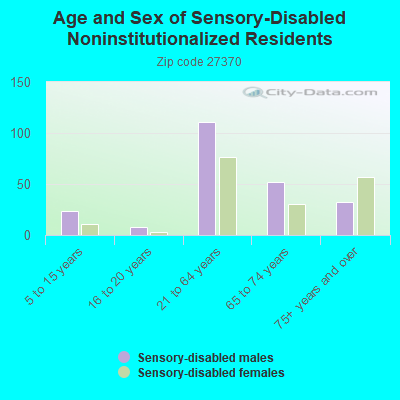
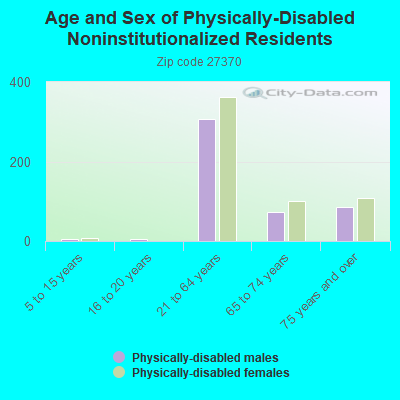
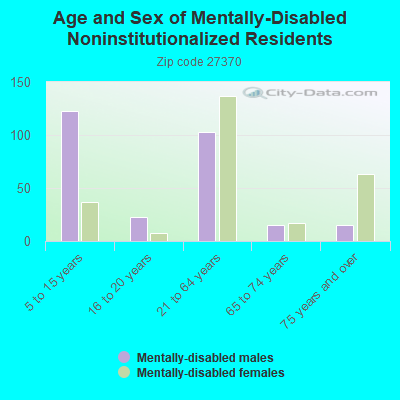
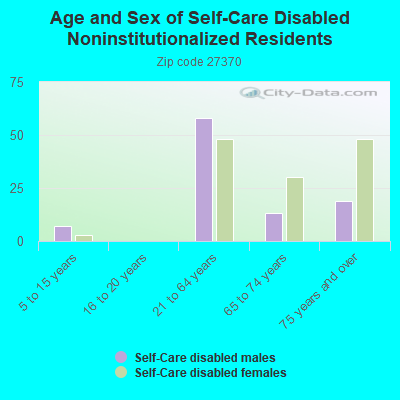
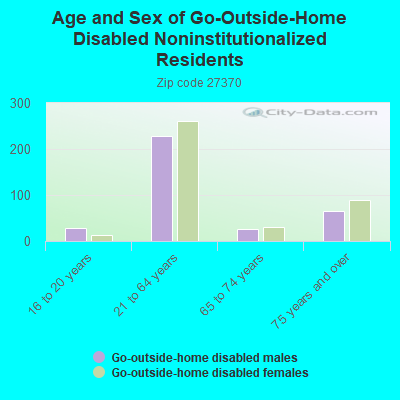
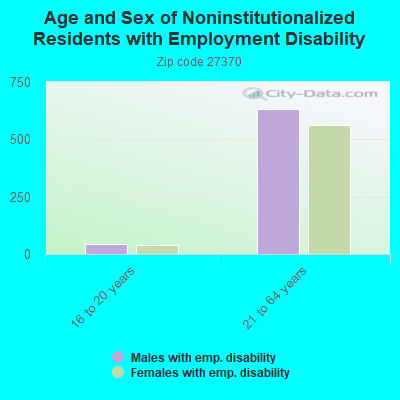
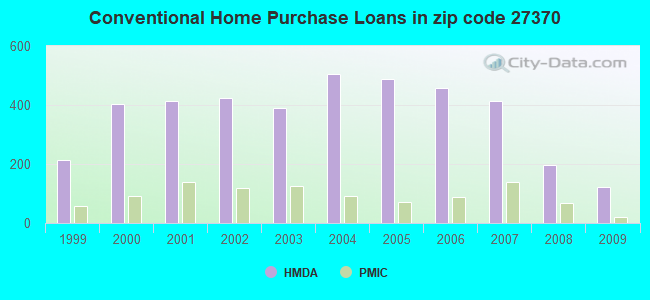
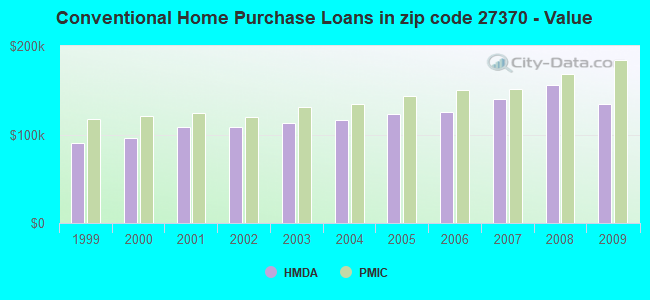
 According to the data from the years 2002 - 2018 the average number of fires per year is 76. The highest number of reported fire incidents - 120 took place in 2007, and the least - 39 in 2017. The data has a declining trend.
 When looking into fire subcategories, the most reports belonged to: Outside Fires (47.4%), and Structure Fires (34.8%).