Estimated zip code population in 2022: 15,719 Zip code population in 2010: 17,289 Zip code population in 2000: 39,842
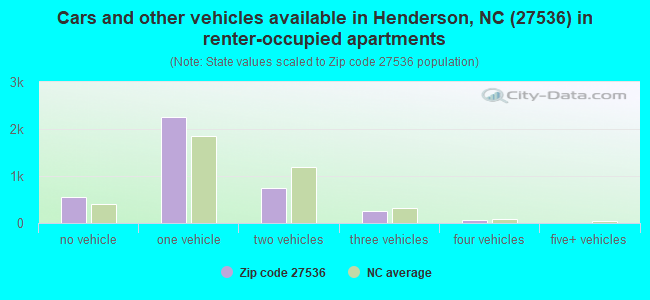
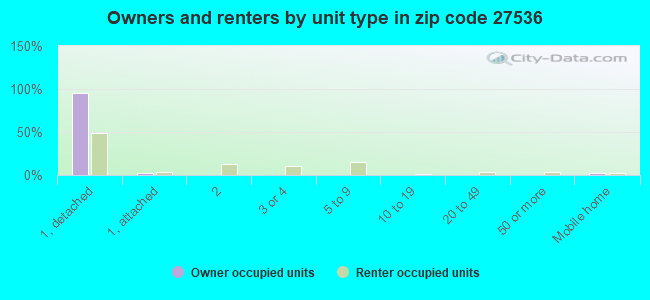
Houses and condos: 7,338 Renter-occupied apartments: 3,910
% of renters here:
64%
State:
33%
March 2022 cost of living index in zip code 27536: 79.7 (low, U.S. average is 100)
Land area: 12.8 sq. mi. Water area: 0.0 sq. mi.
Population density: 1,231 people per square mile
(low).
OSM Map
General Map
Google Map
MSN Map
OSM Map
General Map
Google Map
MSN Map
OSM Map
General Map
Google Map
MSN Map
OSM Map
General Map
Google Map
MSN Map
Please wait while loading the map...
Real estate property taxes paid for housing units in 2022:
This zip code:
1.0% ($1,249)
North Carolina:
0.6% ($1,769)
Median real estate property taxes paid for housing units with mortgages in 2022: $1,349 (0.8%) Median real estate property taxes paid for housing units with no mortgage in 2022: $1,135 (1.0%)
Business Search- 14 Million verified businesses
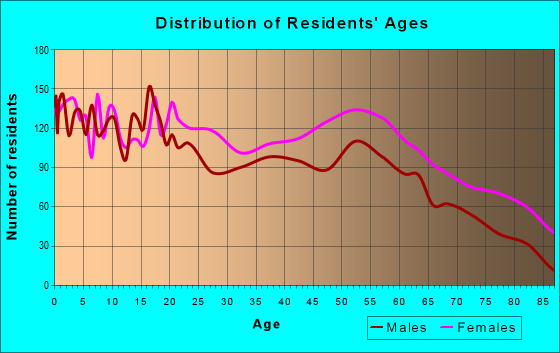
Males: 6,780
(43.1%)
Females: 8,943
(56.9%)
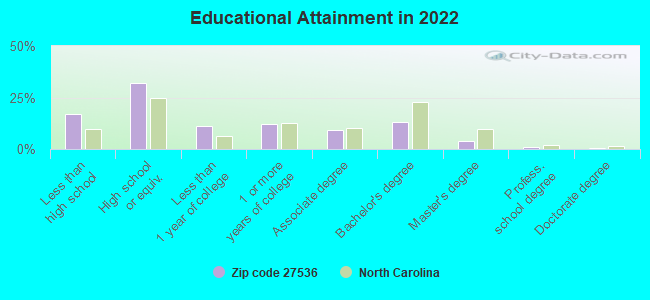
For population 25 years and over in 27536:
High school or higher: 81.8%
Bachelor's degree or higher: 18.4%
Graduate or professional degree: 5.3%
Unemployed: 6.4%
Mean travel time to work (commute): 21.5 minutes
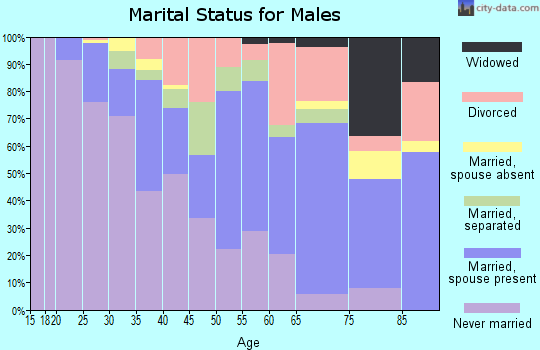
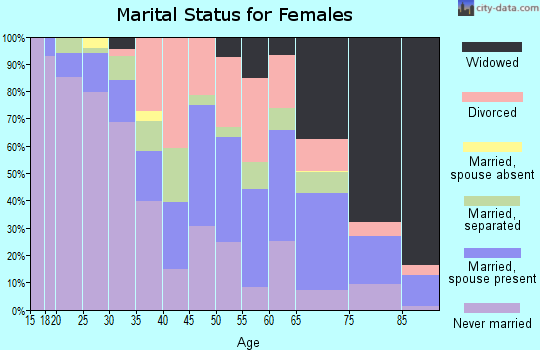
For population 15 years and over in 27536:
Never married: 47.1%
Now married: 29.5%
Separated: 4.0%
Widowed: 6.5%
Divorced: 12.9%
Zip code 27536 compared to state average:
Median household income below state average.
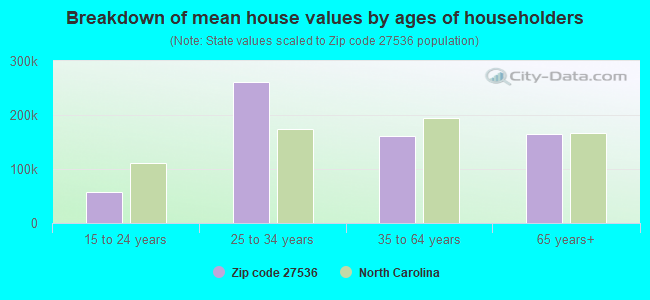
Median house value below state average.
Unemployed percentage above state average.
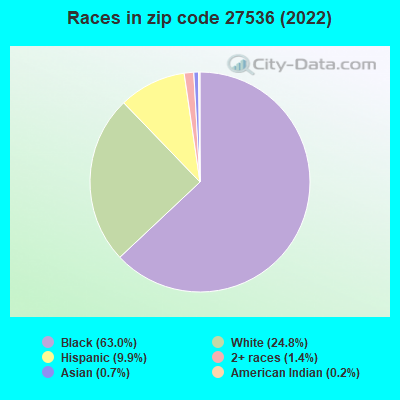
Black race population percentage significantly above state average.
Median age below state average.
Renting percentage above state average.
Length of stay since moving in significantly above state average.
House age above state average.
Percentage of population with a bachelor's degree or higher below state average.
Averages for the 2020 tax year for zip code 27536, filed in 2021:
Average Adjusted Gross Income (AGI) in 2020: $37,530 (Individual Income Tax Returns)
Here:
$37,530
State:
$70,020
Salary/wage: $29,490 (reported on 86.3% of returns)
Here:
$29,490
State:
$58,387
(% of AGI for various income ranges: 1300.7% for AGIs below $25k, 3975.1% for AGIs $25k-50k, 7031.6% for AGIs $50k-75k, 11698.6% for AGIs $75k-100k, 14978.5% for AGIs $100k-200k)
Taxable interest for individuals: $1,729 (reported on 15.6% of returns)
This zip code:
$1,729
North Carolina:
$1,479
(% of AGI for various income ranges: 7.7% for AGIs below $25k, 8.7% for AGIs $25k-50k, 44.8% for AGIs $50k-75k, 104.3% for AGIs $75k-100k, 402.3% for AGIs $100k-200k)
Ordinary dividends: $11,633 (reported on 7.3% of returns)
Here:
$11,633
State:
$7,888
(% of AGI for various income ranges: 8.4% for AGIs below $25k, 28.0% for AGIs $25k-50k, 94.5% for AGIs $50k-75k, 270.0% for AGIs $75k-100k, 1120.8% for AGIs $100k-200k)
Net capital gain/loss in AGI: +$16,598 (reported on 6.5% of returns)
Here:
+$16,598
State:
+$23,652
(% of AGI for various income ranges: 3.7% for AGIs below $25k, 13.4% for AGIs $25k-50k, 72.3% for AGIs $50k-75k, 242.1% for AGIs $75k-100k, 1087.7% for AGIs $100k-200k)
Profit/loss from business: +$7,658 (reported on 12.3% of returns)
Here:
+$7,658
State:
+$11,710
(% of AGI for various income ranges: 73.6% for AGIs below $25k, 53.9% for AGIs $25k-50k, 161.8% for AGIs $50k-75k, 752.1% for AGIs $75k-100k, 800.0% for AGIs $100k-200k)
Taxable individual retirement arrangement distribution: $14,892 (reported on 5.1% of returns)
27536:
$14,892
North Carolina:
$20,247
(% of AGI for various income ranges: 25.2% for AGIs below $25k, 56.7% for AGIs $25k-50k, 135.7% for AGIs $50k-75k, 605.0% for AGIs $75k-100k, 1192.3% for AGIs $100k-200k)
Total itemized deductions: $32,926 (reported on 4.2% of returns)
Here:
$32,926
State:
$34,549
(% of AGI for various income ranges: 17.0% for AGIs below $25k, 153.2% for AGIs $25k-50k, 351.8% for AGIs $50k-75k, 635.7% for AGIs $75k-100k, 1566.2% for AGIs $100k-200k)
Charity contributions: $10,907 (reported on 3.9% of returns)
Here:
$10,907
State:
$13,360
(% of AGI for various income ranges: 2.7% for AGIs below $25k, 31.4% for AGIs $25k-50k, 82.0% for AGIs $50k-75k, 194.3% for AGIs $75k-100k, 545.4% for AGIs $100k-200k)
Taxes paid: $5,600 (reported on 4.2% of returns)
27536:
$5,600
State:
$7,586
(% of AGI for various income ranges: 2.1% for AGIs below $25k, 17.1% for AGIs $25k-50k, 56.4% for AGIs $50k-75k, 134.3% for AGIs $75k-100k, 335.4% for AGIs $100k-200k)
Earned income credit: $2,601 (reported on 38.3% of returns)
Here:
$2,601
State:
$2,337
(% of AGI for various income ranges: 180.2% for AGIs below $25k, 111.9% for AGIs $25k-50k)
Percentage of individuals using paid preparers for their 2020 taxes: 88.4%
Here:
88%
State:
93%
(% for various income ranges: 89.7% for AGIs below $25k, 87.2% for AGIs $25k-50k, 85.1% for AGIs $50k-75k, 86.7% for AGIs $75k-100k, 88.9% for AGIs $100k-200k, 90.9% for AGIs over 200k)
Averages for the 2012 tax year for zip code 27536, filed in 2013:
Average Adjusted Gross Income (AGI) in 2012: $36,699 (Individual Income Tax Returns)
Here:
$36,699
State:
$54,937
Salary/wage: $28,634 (reported on 86.4% of returns)
Here:
$28,634
State:
$46,336
(% of AGI for various income ranges: 82.2% for AGIs below $25k, 83.8% for AGIs $25k-50k, 70.1% for AGIs $50k-75k, 59.8% for AGIs $75k-100k, 56.3% for AGIs $100k-200k, 41.4% for AGIs over 200k)
Taxable interest for individuals: $2,399 (reported on 19.3% of returns)
This zip code:
$2,399
North Carolina:
$1,298
(% of AGI for various income ranges: 0.5% for AGIs below $25k, 0.6% for AGIs $25k-50k, 1.2% for AGIs $50k-75k, 1.5% for AGIs $75k-100k, 1.6% for AGIs $100k-200k, 2.6% for AGIs over 200k)
Ordinary dividends: $8,877 (reported on 9.6% of returns)
Here:
$8,877
State:
$6,213
(% of AGI for various income ranges: 0.5% for AGIs below $25k, 0.8% for AGIs $25k-50k, 2.0% for AGIs $50k-75k, 3.2% for AGIs $75k-100k, 5.3% for AGIs $100k-200k, 3.9% for AGIs over 200k)
Net capital gain/loss in AGI: +$11,548 (reported on 7.8% of returns)
Here:
+$11,548
State:
+$12,740
(% of AGI for various income ranges: 0.2% for AGIs $25k-50k, 0.5% for AGIs $50k-75k, 1.7% for AGIs $75k-100k, 3.3% for AGIs $100k-200k, 8.5% for AGIs over 200k)
Profit/loss from business: +$6,959 (reported on 13.1% of returns)
Here:
+$6,959
State:
+$10,311
(% of AGI for various income ranges: 4.1% for AGIs below $25k, 0.8% for AGIs $25k-50k, 2.6% for AGIs $50k-75k, 2.1% for AGIs $75k-100k, 4.0% for AGIs $100k-200k, 1.8% for AGIs over 200k)
Taxable individual retirement arrangement distribution: $12,194 (reported on 7.4% of returns)
27536:
$12,194
North Carolina:
$15,575
(% of AGI for various income ranges: 1.3% for AGIs below $25k, 1.1% for AGIs $25k-50k, 3.7% for AGIs $50k-75k, 5.5% for AGIs $75k-100k, 7.6% for AGIs $100k-200k)
Self-employment retirement plans: $21,450 (reported on 0.3% of returns)
27536:
$21,450
North Carolina:
$21,078
Total itemized deductions: $22,182 (24% of AGI, reported on 20.4% of returns)
Here:
$22,182
State:
$23,438
Here:
23.8% of AGI
State:
21.5% of AGI
(% of AGI for various income ranges: 6.4% for AGIs below $25k, 11.5% for AGIs $25k-50k, 15.8% for AGIs $50k-75k, 16.5% for AGIs $75k-100k, 17.7% for AGIs $100k-200k, 12.2% for AGIs over 200k)
Charity contributions: $5,322 (reported on 17.7% of returns)
Here:
$5,322
State:
$4,687
(% of AGI for various income ranges: 0.8% for AGIs below $25k, 2.1% for AGIs $25k-50k, 3.3% for AGIs $50k-75k, 3.3% for AGIs $75k-100k, 4.3% for AGIs $100k-200k, 3.1% for AGIs over 200k)
Taxes paid: $7,165 (reported on 20.3% of returns)
27536:
$7,165
State:
$8,823
(% of AGI for various income ranges: 0.8% for AGIs below $25k, 2.2% for AGIs $25k-50k, 4.5% for AGIs $50k-75k, 5.1% for AGIs $75k-100k, 7.2% for AGIs $100k-200k, 6.4% for AGIs over 200k)
Earned income credit: $2,545 (reported on 42.1% of returns)
Here:
$2,545
State:
$2,376
(% of AGI for various income ranges: 11.6% for AGIs below $25k, 1.9% for AGIs $25k-50k)
Percentage of individuals using paid preparers for their 2012 taxes: 43.1%
Here:
43%
State:
53%
(% for various income ranges: 40.9% for AGIs below $25k, 40.0% for AGIs $25k-50k, 48.2% for AGIs $50k-75k, 60.0% for AGIs $75k-100k, 61.5% for AGIs $100k-200k, 77.8% for AGIs over 200k)
Averages for the 2004 tax year for zip code 27536, filed in 2005:
Average Adjusted Gross Income (AGI) in 2004: $33,532 (Individual Income Tax Returns)
Here:
$33,532
State:
$45,376
Salary/wage: $28,117 (reported on 87.8% of returns)
Here:
$28,117
State:
$39,442
(% of AGI for various income ranges: 113.8% for AGIs below $10k, 86.7% for AGIs $10k-25k, 83.1% for AGIs $25k-50k, 76.8% for AGIs $50k-75k, 68.5% for AGIs $75k-100k, 55.5% for AGIs over 100k)
Taxable interest for individuals: $2,041 (reported on 26.4% of returns)
This zip code:
$2,041
North Carolina:
$1,515
(% of AGI for various income ranges: 3.2% for AGIs below $10k, 1.0% for AGIs $10k-25k, 1.3% for AGIs $25k-50k, 1.7% for AGIs $50k-75k, 1.9% for AGIs $75k-100k, 1.9% for AGIs over 100k)
Taxable dividends: $6,366 (reported on 12.9% of returns)
Here:
$6,366
State:
$4,016
(% of AGI for various income ranges: 2.1% for AGIs below $10k, 0.6% for AGIs $10k-25k, 0.9% for AGIs $25k-50k, 1.6% for AGIs $50k-75k, 2.9% for AGIs $75k-100k, 4.9% for AGIs over 100k)
Net capital gain/loss: +$10,772 (reported on 9.7% of returns)
Here:
+$10,772
State:
+$11,152
(% of AGI for various income ranges: -0.7% for AGIs below $10k, 0.3% for AGIs $10k-25k, 0.4% for AGIs $25k-50k, 1.3% for AGIs $50k-75k, 1.9% for AGIs $75k-100k, 8.3% for AGIs over 100k)
Profit/loss from business: +$8,808 (reported on 10.3% of returns)
Here:
+$8,808
State:
+$9,490
(% of AGI for various income ranges: 2.9% for AGIs below $10k, 1.9% for AGIs $10k-25k, 2.3% for AGIs $25k-50k, 2.4% for AGIs $50k-75k, 4.9% for AGIs $75k-100k, 3.0% for AGIs over 100k)
Profit/loss from farming: +$1,880 (reported on 0.3% of returns)
Here:
+$1,880
State:
-$3,231
IRA payment deduction: $3,211 (reported on 1.8% of returns)
27536:
$3,211
North Carolina:
$2,967
(% of AGI for various income ranges: 0.2% for AGIs $10k-25k, 0.2% for AGIs $25k-50k, 0.2% for AGIs $50k-75k, 0.2% for AGIs $75k-100k, 0.1% for AGIs over 100k)
Self-employed pension: $15,378 (reported on 0.4% of returns)
Here:
$15,378
North Carolina:
$14,754
Total itemized deductions: $19,169 (24% of AGI, reported on 22.3% of returns)
Here:
$19,169
State:
$19,464
Here:
23.7% of AGI
State:
22.7% of AGI
(% of AGI for various income ranges: 10.7% for AGIs below $10k, 6.5% for AGIs $10k-25k, 12.7% for AGIs $25k-50k, 16.4% for AGIs $50k-75k, 18.0% for AGIs $75k-100k, 13.8% for AGIs over 100k)
Charity contributions deductions: $4,610 (5% of AGI, reported on 20.3% of returns)
Here:
$4,610
State:
$4,035
Here:
5.5% of AGI
State:
4.5% of AGI
(% of AGI for various income ranges: 0.8% for AGIs below $10k, 1.1% for AGIs $10k-25k, 2.6% for AGIs $25k-50k, 3.8% for AGIs $50k-75k, 3.6% for AGIs $75k-100k, 3.5% for AGIs over 100k)
Total tax: $6,307 (reported on 55.1% of returns)
27536:
$6,307
State:
$7,257
(% of AGI for various income ranges: 1.7% for AGIs below $10k, 2.2% for AGIs $10k-25k, 5.8% for AGIs $25k-50k, 8.8% for AGIs $50k-75k, 10.6% for AGIs $75k-100k, 20.1% for AGIs over 100k)
Earned income credit: $2,062 (reported on 39.0% of returns)
Here:
$2,062
State:
$1,851
Percentage of individuals using paid preparers for their 2004 taxes: 55.5%
Here:
55%
State:
62%
(% for various income ranges: 54.2% for AGIs below $10k, 58.9% for AGIs $10k-25k, 47.1% for AGIs $25k-50k, 56.0% for AGIs $50k-75k, 54.5% for AGIs $75k-100k, 75.2% for AGIs over 100k)
Likely homosexual households (counted as self-reported same-sex unmarried-partner households)
Lesbian couples: 0.6% of all households
Gay men: 0.0% of all households
Household received Food Stamps/SNAP in the past 12 months: 2,288 Household did not receive Food Stamps/SNAP in the past 12 months: 4,036
Women who had a birth in the past 12 months: 246 (68 now married, 170 unmarried) Women who did not have a birth in the past 12 months: 3,827 (807 now married, 3,002 unmarried)
Housing units in zip code 27536 with a mortgage: 978 (71 second mortgage, 53 both second mortgage and home equity loan) Houses without a mortgage: 38
Median monthly owner costs for units with a mortgage: $1,284 Median monthly owner costs for units without a mortgage: $436
Residents with income below the poverty level in 2022:
This zip code:
25.2%
Whole state:
12.8%
Residents with income below 50% of the poverty level in 2022:
This zip code:
10.7%
Whole state:
6.8%
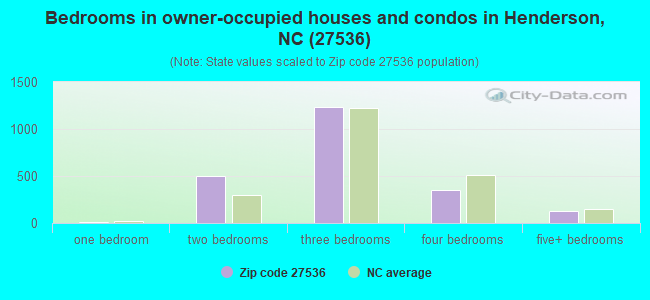
Median number of rooms in houses and condos:
Here:
5.9
State:
6.4
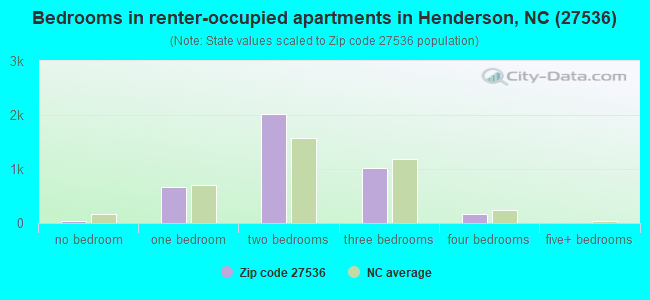
Median number of rooms in apartments:
Here:
4.3
State:
4.4
Notable locations in this zip code not listed on our city pages
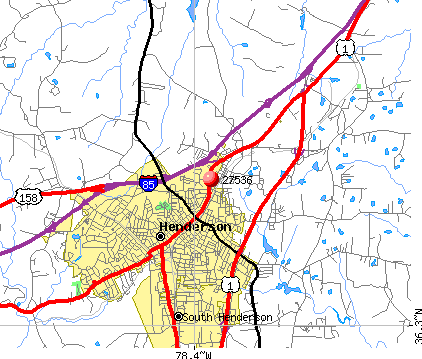
Notable locations in zip code 27536: Vance Square (A), Henderson Country Club (B), Vance County Tourism Office (C), Henderson Institute Historical Building (D), Henry A Dennis County Office Building (E), Croatan Club Building (F), Vance County Historical Museum (G), Vance County Arts Council Building (H), H Leslie Perry Library (I), Garnett Street Station (J), Henderson Fire Station (K), Vance County Court House Building (L), Vance County Health Center (M), Mistletoe Villa (N). Display/hide their locations on the map
Shopping Centers: Outlet City Shopping Center (1), Dabney Drive Shopping Center (2), Corbitt Hill Shopping Center (3). Display/hide their locations on the map
Churches in zip code 27536 include: Harriet Church (A), Welcome Chapel (B), Raleigh Road Church (C), Saint Johns Church (D), Spring Valley Church (E). Display/hide their locations on the map
Cemeteries: Elmwood Cemetery (1), Blacknall Cemetery (2), Alpha Omega Cemetery (3), Sunset Garden Memorial Cemetery (4). Display/hide their locations on the map
Parks in zip code 27536 include: North Henderson Park (1), Jackson Park (2), South Henderson Park (3), Owen Davis Park (4), Pinkston Park (5), Kings Daughters Park (6), Chestnut Street Park (7), Eaton-Johnson Park (8). Display/hide their locations on the map
In group quarters: 407 (-1 institutionalized population)
Size of family households: 1,774 2-persons, 933 3-persons, 697 4-persons, 237 5-persons, 105 6-persons, 45 7-or-more-persons
Size of nonfamily households: 2,135 1-person, 215 2-persons, 32 3-persons
1,174 married couples with children.
2,215 single-parent households (344 men, 1,871 women).
90.0% of residents of 27536 zip code speak English at home.
7.2% of residents speak Spanish at home (61% very well, 21% well, 17% not well, 1% not at all).
0.9% of residents speak other Indo-European language at home (61% very well, 39% well).
0.7% of residents speak Asian or Pacific Island language at home (82% very well, 18% not well).
0.9% of residents speak other language at home (100% very well).
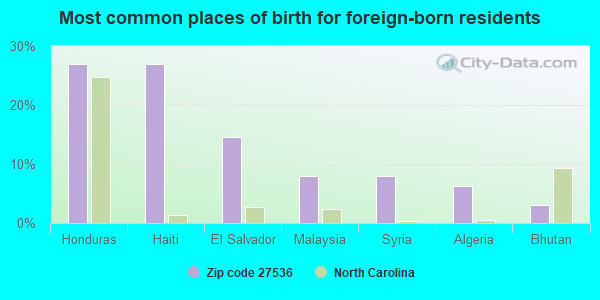
Foreign born population: 978 (6.2%) (33.8% of them are naturalized citizens)
This zip code:
6.2%
Whole state:
8.6%
27%Honduras
27%Haiti
15%El Salvador
8%Malaysia
8%Syria
6%Algeria
3%Bhutan
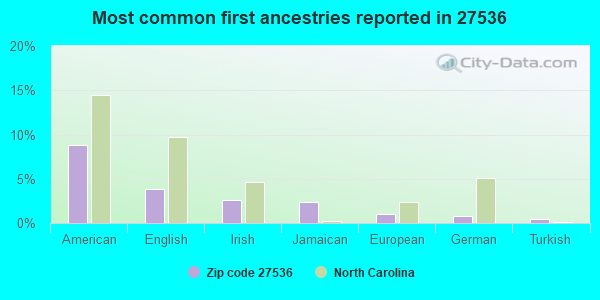
9%American
4%English
3%Irish
2%Jamaican
1%European
1%German
0%Turkish
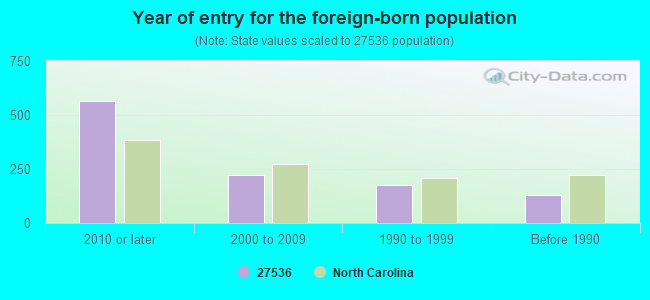
Year of entry for the foreign-born population
5642010 or later
2222000 to 2009
1741990 to 1999
129Before 1990
Major facilities with environmental interests located in this zip code:
AYCOCK ELEMENTARY SCHOOL (305 CAREY CHAPEL ROAD in HENDERSON, NC)
STATE MASTER (North Carolina facility info) - UNDERGROUND STORAGE TANK PROGRAM (National Center for Education Statistics) - STATE ID-304 Business SIC classification: NONCLASSIFIABLE ESTABLISHMENTS Organizations: VANCE COUNTY SCHOOLS (SCHOOL DISTRICT)
CLAYTON HOMES HENDERSON (2090 ROSS MILL RD. in HENDERSON, NC)
AIR MINOR (AIRS/AFS) STATE MASTER (North Carolina facility info) - -115DA4YG00PX9W84AY3V8F3VHX, WASTEWATER FACILITY, -2414, AIR PROGRAM CRITERIA AND HAZARDOUS AIR POLLUTANT INVENTORY (Inventory of air pollution sources) National Pollutant Discharge Elimination System NON-MAJOR (Tracking pollutant discharge elimination systems) - permit TRI REPORTER (Tracking of toxic chemicals releasing facilities) Business SIC classification: MOBILE HOMES Business NAICS classification: ALL OTHER MISCELLANEOUS MANUFACTURING.; ALL OTHER MISCELLANEOUS MANUFACTURING. Alternative names: CLAYTON HOMES, INCORPORATED, CLAYTON HOMES INC-HENDERSON
CAROLINA COMMONWEALTH FOREST PRODUCTS LL (OLD US HIGHWAY 1 SOUTH in HENDERSON, NC)
STATE MASTER (North Carolina facility info) - -115DA4YG00V62W84DX0G019N77, WASTEWATER FACILITY National Pollutant Discharge Elimination System NON-MAJOR (Tracking pollutant discharge elimination systems) - permit Business SIC classification: SAWMILLS AND PLANING MILLS, GENERAL Alternative names: CAR COMMONWEALTH FRST PRODUCTS
CHESAPEAKE FOREST PRODUCTS CO (BYP 158 WITH RT #1303 in HENDERSON, NC)
STATE MASTER (North Carolina facility info) - -115DA4YG00PJ2D64FBEN8E5498, WASTEWATER FACILITY National Pollutant Discharge Elimination System NON-MAJOR (Tracking pollutant discharge elimination systems) - permit Business SIC classification: LOGGING
DIXIE GROCERY (4730 NC HIGHWAY 39 SOUTH in HENDERSON, NC)
STATE MASTER (North Carolina facility info) - -115DA4YG00TP3D64FBEMRE1BH8, WASTEWATER FACILITY, -0-001480, UNDERGROUND STORAGE TANK PROGRAM National Pollutant Discharge Elimination System NON-MAJOR (Tracking pollutant discharge elimination systems) - permit Business SIC classification: GASOLINE SERVICE STATIONS; NONCLASSIFIABLE ESTABLISHMENTS
AYCOCK SCHOOL (RT. 2 in HENDERSON, NC)
AIR MINOR (AIRS/AFS) Business SIC classification: ELEMENTARY AND SECONDARY SCHOOLS
CHEX TRUCK STOP (I-85 & FLEMING RD in HENDERSON, NC)
DUKES REBUILDERS INC (129 E PARKER ST in HENDERSON, NC)
Conditionally Exempt Small Quantity Generators, less than 100 kg/month of hazardous waste (Resource Conservation and Recovery Act (tracking hazardous waste)) - notification Organizations: GARY AYSCUE (CONTACT/OWNER)
, GILL DUKE (CONTACT/OWNER)
, MICHAEL AYSCUE (CONTACT/OWNER)
B & W AUTO REPAIR INC (SR 1309 US 39 N in HENDERSON, NC)
Conditionally Exempt Small Quantity Generators, less than 100 kg/month of hazardous waste (Resource Conservation and Recovery Act (tracking hazardous waste)) - notification Organizations: CHARLES SUNDAY BOWMAN (CONTACT/OWNER)
, DENNIS MARSHALL WILLIAMSON (CONTACT/OWNER)
CAR-VA ROOF MAINTENANCE (HWY 39 N in HENDERSON, NC)
(Resource Conservation and Recovery Act (tracking hazardous waste))
CLAYTON HOMES INC - HENDERSON (2090 ROSS MILL RD in HENDERSON, NC)
National Pollutant Discharge Elimination System NON-MAJOR (Tracking pollutant discharge elimination systems) - permit Business SIC classification: MOBILE HOMES
DENTON'S QUICK LUBE (205 S CHESTNUT ST in HENDERSON, NC)
National Pollutant Discharge Elimination System NON-MAJOR (Tracking pollutant discharge elimination systems) - permit
C & P BODY SHOP (3251 RALEIGH RD in HENDERSON, NC)
Small Quantity Generators, between 100 kg and 1000 kg of hazardous waste/month (Resource Conservation and Recovery Act (tracking hazardous waste)) - notification Organizations: JERRY PATTERSON (CONTACT/OWNER)
Housing units lacking complete plumbing facilities: 5.2% Housing units lacking complete kitchen facilities: 5.7%
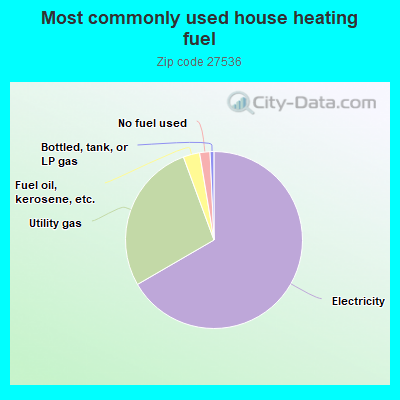
66.5%Electricity
27.7%Utility gas
3.0%Fuel oil, kerosene, etc.
1.9%No fuel used
0.7%Bottled, tank, or LP gas
Population in 1990: 36,983. Population change in the 1990s: +2,859 (+7.7%).
Place of birth for U.S.-born residents:
This state: 10,827
Northeast: 1,486
Midwest: 209
South: 1,529
West: 488
59% of the 27536 zip code residents lived in the same house 5 years ago. Out of people who lived in different houses, 60% lived in this county. Out of people who lived in different counties, 50% lived in North Carolina.
91% of the 27536 zip code residents lived in the same house 1 year ago. Out of people who lived in different houses, 48% moved from this county. Out of people who lived in different houses, 41% moved from different county within same state. Out of people who lived in different houses, 8% moved from different state. Out of people who lived in different houses, 3% moved from abroad.
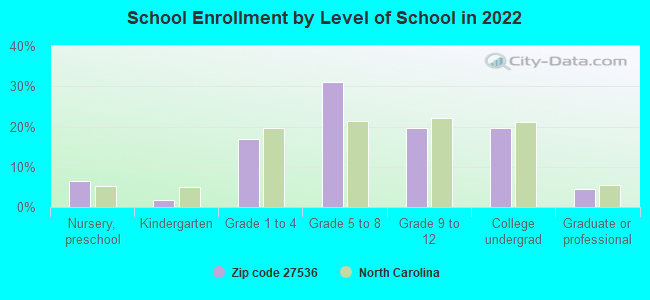
Private vs. public school enrollment:
Students in private schools in grades 1 to 8 (elementary and middle school): 214
Here:
11.6%
North Carolina:
13.8%
Students in private schools in grades 9 to 12 (high school): 41
Here:
5.5%
North Carolina:
11.9%
Students in private undergraduate colleges: 337
Here:
43.7%
North Carolina:
19.3%
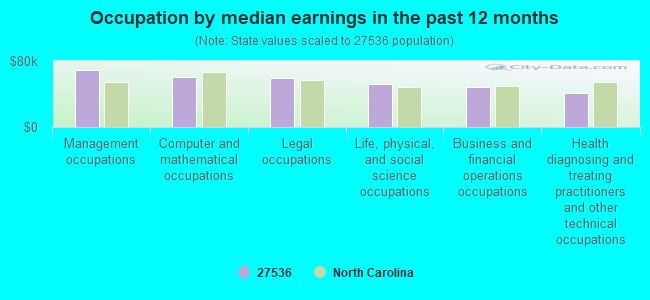
Occupation by median earnings in the past 12 months ($)
69,169Management occupations
60,616Computer and mathematical occupations
59,531Legal occupations
52,165Life, physical, and social science occupations
48,278Business and financial operations occupations
41,277Health diagnosing and treating practitioners and other technical occupations
Companies with federal contracts located in this zip code:
CAROLINA GREENSCAPES & COMPANY (2276 N LYNNBANK RD in HENDERSON, NC; small business) : $74,752 in 6 contractsfrom 2003 to 2004
Contracts for Landscaping/Groundskeeping Services by Army, U.S. Army Corps of Engineers - civil program financing only Signed by year:2000: $0; 2001: $0; 2002: $0; 2003: $37,376; 2004: $37,376; 2005: $0; 2006: $0.
Biggest contracts:
$18,688 with Army for Landscaping/Groundskeeping Services. Signed on 2004-08-23. Completion date: 2003-10-01.
$18,688, same as above.Signed on 2003-11-10. Completion date: 2003-10-01.
$18,688 with U.S. Army Corps of Engineers - civil program financing only for Landscaping/Groundskeeping Services. Signed on 2003-11-10. Completion date: 2003-10-01.
$18,688, same as above.Signed on 2004-08-23. Completion date: 2003-10-01.
LABGUARD CORP (88 PARHAM SPRING LN in HENDERSON, NC; small business) : $19,597 in 4 contractsfrom 2004 to 2006
$12,755 with Army for Laboratory Equipment and Supplies. Taking place in DC. Signed on 2006-03-22. Completion date: 2006-03-09.
$6,381 with National Oceanic and Atmospheric Administration/Under Secretary for Oceans and Atmosphere for Fans, Air Circulators, and Blower Equipment. Signed on 2004-08-30. Completion date: 2004-08-30.
$461 with Army for Laboratory Equipment and Supplies. Taking place in DC. Signed on 2006-05-31. Completion date: 2006-03-09.
$0 with National Oceanic and Atmospheric Administration/Under Secretary for Oceans and Atmosphere for Fans, Air Circulators, and Blower Equipment. Signed on 2004-09-24. Completion date: 2004-12-15.
Top industries in this zip code by the number of employees in 2005:
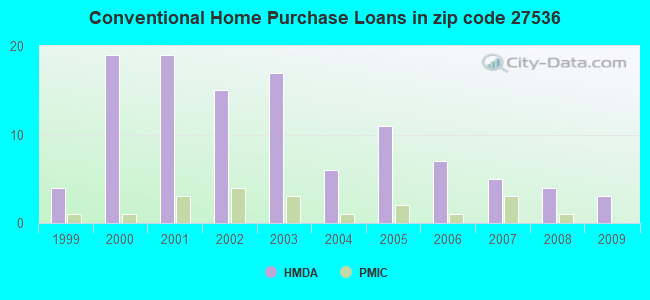
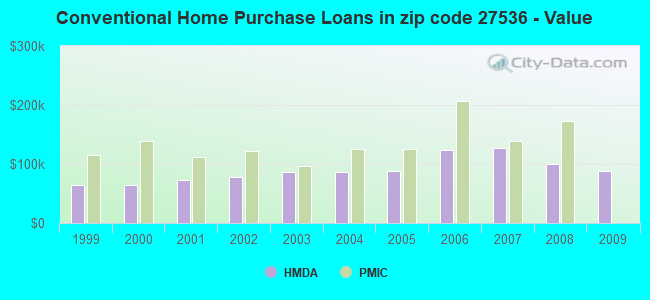
Detailed PMIC statistics for the following Tracts:0601.00
2002 - 2018 National Fire Incident Reporting System (NFIRS) incidents
According to the data from the years 2002 - 2018 the average number of fire incidents per year is 159. The highest number of reported fire incidents - 233 took place in 2013, and the least - 111 in 2006. The data has a rising trend.
When looking into fire subcategories, the most incidents belonged to: Structure Fires (38.6%), and Outside Fires (35.7%).
Fire incident types reported to NFIRS in Zip Code 27536


+$1,880
-$3,231
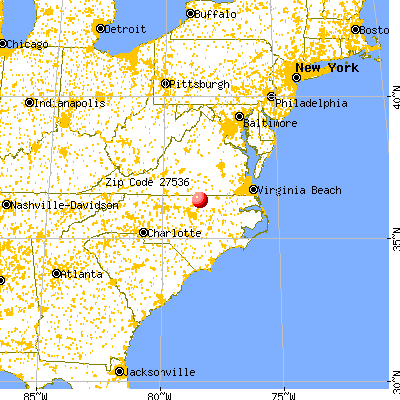
 Nearest zip codes: 27537, 27556, 27544, 27553, 27525, 27563.
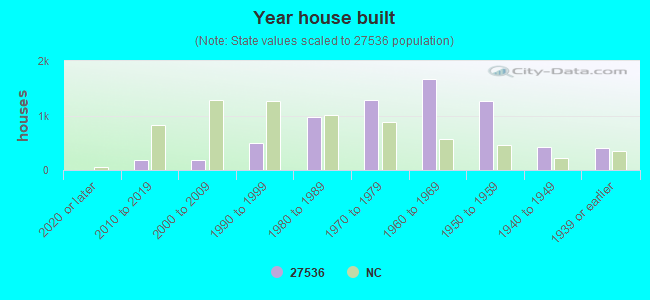


 According to the data from the years 2002 - 2018 the average number of fire incidents per year is 159. The highest number of reported fire incidents - 233 took place in 2013, and the least - 111 in 2006. The data has a rising trend.
 When looking into fire subcategories, the most incidents belonged to: Structure Fires (38.6%), and Outside Fires (35.7%).