Estimated zip code population in 2022: 2,247 Zip code population in 2010: 2,288 Zip code population in 2000: 2,149
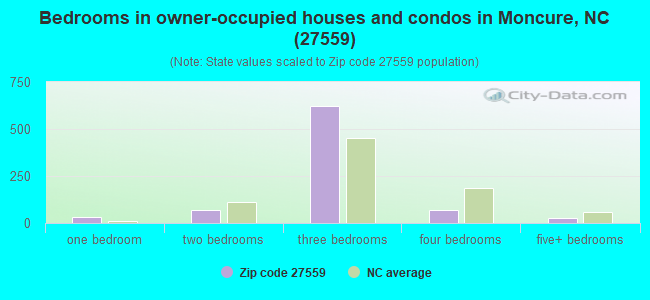
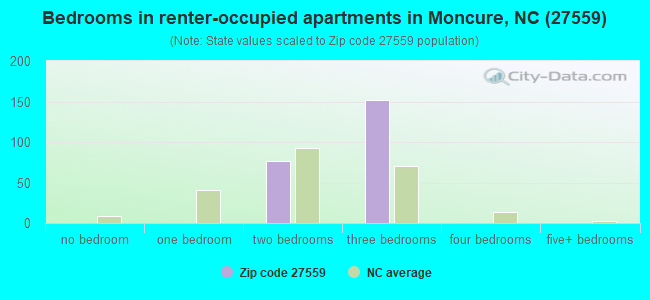
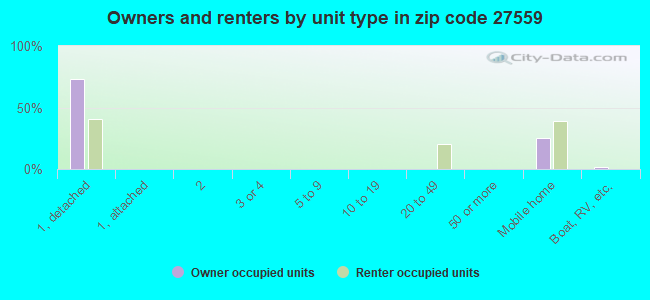
Houses and condos: 1,081 Renter-occupied apartments: 231
% of renters here:
22%
State:
33%
March 2022 cost of living index in zip code 27559: 83.4 (less than average, U.S. average is 100)
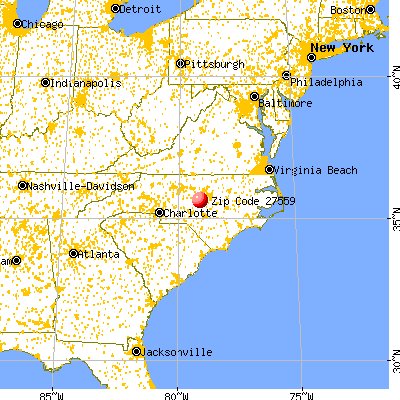
Land area: 48.4 sq. mi. Water area: 1.8 sq. mi.
Population density: 46 people per square mile
(very low).
OSM Map
General Map
Google Map
MSN Map
OSM Map
General Map
Google Map
MSN Map
OSM Map
General Map
Google Map
MSN Map
OSM Map
General Map
Google Map
MSN Map
Please wait while loading the map...
Real estate property taxes paid for housing units in 2022:
This zip code:
0.6% ($1,877)
North Carolina:
0.6% ($1,769)
Median real estate property taxes paid for housing units with mortgages in 2022: $2,267 (0.6%) Median real estate property taxes paid for housing units with no mortgage in 2022: $1,405 (1.6%)
Estimated median house/condo value in 2022: $339,730
27559:
$339,730
North Carolina:
$280,600
According to our research of North Carolina and other state lists, there were 3 registered sex offenders living in 27559 zip code as of April 26, 2024. The ratio of all residents to sex offenders in zip code 27559 is 777 to 1. The ratio of registered sex offenders to all residents in this zip code is lower than the state average.
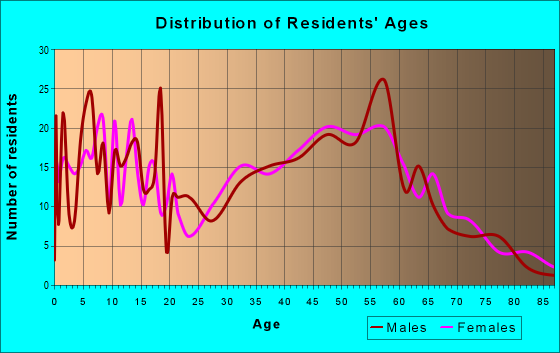
Median resident age:
This zip code:
59.4 years
North Carolina median age:
39.2 years
Average household size:
This zip code:
2.1 people
North Carolina:
2.4 people
Averages for the 2020 tax year for zip code 27559, filed in 2021:
Average Adjusted Gross Income (AGI) in 2020: $70,038 (Individual Income Tax Returns)
Here:
$70,038
State:
$70,020
Salary/wage: $62,421 (reported on 81.1% of returns)
Here:
$62,421
State:
$58,387
(% of AGI for various income ranges: 1135.8% for AGIs below $25k, 3920.8% for AGIs $25k-50k, 6848.2% for AGIs $50k-75k, 11500.0% for AGIs $75k-100k, 17554.2% for AGIs $100k-200k)
Taxable interest for individuals: $485 (reported on 38.5% of returns)
This zip code:
$485
North Carolina:
$1,479
(% of AGI for various income ranges: 15.8% for AGIs below $25k, 11.7% for AGIs $25k-50k, 18.2% for AGIs $50k-75k, 61.7% for AGIs $75k-100k, 60.8% for AGIs $100k-200k)
Ordinary dividends: $4,033 (reported on 19.7% of returns)
Here:
$4,033
State:
$7,888
(% of AGI for various income ranges: 30.4% for AGIs below $25k, 27.1% for AGIs $25k-50k, 66.4% for AGIs $50k-75k, 226.7% for AGIs $75k-100k, 141.7% for AGIs $100k-200k)
Net capital gain/loss in AGI: +$19,409 (reported on 18.0% of returns)
Here:
+$19,409
State:
+$23,652
(% of AGI for various income ranges: 10.0% for AGIs below $25k, 55.8% for AGIs $25k-50k, 100.9% for AGIs $50k-75k, 260.0% for AGIs $75k-100k, 326.7% for AGIs $100k-200k)
Profit/loss from business: +$8,924 (reported on 20.5% of returns)
Here:
+$8,924
State:
+$11,710
(% of AGI for various income ranges: 132.5% for AGIs below $25k, 233.3% for AGIs $25k-50k, 143.6% for AGIs $50k-75k, 101.7% for AGIs $75k-100k, 945.0% for AGIs $100k-200k)
Taxable individual retirement arrangement distribution: $24,300 (reported on 10.7% of returns)
27559:
$24,300
North Carolina:
$20,247
(% of AGI for various income ranges: 62.9% for AGIs below $25k, 212.5% for AGIs $25k-50k, 490.0% for AGIs $75k-100k, 1836.7% for AGIs $100k-200k)
Total itemized deductions: $31,020 (reported on 8.2% of returns)
Here:
$31,020
State:
$34,549
(% of AGI for various income ranges: 912.7% for AGIs $50k-75k, 932.5% for AGIs $100k-200k)
Charity contributions: $10,325 (reported on 6.6% of returns)
Here:
$10,325
State:
$13,360
(% of AGI for various income ranges: 168.2% for AGIs $50k-75k, 220.8% for AGIs $100k-200k)
Taxes paid: $7,310 (reported on 8.2% of returns)
27559:
$7,310
State:
$7,586
(% of AGI for various income ranges: 202.7% for AGIs $50k-75k, 262.5% for AGIs $100k-200k)
Earned income credit: $1,980 (reported on 12.3% of returns)
Here:
$1,980
State:
$2,337
(% of AGI for various income ranges: 74.6% for AGIs below $25k, 49.2% for AGIs $25k-50k)
Percentage of individuals using paid preparers for their 2020 taxes: 91.0%
Here:
91%
State:
93%
(% for various income ranges: 91.4% for AGIs below $25k, 90.6% for AGIs $25k-50k, 88.2% for AGIs $50k-75k, 90.9% for AGIs $75k-100k, 90.5% for AGIs $100k-200k, 100.0% for AGIs over 200k)
Averages for the 2012 tax year for zip code 27559, filed in 2013:
Average Adjusted Gross Income (AGI) in 2012: $59,270 (Individual Income Tax Returns)
Here:
$59,270
State:
$54,937
Salary/wage: $49,811 (reported on 85.0% of returns)
Here:
$49,811
State:
$46,336
(% of AGI for various income ranges: 69.4% for AGIs below $25k, 83.4% for AGIs $25k-50k, 78.5% for AGIs $50k-75k, 75.6% for AGIs $75k-100k, 73.8% for AGIs $100k-200k, 47.2% for AGIs over 200k)
Taxable interest for individuals: $751 (reported on 41.0% of returns)
This zip code:
$751
North Carolina:
$1,298
(% of AGI for various income ranges: 1.1% for AGIs below $25k, 0.4% for AGIs $25k-50k, 0.6% for AGIs $50k-75k, 0.5% for AGIs $75k-100k, 0.7% for AGIs $100k-200k)
Ordinary dividends: $2,480 (reported on 20.0% of returns)
Here:
$2,480
State:
$6,213
(% of AGI for various income ranges: 1.9% for AGIs below $25k, 0.6% for AGIs $25k-50k, 0.5% for AGIs $50k-75k, 0.6% for AGIs $75k-100k, 0.3% for AGIs $100k-200k, 2.0% for AGIs over 200k)
Net capital gain/loss in AGI: +$4,908 (reported on 13.0% of returns)
Here:
+$4,908
State:
+$12,740
(% of AGI for various income ranges: 0.5% for AGIs $25k-50k, 0.4% for AGIs $50k-75k, 3.3% for AGIs $100k-200k)
Profit/loss from business: +$7,626 (reported on 19.0% of returns)
Here:
+$7,626
State:
+$10,311
(% of AGI for various income ranges: 6.8% for AGIs below $25k, 3.5% for AGIs $25k-50k, 4.1% for AGIs $50k-75k, 2.6% for AGIs $100k-200k)
Taxable individual retirement arrangement distribution: $15,967 (reported on 12.0% of returns)
27559:
$15,967
North Carolina:
$15,575
(% of AGI for various income ranges: 4.5% for AGIs below $25k, 2.6% for AGIs $25k-50k, 6.1% for AGIs $50k-75k, 5.4% for AGIs $100k-200k)
Total itemized deductions: $20,931 (21% of AGI, reported on 39.0% of returns)
Here:
$20,931
State:
$23,438
Here:
20.8% of AGI
State:
21.5% of AGI
(% of AGI for various income ranges: 9.9% for AGIs below $25k, 14.1% for AGIs $25k-50k, 16.1% for AGIs $50k-75k, 14.1% for AGIs $75k-100k, 14.4% for AGIs $100k-200k, 11.6% for AGIs over 200k)
Charity contributions: $3,483 (reported on 29.0% of returns)
Here:
$3,483
State:
$4,687
(% of AGI for various income ranges: 1.8% for AGIs $25k-50k, 1.9% for AGIs $50k-75k, 2.3% for AGIs $75k-100k, 1.8% for AGIs $100k-200k, 1.6% for AGIs over 200k)
Taxes paid: $7,690 (reported on 39.0% of returns)
27559:
$7,690
State:
$8,823
(% of AGI for various income ranges: 1.8% for AGIs below $25k, 2.8% for AGIs $25k-50k, 4.4% for AGIs $50k-75k, 5.4% for AGIs $75k-100k, 6.7% for AGIs $100k-200k, 6.3% for AGIs over 200k)
Earned income credit: $2,244 (reported on 16.0% of returns)
Here:
$2,244
State:
$2,376
(% of AGI for various income ranges: 5.5% for AGIs below $25k, 1.2% for AGIs $25k-50k)
Percentage of individuals using paid preparers for their 2012 taxes: 51.0%
Here:
51%
State:
53%
(% for various income ranges: 50.0% for AGIs below $25k, 46.2% for AGIs $25k-50k, 53.3% for AGIs $50k-75k, 60.0% for AGIs $75k-100k, 50.0% for AGIs $100k-200k, 66.7% for AGIs over 200k)
Averages for the 2004 tax year for zip code 27559, filed in 2005:
Average Adjusted Gross Income (AGI) in 2004: $49,282 (Individual Income Tax Returns)
Here:
$49,282
State:
$45,376
Salary/wage: $45,342 (reported on 89.0% of returns)
Here:
$45,342
State:
$39,442
(% of AGI for various income ranges: 101.6% for AGIs below $10k, 76.7% for AGIs $10k-25k, 87.2% for AGIs $25k-50k, 84.4% for AGIs $50k-75k, 86.7% for AGIs $75k-100k, 74.6% for AGIs over 100k)
Taxable interest for individuals: $654 (reported on 45.4% of returns)
This zip code:
$654
North Carolina:
$1,515
(% of AGI for various income ranges: 0.9% for AGIs $10k-25k, 1.1% for AGIs $25k-50k, 0.4% for AGIs $50k-75k, 0.5% for AGIs $75k-100k, 0.3% for AGIs over 100k)
Taxable dividends: $1,733 (reported on 19.2% of returns)
Here:
$1,733
State:
$4,016
(% of AGI for various income ranges: 0.8% for AGIs $10k-25k, 0.9% for AGIs $25k-50k, 0.1% for AGIs $50k-75k, 0.4% for AGIs $75k-100k, 1.0% for AGIs over 100k)
Net capital gain/loss: +$9,023 (reported on 14.6% of returns)
Here:
+$9,023
State:
+$11,152
(% of AGI for various income ranges: 0.1% for AGIs $10k-25k, 0.6% for AGIs $25k-50k, 0.3% for AGIs $50k-75k, -0.1% for AGIs $75k-100k, 8.4% for AGIs over 100k)
Profit/loss from business: +$2,585 (reported on 16.4% of returns)
Here:
+$2,585
State:
+$9,490
(% of AGI for various income ranges: 5.4% for AGIs $10k-25k, 0.2% for AGIs $25k-50k, 1.5% for AGIs $50k-75k, 0.1% for AGIs $75k-100k, -0.0% for AGIs over 100k)
IRA payment deduction: $2,650 (reported on 2.2% of returns)
27559:
$2,650
North Carolina:
$2,967
Total itemized deductions: $16,907 (23% of AGI, reported on 44.2% of returns)
Here:
$16,907
State:
$19,464
Here:
22.6% of AGI
State:
22.7% of AGI
(% of AGI for various income ranges: 11.5% for AGIs $10k-25k, 13.2% for AGIs $25k-50k, 17.6% for AGIs $50k-75k, 17.1% for AGIs $75k-100k, 15.3% for AGIs over 100k)
Charity contributions deductions: $2,770 (4% of AGI, reported on 39.2% of returns)
Here:
$2,770
State:
$4,035
Here:
3.6% of AGI
State:
4.5% of AGI
(% of AGI for various income ranges: 1.7% for AGIs $10k-25k, 2.1% for AGIs $25k-50k, 2.4% for AGIs $50k-75k, 2.4% for AGIs $75k-100k, 2.2% for AGIs over 100k)
Total tax: $6,066 (reported on 79.8% of returns)
27559:
$6,066
State:
$7,257
(% of AGI for various income ranges: 4.0% for AGIs $10k-25k, 6.5% for AGIs $25k-50k, 9.3% for AGIs $50k-75k, 9.8% for AGIs $75k-100k, 14.9% for AGIs over 100k)
Earned income credit: $1,872 (reported on 14.8% of returns)
Here:
$1,872
State:
$1,851
Percentage of individuals using paid preparers for their 2004 taxes: 58.2%
Here:
58%
State:
62%
(% for various income ranges: 56.0% for AGIs below $10k, 61.1% for AGIs $10k-25k, 56.6% for AGIs $25k-50k, 57.6% for AGIs $50k-75k, 56.8% for AGIs $75k-100k, 59.8% for AGIs over 100k)
Churches in zip code 27559 include: Gum Spring Church (A), Buckhorn Methodist Church (B), Mount View Church (C), Mount Zion Church (D), Center Grove Church (E), Chatham Church (F), Providence Church (G), Rose Hill Church (H). Display/hide their locations on the map
Streams, rivers, and creeks: Deep River (A), Stinking Creek (B), Shaddox Creek (C), Rocky Branch (D), Haw River (E), Gulf Creek (F). Display/hide their locations on the map
Size of family households: 573 2-persons, 115 3-persons, 22 4-persons, 24 5-persons, 42 6-persons
Size of nonfamily households: 272 1-person, 7 2-persons
115 married couples with children.
86 single-parent households (79 men, 7 women).
87.0% of residents of 27559 zip code speak English at home.
7.8% of residents speak Spanish at home (71% very well, 10% well, 14% not well, 5% not at all).
0.6% of residents speak other Indo-European language at home (100% very well).
8.4% of residents speak Asian or Pacific Island language at home (100% not at all).
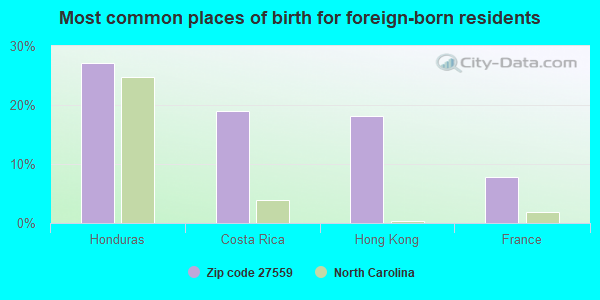
Foreign born population: 264 (11.8%) (18.7% of them are naturalized citizens)
This zip code:
11.8%
Whole state:
8.6%
27%Honduras
19%Costa Rica
18%Hong Kong
8%France
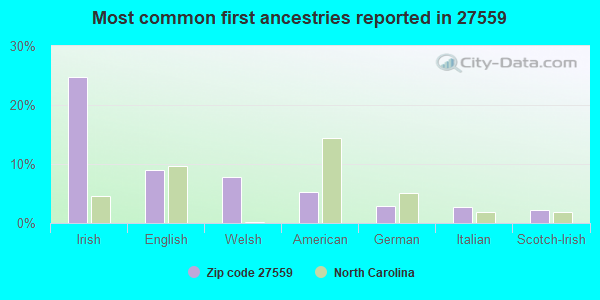
25%Irish
9%English
8%Welsh
5%American
3%German
3%Italian
2%Scotch-Irish
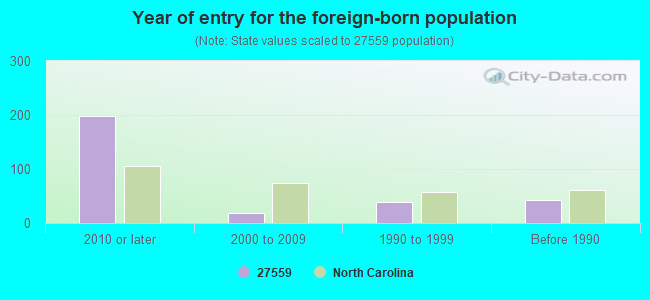
Year of entry for the foreign-born population
1982010 or later
182000 to 2009
391990 to 1999
43Before 1990
Facilities with environmental interests located in this zip code:
CHEROKEE SANFORD GROUP, LIMITED LIABILITY COMPANY (FLATWOODS RD in MONCURE, NC)
STATE MASTER (North Carolina facility info) - -115DA4YG00PJAD84AY3X81U2JG, WASTEWATER FACILITY National Pollutant Discharge Elimination System NON-MAJOR (Tracking pollutant discharge elimination systems) - permit Business SIC classification: CLAY, CERAMIC, AND REFRACTORY MINERALS Alternative names: CHEROKEE SANFORD GROUP LLC, GENERAL SHALE BRICK INC
3M CO PITTSBORO (4191 HIGHWAY 87 SOUTH in MONCURE, NC)
AIR MAJOR (AIRS/AFS) CRITERIA AND HAZARDOUS AIR POLLUTANT INVENTORY (Inventory of air pollution sources) Conditionally Exempt Small Quantity Generators, less than 100 kg/month of hazardous waste (Resource Conservation and Recovery Act (tracking hazardous waste)) TRI REPORTER (Tracking of toxic chemicals releasing facilities) Business SIC classification: MINERALS AND EARTHS, GROUND OR OTHERWISE TREATED Organizations: PETER FLEES (CONTACT/OPERATOR)
Alternative names: 3M Industrial Mineral Products
CHEROKEE SANFORD GROUP INCORPORATED (ROUTE 1 in MONCURE, NC)
TRI REPORTER (Tracking of toxic chemicals releasing facilities) Business SIC classification: BRICK AND STRUCTURAL CLAY TILE
Housing units lacking complete plumbing facilities: 3.3% Housing units lacking complete kitchen facilities: 3.1%
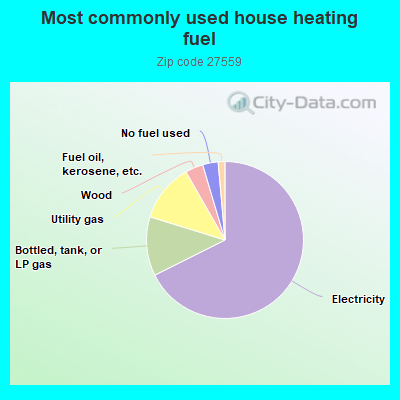
67.9%Electricity
12.2%Bottled, tank, or LP gas
12.0%Utility gas
3.7%Wood
3.2%No fuel used
1.4%Fuel oil, kerosene, etc.
Population in 1990: 2,695.
Place of birth for U.S.-born residents:
This state: 1,083
Northeast: 291
Midwest: 267
South: 259
West: 71
65% of the 27559 zip code residents lived in the same house 5 years ago. Out of people who lived in different houses, 27% lived in this county. Out of people who lived in different counties, 50% lived in North Carolina.
98% of the 27559 zip code residents lived in the same house 1 year ago. Out of people who lived in different houses, 118% moved from different county within same state. Out of people who lived in different houses, 32% moved from different state.
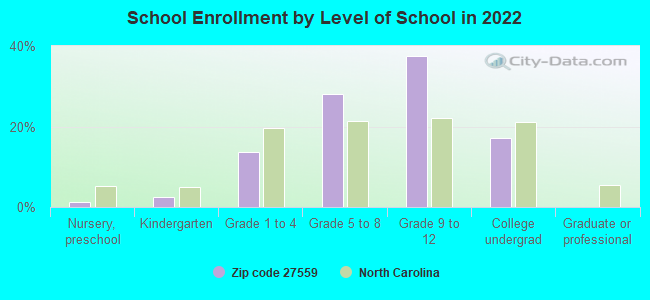
Private vs. public school enrollment:
Students in private schools in grades 1 to 8 (elementary and middle school): 7
Here:
7.6%
North Carolina:
13.8%
Students in private schools in grades 9 to 12 (high school):
Here:
0.0%
North Carolina:
11.9%
Students in private undergraduate colleges:
Here:
0.0%
North Carolina:
19.3%
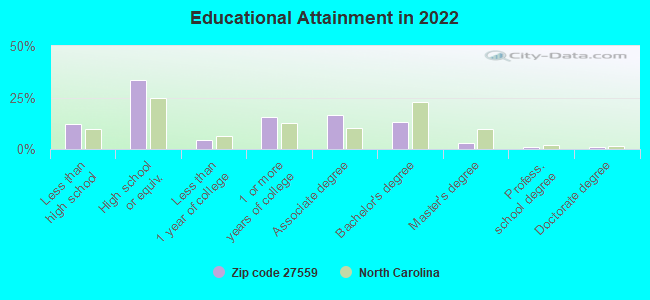
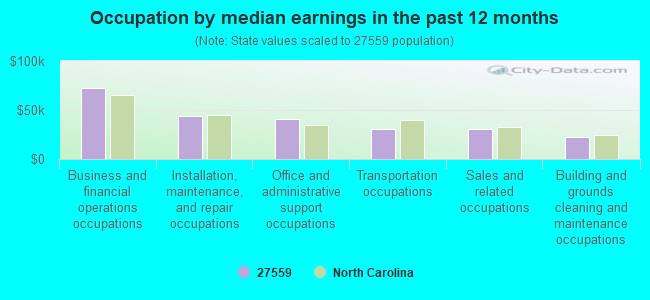
Occupation by median earnings in the past 12 months ($)
72,411Business and financial operations occupations
44,046Installation, maintenance, and repair occupations
41,141Office and administrative support occupations
30,970Transportation occupations
30,360Sales and related occupations
22,672Building and grounds cleaning and maintenance occupations
Companies with federal contracts located in this zip code:
HONEYWELL INTERNATIONAL, INC (388 PEA RIDGE ROAD in MONCURE, VA) : $80,827 in 7 contractsfrom 2003 to 2006
Contracts for Miscellaneous Alarm, Signal and Security Detection Systems, Miscellaneous Communication Equipment, Textile Fabrics by Navy, Army Signed by year:2000: $0; 2001: $0; 2002: $0; 2003: $40,729; 2004: $27,963; 2005: $20,000; 2006: -$7,865.
Biggest contracts:
$24,999 with Navy for Miscellaneous Alarm, Signal and Security Detection Systems. Signed on 2003-10-01. Completion date: 2004-04-13.
$20,000 with Navy for Miscellaneous Communication Equipment. Signed on 2005-03-24. Completion date: 2005-03-24.
$20,000, same as above.Signed on 2004-09-30. Completion date: 2004-10-01.
$7,963 with Navy for Miscellaneous Alarm, Signal and Security Detection Systems. Signed on 2004-04-12. Completion date: 2004-04-13.
Top industries in this zip code by the number of employees in 2005:
Utilities: Electric Power Distribution (100-249 employees: 1 establishment)
Mining: Crushed and Broken Granite Mining and Quarrying (50-99: 1, 20-49: 1, 10-19: 1)
Construction: Industrial Building Construction (20-49: 1)
Other Services (except Public Administration): Commercial and Industrial Machinery and Equipment (except Automotive and Electronic) Repair and Maintenance (20-49: 1)
People in group quarters in 2010:
6 people in emergency and transitional shelters (with sleeping facilities) for people experiencing homelessness
Fatal accident statistics in 2014:
Fatal accident count: 1
Vehicles involved in fatal accidents: 2
Fatal accidents caused by drunken drivers: 0
Fatalities: 1
Persons involved in fatal accidents: 3
Pedestrians involved in fatal accidents: 0
Home Mortgage Disclosure Act Aggregated Statistics For Year 2009 (Based on 6 partial tracts)
A) FHA, FSA/RHS & VA Home Purchase Loans
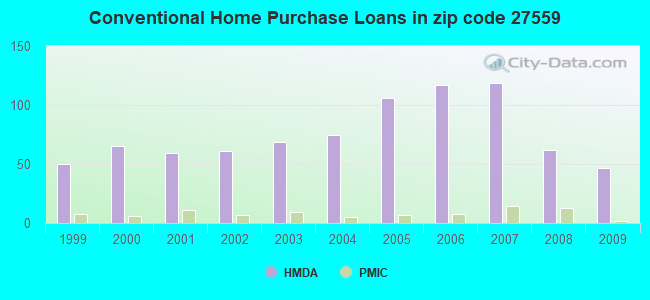
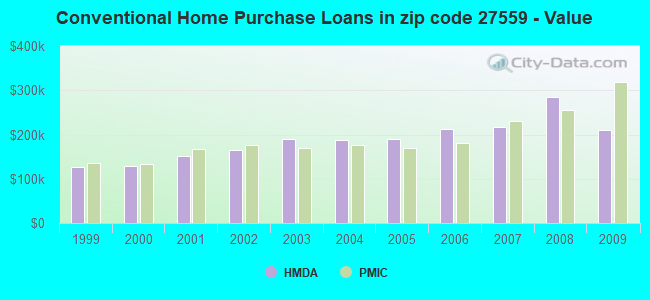
B) Conventional Home Purchase Loans
C) Refinancings
D) Home Improvement Loans
F) Non-occupant Loans on < 5 Family Dwellings (A B C & D)
G) Loans On Manufactured Home Dwelling (A B C & D)
Number
Average Value
Number
Average Value
Number
Average Value
Number
Average Value
Number
Average Value
Number
Average Value
LOANS ORIGINATED
10
$171,566
47
$209,514
164
$225,029
4
$106,322
11
$202,742
8
$78,120
APPLICATIONS APPROVED, NOT ACCEPTED
0
$0
4
$186,252
10
$190,593
2
$90,720
1
$196,840
1
$87,280
APPLICATIONS DENIED
3
$134,690
6
$163,770
42
$190,698
6
$94,732
2
$110,165
10
$90,556
APPLICATIONS WITHDRAWN
1
$196,360
4
$233,178
26
$247,403
2
$86,370
1
$115,760
2
$83,785
FILES CLOSED FOR INCOMPLETENESS
1
$95,730
1
$217,780
10
$189,027
0
$0
1
$59,870
1
$111,330
Aggregated Statistics For Year 2008 (Based on 6 partial tracts)
A) FHA, FSA/RHS & VA Home Purchase Loans
B) Conventional Home Purchase Loans
C) Refinancings
D) Home Improvement Loans
E) Loans on Dwellings For 5+ Families
F) Non-occupant Loans on < 5 Family Dwellings (A B C & D)
G) Loans On Manufactured Home Dwelling (A B C & D)
Number
Average Value
Number
Average Value
Number
Average Value
Number
Average Value
Number
Average Value
Number
Average Value
Number
Average Value
LOANS ORIGINATED
9
$181,050
62
$284,063
98
$208,610
4
$210,628
1
$2,640,350
11
$224,309
6
$95,035
APPLICATIONS APPROVED, NOT ACCEPTED
1
$178,180
6
$199,598
15
$172,245
2
$156,870
0
$0
0
$0
3
$83,123
APPLICATIONS DENIED
3
$136,820
10
$237,065
42
$228,760
12
$108,723
0
$0
3
$277,770
7
$101,343
APPLICATIONS WITHDRAWN
1
$161,060
10
$260,289
21
$192,834
1
$266,410
0
$0
2
$144,505
2
$123,335
FILES CLOSED FOR INCOMPLETENESS
0
$0
3
$240,480
4
$220,890
0
$0
0
$0
1
$147,310
1
$60,050
Aggregated Statistics For Year 2007 (Based on 6 partial tracts)
A) FHA, FSA/RHS & VA Home Purchase Loans
B) Conventional Home Purchase Loans
C) Refinancings
D) Home Improvement Loans
F) Non-occupant Loans on < 5 Family Dwellings (A B C & D)
G) Loans On Manufactured Home Dwelling (A B C & D)
Number
Average Value
Number
Average Value
Number
Average Value
Number
Average Value
Number
Average Value
Number
Average Value
LOANS ORIGINATED
6
$143,905
119
$216,785
87
$210,171
10
$76,156
18
$181,727
12
$89,390
APPLICATIONS APPROVED, NOT ACCEPTED
0
$0
12
$217,386
14
$150,256
4
$40,852
2
$118,810
2
$52,900
APPLICATIONS DENIED
1
$94,920
19
$183,933
49
$187,550
15
$75,667
4
$94,488
8
$73,378
APPLICATIONS WITHDRAWN
1
$89,360
11
$240,309
26
$157,252
3
$55,733
3
$193,763
3
$71,887
FILES CLOSED FOR INCOMPLETENESS
0
$0
2
$273,040
7
$186,251
0
$0
0
$0
1
$59,590
Aggregated Statistics For Year 2006 (Based on 6 partial tracts)
A) FHA, FSA/RHS & VA Home Purchase Loans
B) Conventional Home Purchase Loans
C) Refinancings
D) Home Improvement Loans
F) Non-occupant Loans on < 5 Family Dwellings (A B C & D)
G) Loans On Manufactured Home Dwelling (A B C & D)
Number
Average Value
Number
Average Value
Number
Average Value
Number
Average Value
Number
Average Value
Number
Average Value
LOANS ORIGINATED
3
$119,220
117
$212,957
91
$158,386
8
$87,355
21
$156,300
14
$85,642
APPLICATIONS APPROVED, NOT ACCEPTED
0
$0
10
$142,185
17
$158,611
1
$94,340
2
$118,925
3
$84,643
APPLICATIONS DENIED
1
$170,660
14
$166,279
45
$133,566
16
$46,275
5
$119,034
9
$70,742
APPLICATIONS WITHDRAWN
1
$104,370
12
$182,617
22
$145,809
3
$117,093
3
$119,580
1
$128,520
FILES CLOSED FOR INCOMPLETENESS
0
$0
3
$267,500
9
$134,110
0
$0
1
$180,180
0
$0
Aggregated Statistics For Year 2005 (Based on 6 partial tracts)
A) FHA, FSA/RHS & VA Home Purchase Loans
B) Conventional Home Purchase Loans
C) Refinancings
D) Home Improvement Loans
F) Non-occupant Loans on < 5 Family Dwellings (A B C & D)
G) Loans On Manufactured Home Dwelling (A B C & D)
Number
Average Value
Number
Average Value
Number
Average Value
Number
Average Value
Number
Average Value
Number
Average Value
LOANS ORIGINATED
4
$139,358
106
$189,040
106
$170,922
13
$86,620
16
$121,964
15
$81,341
APPLICATIONS APPROVED, NOT ACCEPTED
1
$131,520
10
$139,703
14
$147,489
4
$39,990
1
$31,450
4
$94,548
APPLICATIONS DENIED
1
$138,230
16
$112,224
57
$132,424
8
$50,781
3
$98,537
17
$79,926
APPLICATIONS WITHDRAWN
1
$74,270
11
$181,950
32
$160,251
4
$177,142
3
$180,680
4
$95,158
FILES CLOSED FOR INCOMPLETENESS
0
$0
3
$172,467
15
$191,851
1
$49,890
1
$104,780
1
$140,280
Aggregated Statistics For Year 2004 (Based on 6 partial tracts)
A) FHA, FSA/RHS & VA Home Purchase Loans
B) Conventional Home Purchase Loans
C) Refinancings
D) Home Improvement Loans
F) Non-occupant Loans on < 5 Family Dwellings (A B C & D)
G) Loans On Manufactured Home Dwelling (A B C & D)
Number
Average Value
Number
Average Value
Number
Average Value
Number
Average Value
Number
Average Value
Number
Average Value
LOANS ORIGINATED
6
$144,145
75
$188,628
102
$161,249
7
$47,763
13
$120,587
10
$70,835
APPLICATIONS APPROVED, NOT ACCEPTED
0
$0
10
$143,339
16
$144,412
1
$54,780
1
$108,820
7
$58,454
APPLICATIONS DENIED
0
$0
19
$122,174
50
$135,380
10
$38,706
2
$146,255
14
$73,371
APPLICATIONS WITHDRAWN
1
$141,420
9
$163,757
36
$120,134
3
$91,717
3
$71,690
5
$98,000
FILES CLOSED FOR INCOMPLETENESS
0
$0
3
$166,547
7
$144,310
1
$66,490
0
$0
0
$0
Aggregated Statistics For Year 2003 (Based on 6 partial tracts)
A) FHA, FSA/RHS & VA Home Purchase Loans
B) Conventional Home Purchase Loans
C) Refinancings
D) Home Improvement Loans
F) Non-occupant Loans on < 5 Family Dwellings (A B C & D)
Number
Average Value
Number
Average Value
Number
Average Value
Number
Average Value
Number
Average Value
LOANS ORIGINATED
5
$127,326
69
$190,839
245
$157,179
5
$56,852
15
$147,688
APPLICATIONS APPROVED, NOT ACCEPTED
0
$0
11
$124,847
24
$142,630
1
$50,450
1
$139,530
APPLICATIONS DENIED
3
$94,237
32
$66,721
64
$141,002
4
$35,495
2
$98,985
APPLICATIONS WITHDRAWN
1
$97,850
9
$184,467
31
$141,534
1
$32,490
0
$0
FILES CLOSED FOR INCOMPLETENESS
0
$0
1
$101,460
10
$144,819
0
$0
0
$0
Aggregated Statistics For Year 2002 (Based on 6 partial tracts)
A) FHA, FSA/RHS & VA Home Purchase Loans
B) Conventional Home Purchase Loans
C) Refinancings
D) Home Improvement Loans
F) Non-occupant Loans on < 5 Family Dwellings (A B C & D)
Number
Average Value
Number
Average Value
Number
Average Value
Number
Average Value
Number
Average Value
LOANS ORIGINATED
11
$138,353
61
$163,960
125
$158,518
9
$31,002
6
$119,487
APPLICATIONS APPROVED, NOT ACCEPTED
3
$119,180
16
$72,859
13
$112,523
2
$19,160
1
$99,090
APPLICATIONS DENIED
1
$100,870
28
$53,058
41
$103,108
7
$20,481
1
$114,300
APPLICATIONS WITHDRAWN
1
$93,140
8
$135,635
26
$126,738
3
$19,213
0
$0
FILES CLOSED FOR INCOMPLETENESS
0
$0
2
$111,290
7
$143,086
0
$0
0
$0
Aggregated Statistics For Year 2001 (Based on 6 partial tracts)
A) FHA, FSA/RHS & VA Home Purchase Loans
B) Conventional Home Purchase Loans
C) Refinancings
D) Home Improvement Loans
F) Non-occupant Loans on < 5 Family Dwellings (A B C & D)
Number
Average Value
Number
Average Value
Number
Average Value
Number
Average Value
Number
Average Value
LOANS ORIGINATED
5
$146,464
59
$151,272
107
$123,897
8
$34,342
8
$103,049
APPLICATIONS APPROVED, NOT ACCEPTED
0
$0
9
$67,951
13
$108,104
2
$23,785
0
$0
APPLICATIONS DENIED
0
$0
24
$60,055
37
$98,016
6
$15,067
2
$58,505
APPLICATIONS WITHDRAWN
1
$125,690
5
$110,298
19
$97,103
3
$52,847
1
$35,400
FILES CLOSED FOR INCOMPLETENESS
0
$0
3
$143,583
6
$147,713
1
$16,960
0
$0
Aggregated Statistics For Year 2000 (Based on 6 partial tracts)
A) FHA, FSA/RHS & VA Home Purchase Loans
B) Conventional Home Purchase Loans
C) Refinancings
D) Home Improvement Loans
F) Non-occupant Loans on < 5 Family Dwellings (A B C & D)
Number
Average Value
Number
Average Value
Number
Average Value
Number
Average Value
Number
Average Value
LOANS ORIGINATED
4
$115,825
65
$128,121
42
$99,370
9
$38,403
6
$78,472
APPLICATIONS APPROVED, NOT ACCEPTED
4
$37,405
13
$75,167
14
$95,138
1
$25,950
1
$139,260
APPLICATIONS DENIED
5
$71,266
28
$60,609
37
$81,229
5
$16,178
2
$80,475
APPLICATIONS WITHDRAWN
1
$100,990
4
$89,058
16
$87,026
1
$26,540
0
$0
FILES CLOSED FOR INCOMPLETENESS
1
$98,090
3
$146,587
3
$65,070
0
$0
0
$0
Aggregated Statistics For Year 1999 (Based on 3 partial tracts)
A) FHA, FSA/RHS & VA Home Purchase Loans
B) Conventional Home Purchase Loans
C) Refinancings
D) Home Improvement Loans
F) Non-occupant Loans on < 5 Family Dwellings (A B C & D)
2003 - 2018 National Fire Incident Reporting System (NFIRS) incidents
According to the data from the years 2003 - 2018 the average number of fires per year is 26. The highest number of fires - 55 took place in 2010, and the least - 5 in 2004. The data has an increasing trend.
When looking into fire subcategories, the most incidents belonged to: Outside Fires (42.4%), and Structure Fires (37.1%).
Fire incident types reported to NFIRS in Zip Code 27559


 Nearest zip codes: 27562, 27330, 27312, 27502, 27523, 27540.


 According to the data from the years 2003 - 2018 the average number of fires per year is 26. The highest number of fires - 55 took place in 2010, and the least - 5 in 2004. The data has an increasing trend.
 When looking into fire subcategories, the most incidents belonged to: Outside Fires (42.4%), and Structure Fires (37.1%).