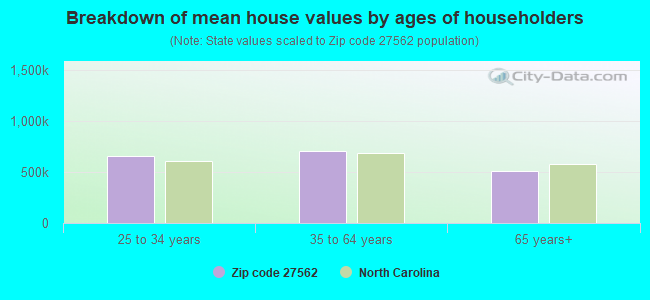
Estimated median house/condo value in 2022: $660,826
27562:
$660,826
North Carolina:
$280,600
According to our research of North Carolina and other state lists, there were 2 registered sex offenders living in 27562 zip code as of April 27, 2024. The ratio of all residents to sex offenders in zip code 27562 is 916 to 1. The ratio of registered sex offenders to all residents in this zip code is lower than the state average.
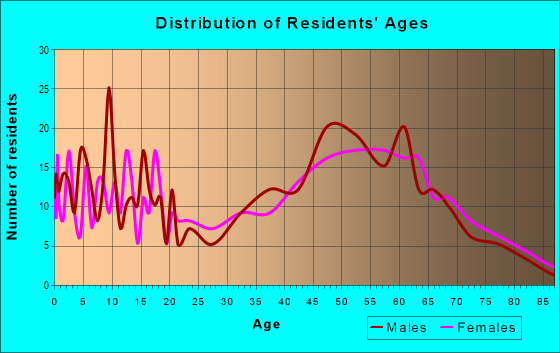
Median resident age:
This zip code:
36.7 years
North Carolina median age:
39.2 years
Average household size:
This zip code:
3.0 people
North Carolina:
2.4 people
Averages for the 2020 tax year for zip code 27562, filed in 2021:
Average Adjusted Gross Income (AGI) in 2020: $122,210 (Individual Income Tax Returns)
Here:
$122,210
State:
$70,020
Salary/wage: $109,347 (reported on 86.4% of returns)
Here:
$109,347
State:
$58,387
(% of AGI for various income ranges: 1181.9% for AGIs below $25k, 3674.4% for AGIs $25k-50k, 7206.7% for AGIs $50k-75k, 10361.7% for AGIs $75k-100k, 20462.1% for AGIs $100k-200k, 69360.0% for AGIs over 200k)
Taxable interest for individuals: $828 (reported on 46.5% of returns)
This zip code:
$828
North Carolina:
$1,479
(% of AGI for various income ranges: 18.1% for AGIs below $25k, 40.6% for AGIs $25k-50k, 35.3% for AGIs $50k-75k, 55.8% for AGIs $75k-100k, 67.4% for AGIs $100k-200k, 241.8% for AGIs over 200k)
Ordinary dividends: $4,146 (reported on 32.8% of returns)
Here:
$4,146
State:
$7,888
(% of AGI for various income ranges: 52.3% for AGIs below $25k, 91.1% for AGIs $25k-50k, 181.3% for AGIs $50k-75k, 181.7% for AGIs $75k-100k, 260.0% for AGIs $100k-200k, 833.6% for AGIs over 200k)
Net capital gain/loss in AGI: +$19,167 (reported on 30.3% of returns)
Here:
+$19,167
State:
+$23,652
(% of AGI for various income ranges: 31.5% for AGIs below $25k, 50.0% for AGIs $25k-50k, 144.7% for AGIs $50k-75k, 258.3% for AGIs $75k-100k, 387.1% for AGIs $100k-200k, 8481.8% for AGIs over 200k)
Profit/loss from business: +$15,632 (reported on 20.2% of returns)
Here:
+$15,632
State:
+$11,710
(% of AGI for various income ranges: 102.7% for AGIs below $25k, 195.0% for AGIs $25k-50k, 182.0% for AGIs $50k-75k, 473.3% for AGIs $75k-100k, 492.9% for AGIs $100k-200k, 2655.5% for AGIs over 200k)
Taxable individual retirement arrangement distribution: $26,871 (reported on 10.6% of returns)
27562:
$26,871
North Carolina:
$20,247
(% of AGI for various income ranges: 65.8% for AGIs below $25k, 199.4% for AGIs $25k-50k, 311.3% for AGIs $50k-75k, 356.7% for AGIs $75k-100k, 513.4% for AGIs $100k-200k, 2060.9% for AGIs over 200k)
Total itemized deductions: $33,351 (reported on 20.7% of returns)
Here:
$33,351
State:
$34,549
(% of AGI for various income ranges: 255.0% for AGIs below $25k, 754.0% for AGIs $50k-75k, 996.7% for AGIs $75k-100k, 1280.8% for AGIs $100k-200k, 5288.2% for AGIs over 200k)
Charity contributions: $8,509 (reported on 16.7% of returns)
Here:
$8,509
State:
$13,360
(% of AGI for various income ranges: 118.7% for AGIs $50k-75k, 132.5% for AGIs $75k-100k, 197.4% for AGIs $100k-200k, 1564.5% for AGIs over 200k)
Taxes paid: $9,051 (reported on 20.7% of returns)
27562:
$9,051
State:
$7,586
(% of AGI for various income ranges: 59.2% for AGIs below $25k, 173.3% for AGIs $50k-75k, 262.5% for AGIs $75k-100k, 407.4% for AGIs $100k-200k, 1303.6% for AGIs over 200k)
Earned income credit: $1,745 (reported on 5.6% of returns)
Here:
$1,745
State:
$2,337
(% of AGI for various income ranges: 39.2% for AGIs below $25k, 50.0% for AGIs $25k-50k)
Percentage of individuals using paid preparers for their 2020 taxes: 93.9%
Here:
94%
State:
93%
(% for various income ranges: 89.7% for AGIs below $25k, 92.0% for AGIs $25k-50k, 95.5% for AGIs $50k-75k, 94.4% for AGIs $75k-100k, 96.9% for AGIs $100k-200k, 93.3% for AGIs over 200k)
Averages for the 2012 tax year for zip code 27562, filed in 2013:
Average Adjusted Gross Income (AGI) in 2012: $65,487 (Individual Income Tax Returns)
Here:
$65,487
State:
$54,937
Salary/wage: $57,327 (reported on 80.5% of returns)
Here:
$57,327
State:
$46,336
(% of AGI for various income ranges: 73.1% for AGIs below $25k, 76.4% for AGIs $25k-50k, 67.2% for AGIs $50k-75k, 73.8% for AGIs $75k-100k, 76.3% for AGIs $100k-200k, 61.0% for AGIs over 200k)
Taxable interest for individuals: $958 (reported on 48.8% of returns)
This zip code:
$958
North Carolina:
$1,298
(% of AGI for various income ranges: 2.0% for AGIs below $25k, 0.5% for AGIs $25k-50k, 1.5% for AGIs $50k-75k, 1.0% for AGIs $75k-100k, 0.4% for AGIs $100k-200k, 0.4% for AGIs over 200k)
Ordinary dividends: $3,610 (reported on 25.6% of returns)
Here:
$3,610
State:
$6,213
(% of AGI for various income ranges: 1.5% for AGIs below $25k, 1.8% for AGIs $25k-50k, 1.6% for AGIs $50k-75k, 0.8% for AGIs $75k-100k, 1.0% for AGIs $100k-200k, 1.8% for AGIs over 200k)
Net capital gain/loss in AGI: +$13,179 (reported on 23.2% of returns)
Here:
+$13,179
State:
+$12,740
(% of AGI for various income ranges: 0.8% for AGIs below $25k, 0.6% for AGIs $25k-50k, 0.9% for AGIs $50k-75k, 3.7% for AGIs $75k-100k, 4.3% for AGIs $100k-200k, 9.9% for AGIs over 200k)
Profit/loss from business: +$12,613 (reported on 18.3% of returns)
Here:
+$12,613
State:
+$10,311
(% of AGI for various income ranges: 8.2% for AGIs below $25k, 4.1% for AGIs $25k-50k, 0.9% for AGIs $50k-75k, 2.1% for AGIs $75k-100k, 7.4% for AGIs $100k-200k)
Taxable individual retirement arrangement distribution: $11,190 (reported on 12.2% of returns)
27562:
$11,190
North Carolina:
$15,575
(% of AGI for various income ranges: 4.3% for AGIs below $25k, 2.4% for AGIs $25k-50k, 5.8% for AGIs $50k-75k, 2.9% for AGIs $100k-200k)
Total itemized deductions: $23,547 (20% of AGI, reported on 41.5% of returns)
Here:
$23,547
State:
$23,438
Here:
20.2% of AGI
State:
21.5% of AGI
(% of AGI for various income ranges: 11.6% for AGIs below $25k, 10.8% for AGIs $25k-50k, 15.4% for AGIs $50k-75k, 16.5% for AGIs $75k-100k, 17.5% for AGIs $100k-200k, 14.0% for AGIs over 200k)
Charity contributions: $3,750 (reported on 34.1% of returns)
Here:
$3,750
State:
$4,687
(% of AGI for various income ranges: 1.6% for AGIs $25k-50k, 2.5% for AGIs $50k-75k, 2.4% for AGIs $75k-100k, 2.7% for AGIs $100k-200k, 1.4% for AGIs over 200k)
Taxes paid: $9,574 (reported on 41.5% of returns)
27562:
$9,574
State:
$8,823
(% of AGI for various income ranges: 2.8% for AGIs below $25k, 3.3% for AGIs $25k-50k, 4.3% for AGIs $50k-75k, 6.1% for AGIs $75k-100k, 7.6% for AGIs $100k-200k, 7.3% for AGIs over 200k)
Earned income credit: $2,000 (reported on 14.6% of returns)
Here:
$2,000
State:
$2,376
(% of AGI for various income ranges: 5.2% for AGIs below $25k, 0.9% for AGIs $25k-50k)
Percentage of individuals using paid preparers for their 2012 taxes: 47.6%
Here:
48%
State:
53%
(% for various income ranges: 41.4% for AGIs below $25k, 47.4% for AGIs $25k-50k, 54.5% for AGIs $50k-75k, 50.0% for AGIs $75k-100k, 45.5% for AGIs $100k-200k, 75.0% for AGIs over 200k)
Averages for the 2004 tax year for zip code 27562, filed in 2005:
Average Adjusted Gross Income (AGI) in 2004: $52,802 (Individual Income Tax Returns)
Here:
$52,802
State:
$45,376
Salary/wage: $50,776 (reported on 84.1% of returns)
Here:
$50,776
State:
$39,442
(% of AGI for various income ranges: 127.6% for AGIs below $10k, 75.0% for AGIs $10k-25k, 76.3% for AGIs $25k-50k, 84.1% for AGIs $50k-75k, 82.4% for AGIs $75k-100k, 80.6% for AGIs over 100k)
Taxable interest for individuals: $985 (reported on 53.8% of returns)
This zip code:
$985
North Carolina:
$1,515
(% of AGI for various income ranges: 10.5% for AGIs below $10k, 2.2% for AGIs $10k-25k, 1.9% for AGIs $25k-50k, 1.0% for AGIs $50k-75k, 0.2% for AGIs $75k-100k, 0.6% for AGIs over 100k)
Taxable dividends: $1,587 (reported on 27.5% of returns)
Here:
$1,587
State:
$4,016
(% of AGI for various income ranges: 1.5% for AGIs below $10k, 1.0% for AGIs $10k-25k, 0.5% for AGIs $25k-50k, 1.0% for AGIs $50k-75k, 0.4% for AGIs $75k-100k, 1.0% for AGIs over 100k)
Net capital gain/loss: +$6,000 (reported on 18.8% of returns)
Here:
+$6,000
State:
+$11,152
(% of AGI for various income ranges: -1.2% for AGIs $10k-25k, 1.6% for AGIs $25k-50k, -0.3% for AGIs $50k-75k, 0.0% for AGIs $75k-100k, 4.7% for AGIs over 100k)
Profit/loss from business: +$4,951 (reported on 19.0% of returns)
Here:
+$4,951
State:
+$9,490
(% of AGI for various income ranges: 13.3% for AGIs below $10k, 4.7% for AGIs $10k-25k, 4.5% for AGIs $25k-50k, -0.2% for AGIs $50k-75k, 0.8% for AGIs $75k-100k, 1.2% for AGIs over 100k)
IRA payment deduction: $2,696 (reported on 3.1% of returns)
27562:
$2,696
North Carolina:
$2,967
Total itemized deductions: $18,531 (22% of AGI, reported on 47.0% of returns)
Here:
$18,531
State:
$19,464
Here:
21.9% of AGI
State:
22.7% of AGI
(% of AGI for various income ranges: 16.9% for AGIs $10k-25k, 15.5% for AGIs $25k-50k, 18.3% for AGIs $50k-75k, 17.6% for AGIs $75k-100k, 16.0% for AGIs over 100k)
Charity contributions deductions: $2,819 (3% of AGI, reported on 40.6% of returns)
Here:
$2,819
State:
$4,035
Here:
3.3% of AGI
State:
4.5% of AGI
(% of AGI for various income ranges: 2.9% for AGIs $10k-25k, 2.1% for AGIs $25k-50k, 2.3% for AGIs $50k-75k, 2.4% for AGIs $75k-100k, 2.0% for AGIs over 100k)
Total tax: $7,825 (reported on 77.7% of returns)
27562:
$7,825
State:
$7,257
(% of AGI for various income ranges: 3.3% for AGIs below $10k, 3.7% for AGIs $10k-25k, 7.1% for AGIs $25k-50k, 8.7% for AGIs $50k-75k, 10.3% for AGIs $75k-100k, 16.3% for AGIs over 100k)
Earned income credit: $1,580 (reported on 11.7% of returns)
Here:
$1,580
State:
$1,851
Percentage of individuals using paid preparers for their 2004 taxes: 54.1%
Here:
54%
State:
62%
(% for various income ranges: 44.6% for AGIs below $10k, 60.8% for AGIs $10k-25k, 52.7% for AGIs $25k-50k, 61.8% for AGIs $50k-75k, 50.7% for AGIs $75k-100k, 50.9% for AGIs over 100k)
Household received Food Stamps/SNAP in the past 12 months: 48 Household did not receive Food Stamps/SNAP in the past 12 months: 1,431
Women who had a birth in the past 12 months: 37 (38 now married, 0 unmarried) Women who did not have a birth in the past 12 months: 1,164 (446 now married, 716 unmarried)
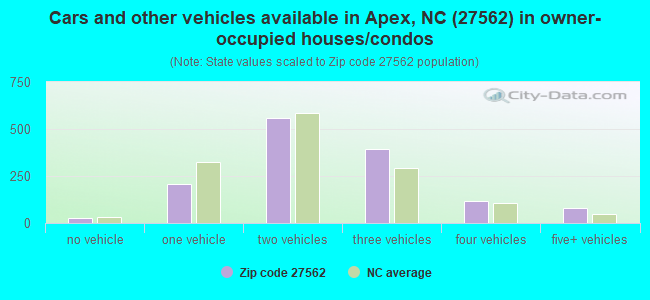
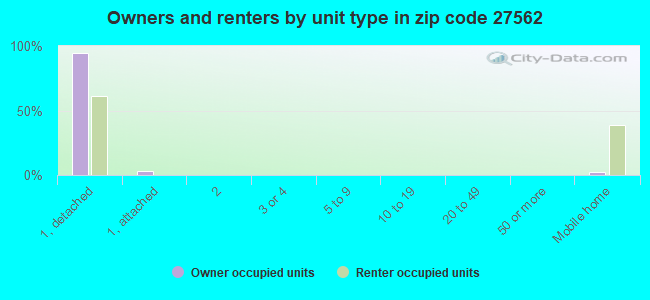
Housing units in zip code 27562 with a mortgage: 1,042 (30 second mortgage, 32 both second mortgage and home equity loan) Houses without a mortgage: 36
Median monthly owner costs for units with a mortgage: $2,470 Median monthly owner costs for units without a mortgage: $673
Residents with income below the poverty level in 2022:
This zip code:
3.3%
Whole state:
12.8%
Residents with income below 50% of the poverty level in 2022:
This zip code:
1.7%
Whole state:
6.8%
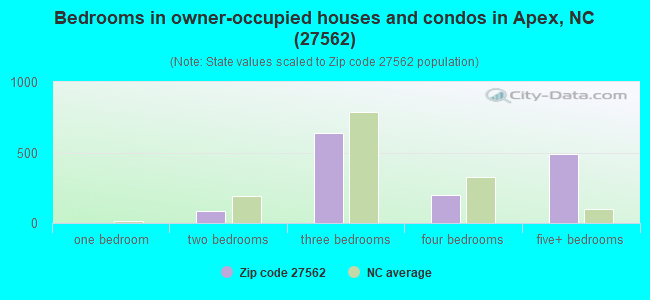
Median number of rooms in houses and condos:
Here:
8.3
State:
6.4
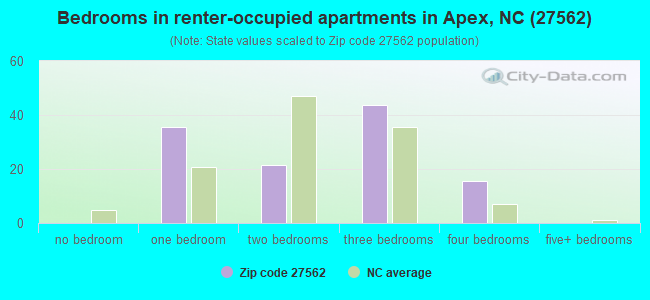
Median number of rooms in apartments:
Here:
4.5
State:
4.4
Notable locations in this zip code not listed on our city pages
Churches in zip code 27562 include: Christian Chapel (A), New Elam Church (B), Cedar Rock Church (C), Prince Chapel (D). Display/hide their locations on the map
Streams, rivers, and creeks: Big Branch (A), White Oak Creek (B), Weaver Creek (C), Tom Jack Creek (D), New Hope River (E). Display/hide their locations on the map
Size of family households: 355 2-persons, 181 3-persons, 216 4-persons, 336 5-persons, 14 7-or-more-persons
Size of nonfamily households: 308 1-person, 75 2-persons
1,117 married couples with children.
157 single-parent households (157 women).
93.7% of residents of 27562 zip code speak English at home.
2.9% of residents speak Spanish at home (100% very well).
0.7% of residents speak other Indo-European language at home (100% very well).
2.3% of residents speak Asian or Pacific Island language at home (48% well, 52% not at all).
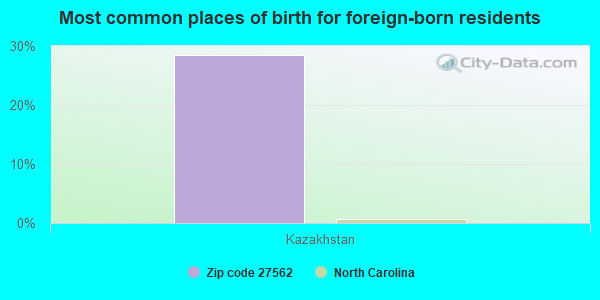
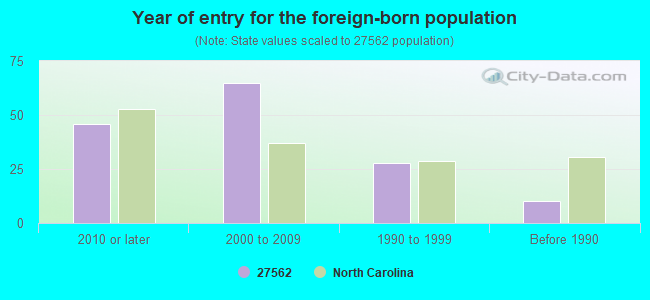
Foreign born population: 110 (2.5%) (48.0% of them are naturalized citizens)
This zip code:
2.5%
Whole state:
8.6%
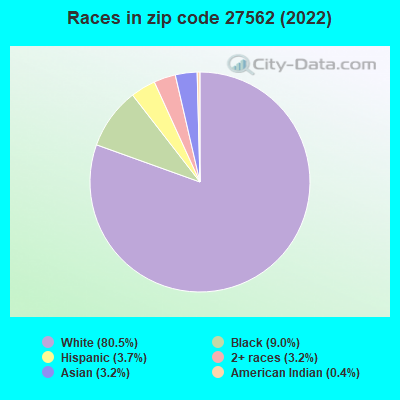
28%Kazakhstan
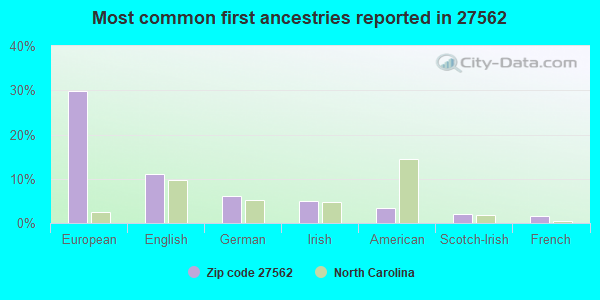
30%European
11%English
6%German
5%Irish
3%American
2%Scotch-Irish
2%French
Year of entry for the foreign-born population
462010 or later
652000 to 2009
281990 to 1999
10Before 1990
Facilities with environmental interests located in this zip code:
B&B CHIP MILL INC (7634 OLD U.S. HWY 1 in NEW HILL, NC)
STATE MASTER (North Carolina facility info) - -115DA4YG00M29W84AY3W0DKS8G, WASTEWATER FACILITY National Pollutant Discharge Elimination System NON-MAJOR (Tracking pollutant discharge elimination systems) - permit National Pollutant Discharge Elimination System NON-MAJOR (Tracking pollutant discharge elimination systems) - permit Business SIC classification: SAWMILLS AND PLANING MILLS, GENERAL Alternative names: WEYERHAEUSER CO B & B CHIP ML
Housing units lacking complete plumbing facilities: 6.2% Housing units lacking complete kitchen facilities: 4.9%
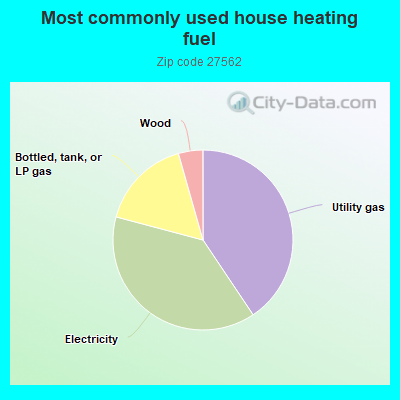
40.7%Utility gas
38.6%Electricity
16.5%Bottled, tank, or LP gas
4.4%Wood
Population in 1990: 991. Population change in the 1990s: +736 (+74.3%).
Place of birth for U.S.-born residents:
This state: 1,575
Northeast: 1,208
Midwest: 447
South: 580
West: 513
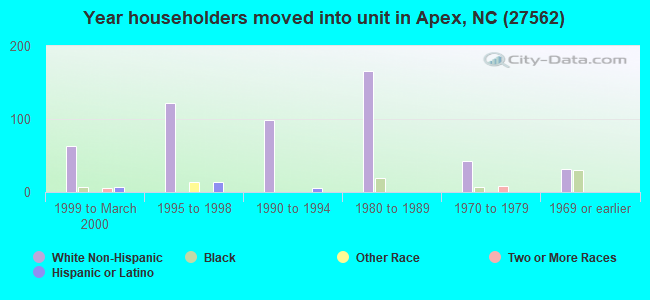
64% of the 27562 zip code residents lived in the same house 5 years ago. Out of people who lived in different houses, 36% lived in this county. Out of people who lived in different counties, 50% lived in North Carolina.
96% of the 27562 zip code residents lived in the same house 1 year ago. Out of people who lived in different houses, 87% moved from this county. Out of people who lived in different houses, 16% moved from different state.
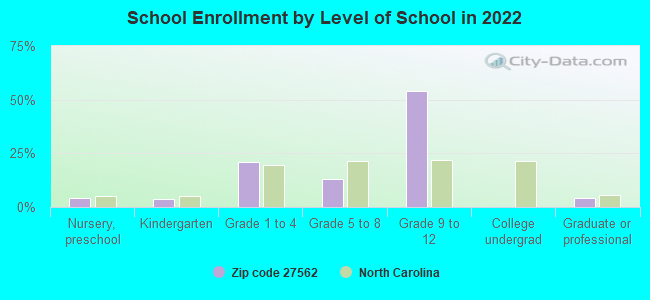
Private vs. public school enrollment:
Students in private schools in grades 1 to 8 (elementary and middle school): 167
Here:
33.6%
North Carolina:
13.8%
Students in private schools in grades 9 to 12 (high school): 246
Here:
30.6%
North Carolina:
11.9%
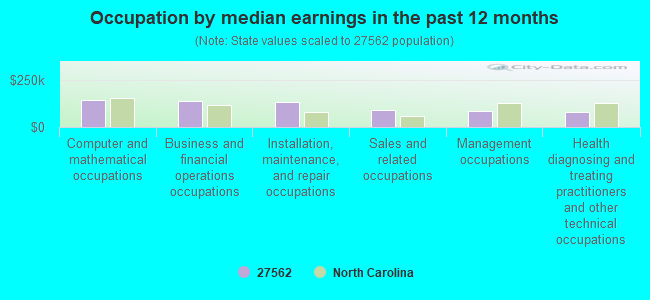
Occupation by median earnings in the past 12 months ($)
142,966Computer and mathematical occupations
137,692Business and financial operations occupations
132,200Installation, maintenance, and repair occupations
90,028Sales and related occupations
87,135Management occupations
81,175Health diagnosing and treating practitioners and other technical occupations
Companies with federal contracts located in this zip code:
DENNIS WELL & PUMP SERVICE, IN (5395 BEAVER CREEK ROAD in NEW HILL, NC; small business) : $91,730 in 3 contractsfrom 2003 to 2004
$76,900 with U.S. Army Corps of Engineers - civil program financing only for Maintenance, Repair or Alteration of Real Property -- Water Supply Facilities. Signed on 2003-04-28. Completion date: 2003-03-11.
$7,415 with Army for Maintenance, Repair or Alteration of Real Property -- Water Supply Facilities. Signed on 2004-05-03. Completion date: 2003-03-11.
$7,415 with U.S. Army Corps of Engineers - civil program financing only for Maintenance, Repair or Alteration of Real Property -- Water Supply Facilities. Signed on 2004-05-03. Completion date: 2003-03-11.
Top industries in this zip code by the number of employees in 2005:
Utilities: Electric Power Distribution (500-999 employees: 1 establishment)
Administrative and Support and Waste Management and Remediation Services: Security Systems Services (except Locksmiths) (250-499: 1)
Management of Companies and Enterprises: Corporate, Subsidiary, and Regional Managing Offices (50-99: 1)
Construction: Poured Concrete Foundation and Structure Contractors (20-49: 1, 5-9: 1)
Health Care and Social Assistance: Homes for the Elderly (20-49: 1)
Construction: Highway, Street, and Bridge Construction (10-19: 1)
Other Services (except Public Administration): Religious Organizations (10-19: 1)
Construction: Siding Contractors (10-19: 1)
Construction: Masonry Contractors (10-19: 1)
Administrative and Support and Waste Management and Remediation Services: Office Administrative Services (5-9: 2)
People in group quarters in 2000:
34 people in hospitals/wards and hospices for chronically ill
34 people in other hospitals or wards for chronically ill
12 people in other noninstitutional group quarters
5 people in homes for the mentally retarded
Fatal accident statistics in 2013:
Fatal accident count: 1
Vehicles involved in fatal accidents: 1
Fatal accidents caused by drunken drivers: 0
Fatalities: 1
Persons involved in fatal accidents: 1
Pedestrians involved in fatal accidents: 1
Fatal accident statistics in 2012:
Fatal accident count: 2
Vehicles involved in fatal accidents: 2
Fatal accidents caused by drunken drivers: 0
Fatalities: 2
Persons involved in fatal accidents: 2
Pedestrians involved in fatal accidents: 0
Home Mortgage Disclosure Act Aggregated Statistics For Year 2009 (Based on 8 partial tracts)
A) FHA, FSA/RHS & VA Home Purchase Loans
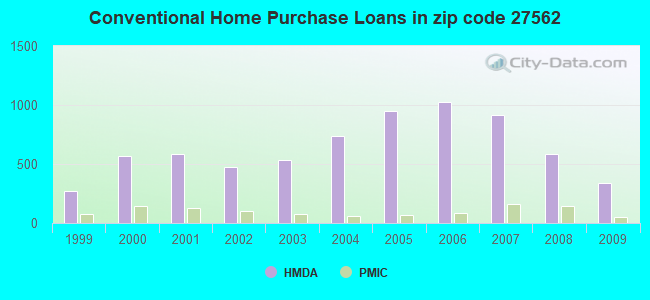
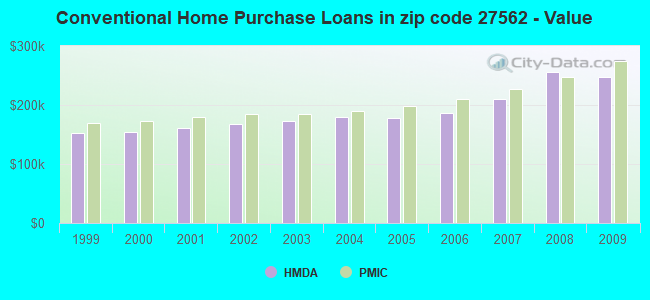
B) Conventional Home Purchase Loans
C) Refinancings
D) Home Improvement Loans
F) Non-occupant Loans on < 5 Family Dwellings (A B C & D)
G) Loans On Manufactured Home Dwelling (A B C & D)
Number
Average Value
Number
Average Value
Number
Average Value
Number
Average Value
Number
Average Value
Number
Average Value
LOANS ORIGINATED
123
$209,223
335
$248,167
1,433
$239,243
22
$146,379
51
$188,111
6
$88,903
APPLICATIONS APPROVED, NOT ACCEPTED
5
$195,988
21
$282,696
84
$242,247
3
$76,093
2
$263,925
0
$0
APPLICATIONS DENIED
10
$214,707
26
$240,007
229
$245,276
15
$76,340
14
$187,346
5
$88,544
APPLICATIONS WITHDRAWN
11
$221,190
43
$273,102
194
$239,285
3
$198,550
11
$164,343
1
$50,800
FILES CLOSED FOR INCOMPLETENESS
2
$158,955
7
$274,009
53
$238,053
3
$96,790
1
$189,490
0
$0
Aggregated Statistics For Year 2008 (Based on 8 partial tracts)
A) FHA, FSA/RHS & VA Home Purchase Loans
B) Conventional Home Purchase Loans
C) Refinancings
D) Home Improvement Loans
E) Loans on Dwellings For 5+ Families
F) Non-occupant Loans on < 5 Family Dwellings (A B C & D)
G) Loans On Manufactured Home Dwelling (A B C & D)
Number
Average Value
Number
Average Value
Number
Average Value
Number
Average Value
Number
Average Value
Number
Average Value
Number
Average Value
LOANS ORIGINATED
68
$212,125
583
$255,379
601
$220,832
30
$84,122
1
$3,087,780
72
$197,944
7
$87,057
APPLICATIONS APPROVED, NOT ACCEPTED
5
$225,604
64
$264,443
70
$207,979
5
$107,380
0
$0
6
$224,115
3
$107,047
APPLICATIONS DENIED
12
$185,106
53
$267,797
196
$207,108
26
$100,606
0
$0
10
$183,270
7
$95,334
APPLICATIONS WITHDRAWN
8
$220,736
63
$243,058
132
$225,684
10
$167,500
0
$0
9
$197,070
2
$114,130
FILES CLOSED FOR INCOMPLETENESS
2
$132,605
11
$310,177
21
$218,650
2
$121,405
0
$0
1
$327,880
0
$0
Aggregated Statistics For Year 2007 (Based on 8 partial tracts)
A) FHA, FSA/RHS & VA Home Purchase Loans
B) Conventional Home Purchase Loans
C) Refinancings
D) Home Improvement Loans
E) Loans on Dwellings For 5+ Families
F) Non-occupant Loans on < 5 Family Dwellings (A B C & D)
G) Loans On Manufactured Home Dwelling (A B C & D)
Number
Average Value
Number
Average Value
Number
Average Value
Number
Average Value
Number
Average Value
Number
Average Value
Number
Average Value
LOANS ORIGINATED
31
$210,065
915
$209,634
469
$185,555
45
$68,109
1
$1,288,030
115
$170,324
9
$79,590
APPLICATIONS APPROVED, NOT ACCEPTED
1
$317,000
117
$205,902
83
$175,578
15
$62,063
0
$0
16
$170,270
2
$46,785
APPLICATIONS DENIED
5
$200,272
82
$221,714
209
$169,569
37
$98,501
0
$0
18
$178,861
5
$88,984
APPLICATIONS WITHDRAWN
3
$221,407
91
$208,931
105
$194,421
9
$117,480
0
$0
12
$155,359
4
$76,455
FILES CLOSED FOR INCOMPLETENESS
1
$217,500
14
$222,754
30
$225,700
1
$158,590
0
$0
1
$154,300
0
$0
Aggregated Statistics For Year 2006 (Based on 8 partial tracts)
A) FHA, FSA/RHS & VA Home Purchase Loans
B) Conventional Home Purchase Loans
C) Refinancings
D) Home Improvement Loans
E) Loans on Dwellings For 5+ Families
F) Non-occupant Loans on < 5 Family Dwellings (A B C & D)
G) Loans On Manufactured Home Dwelling (A B C & D)
Number
Average Value
Number
Average Value
Number
Average Value
Number
Average Value
Number
Average Value
Number
Average Value
Number
Average Value
LOANS ORIGINATED
34
$185,653
1,025
$186,563
456
$154,745
55
$70,525
1
$6,956,730
136
$151,366
10
$103,704
APPLICATIONS APPROVED, NOT ACCEPTED
2
$146,835
88
$188,350
85
$145,482
11
$55,900
0
$0
12
$187,398
3
$78,843
APPLICATIONS DENIED
4
$151,835
94
$168,892
178
$155,482
34
$67,889
0
$0
26
$150,107
9
$58,484
APPLICATIONS WITHDRAWN
5
$159,178
98
$174,706
101
$176,885
11
$115,192
0
$0
12
$155,762
2
$110,095
FILES CLOSED FOR INCOMPLETENESS
1
$83,340
14
$203,079
41
$177,866
2
$40,545
0
$0
3
$160,303
0
$0
Aggregated Statistics For Year 2005 (Based on 8 partial tracts)
A) FHA, FSA/RHS & VA Home Purchase Loans
B) Conventional Home Purchase Loans
C) Refinancings
D) Home Improvement Loans
E) Loans on Dwellings For 5+ Families
F) Non-occupant Loans on < 5 Family Dwellings (A B C & D)
G) Loans On Manufactured Home Dwelling (A B C & D)
Number
Average Value
Number
Average Value
Number
Average Value
Number
Average Value
Number
Average Value
Number
Average Value
Number
Average Value
LOANS ORIGINATED
42
$155,535
952
$177,795
481
$174,154
39
$82,761
1
$8,499,480
113
$135,173
11
$71,392
APPLICATIONS APPROVED, NOT ACCEPTED
3
$148,457
61
$168,600
66
$147,779
9
$42,834
0
$0
4
$196,398
4
$61,932
APPLICATIONS DENIED
4
$151,858
75
$167,045
186
$160,621
37
$71,597
0
$0
15
$127,339
14
$68,112
APPLICATIONS WITHDRAWN
4
$131,740
107
$159,879
116
$171,429
13
$95,086
0
$0
9
$161,143
4
$73,088
FILES CLOSED FOR INCOMPLETENESS
0
$0
15
$196,490
61
$188,076
4
$129,070
0
$0
2
$203,745
1
$72,000
Aggregated Statistics For Year 2004 (Based on 8 partial tracts)
A) FHA, FSA/RHS & VA Home Purchase Loans
B) Conventional Home Purchase Loans
C) Refinancings
D) Home Improvement Loans
E) Loans on Dwellings For 5+ Families
F) Non-occupant Loans on < 5 Family Dwellings (A B C & D)
G) Loans On Manufactured Home Dwelling (A B C & D)
Number
Average Value
Number
Average Value
Number
Average Value
Number
Average Value
Number
Average Value
Number
Average Value
Number
Average Value
LOANS ORIGINATED
57
$147,738
738
$179,330
520
$175,583
26
$79,367
1
$8,492,880
58
$129,426
9
$94,021
APPLICATIONS APPROVED, NOT ACCEPTED
2
$127,565
50
$164,452
66
$157,038
7
$62,874
0
$0
2
$124,295
6
$66,907
APPLICATIONS DENIED
7
$139,701
57
$153,077
180
$147,324
30
$53,156
0
$0
11
$102,545
15
$71,732
APPLICATIONS WITHDRAWN
9
$138,322
83
$160,498
121
$163,711
6
$84,827
0
$0
9
$108,820
4
$93,558
FILES CLOSED FOR INCOMPLETENESS
1
$160,680
8
$185,534
28
$179,647
3
$77,787
0
$0
2
$170,545
0
$0
Aggregated Statistics For Year 2003 (Based on 8 partial tracts)
A) FHA, FSA/RHS & VA Home Purchase Loans
B) Conventional Home Purchase Loans
C) Refinancings
D) Home Improvement Loans
F) Non-occupant Loans on < 5 Family Dwellings (A B C & D)
Number
Average Value
Number
Average Value
Number
Average Value
Number
Average Value
Number
Average Value
LOANS ORIGINATED
75
$146,735
538
$172,977
1,497
$172,674
19
$53,048
48
$133,503
APPLICATIONS APPROVED, NOT ACCEPTED
2
$173,285
32
$155,392
133
$165,149
2
$41,225
3
$162,687
APPLICATIONS DENIED
4
$149,268
49
$127,072
211
$146,770
13
$44,955
9
$132,716
APPLICATIONS WITHDRAWN
7
$142,951
57
$162,774
148
$163,257
2
$42,410
4
$130,992
FILES CLOSED FOR INCOMPLETENESS
1
$81,180
10
$144,106
37
$169,496
1
$20,440
3
$98,400
Aggregated Statistics For Year 2002 (Based on 8 partial tracts)
A) FHA, FSA/RHS & VA Home Purchase Loans
B) Conventional Home Purchase Loans
C) Refinancings
D) Home Improvement Loans
F) Non-occupant Loans on < 5 Family Dwellings (A B C & D)
Number
Average Value
Number
Average Value
Number
Average Value
Number
Average Value
Number
Average Value
LOANS ORIGINATED
81
$139,707
471
$168,229
992
$168,681
27
$26,610
35
$122,033
APPLICATIONS APPROVED, NOT ACCEPTED
5
$155,632
39
$146,953
79
$145,310
5
$37,650
1
$169,810
APPLICATIONS DENIED
4
$141,730
47
$99,114
138
$117,627
18
$35,906
8
$143,766
APPLICATIONS WITHDRAWN
7
$138,026
50
$153,820
100
$144,598
7
$29,283
5
$114,570
FILES CLOSED FOR INCOMPLETENESS
2
$168,940
10
$226,936
32
$142,339
1
$14,160
0
$0
Aggregated Statistics For Year 2001 (Based on 8 partial tracts)
A) FHA, FSA/RHS & VA Home Purchase Loans
B) Conventional Home Purchase Loans
C) Refinancings
D) Home Improvement Loans
F) Non-occupant Loans on < 5 Family Dwellings (A B C & D)
Number
Average Value
Number
Average Value
Number
Average Value
Number
Average Value
Number
Average Value
LOANS ORIGINATED
130
$144,746
583
$160,713
695
$159,596
33
$34,877
29
$120,529
APPLICATIONS APPROVED, NOT ACCEPTED
6
$140,445
54
$125,687
57
$135,290
6
$37,768
1
$32,720
APPLICATIONS DENIED
7
$128,044
65
$88,265
110
$108,740
13
$27,095
6
$65,110
APPLICATIONS WITHDRAWN
6
$134,710
38
$165,267
89
$141,227
7
$23,516
4
$137,972
FILES CLOSED FOR INCOMPLETENESS
1
$110,090
7
$203,589
23
$156,475
0
$0
0
$0
Aggregated Statistics For Year 2000 (Based on 8 partial tracts)
A) FHA, FSA/RHS & VA Home Purchase Loans
B) Conventional Home Purchase Loans
C) Refinancings
D) Home Improvement Loans
F) Non-occupant Loans on < 5 Family Dwellings (A B C & D)
Number
Average Value
Number
Average Value
Number
Average Value
Number
Average Value
Number
Average Value
LOANS ORIGINATED
123
$136,390
564
$154,098
111
$131,276
39
$28,943
21
$99,020
APPLICATIONS APPROVED, NOT ACCEPTED
10
$89,653
55
$125,379
27
$112,701
9
$22,940
1
$166,290
APPLICATIONS DENIED
15
$100,882
90
$100,761
81
$89,516
14
$21,364
5
$86,188
APPLICATIONS WITHDRAWN
11
$125,955
48
$138,646
38
$102,854
4
$43,015
1
$130,550
FILES CLOSED FOR INCOMPLETENESS
1
$118,640
10
$170,502
11
$110,898
1
$36,200
2
$146,870
Aggregated Statistics For Year 1999 (Based on 4 partial tracts)
A) FHA, FSA/RHS & VA Home Purchase Loans
B) Conventional Home Purchase Loans
C) Refinancings
D) Home Improvement Loans
F) Non-occupant Loans on < 5 Family Dwellings (A B C & D)
2002 - 2018 National Fire Incident Reporting System (NFIRS) incidents
According to the data from the years 2002 - 2018 the average number of fires per year is 9. The highest number of reported fire incidents - 20 took place in 2011, and the least - 0 in 2004. The data has a decreasing trend.
When looking into fire subcategories, the most incidents belonged to: Outside Fires (46.2%), and Structure Fires (34.0%).
Fire incident types reported to NFIRS in Zip Code 27562
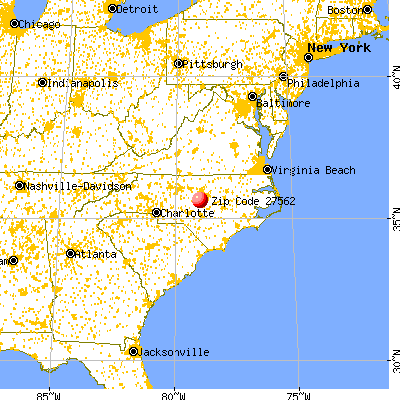


 Nearest zip codes: 27540, 27502, 27559, 27523, 27539, 27526.


 According to the data from the years 2002 - 2018 the average number of fires per year is 9. The highest number of reported fire incidents - 20 took place in 2011, and the least - 0 in 2004. The data has a decreasing trend.
 When looking into fire subcategories, the most incidents belonged to: Outside Fires (46.2%), and Structure Fires (34.0%).