Estimated zip code population in 2022: 58,108 Zip code population in 2010: 38,894 Zip code population in 2000: 24,906
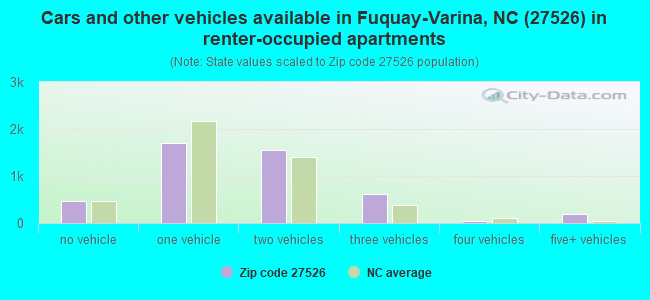
Houses and condos: 22,045 Renter-occupied apartments: 4,529
% of renters here:
21%
State:
33%
March 2022 cost of living index in zip code 27526: 86.9 (less than average, U.S. average is 100)
Land area: 96.9 sq. mi. Water area: 0.8 sq. mi.
Population density: 599 people per square mile
(low).
OSM Map
General Map
Google Map
MSN Map
OSM Map
General Map
Google Map
MSN Map
OSM Map
General Map
Google Map
MSN Map
OSM Map
General Map
Google Map
MSN Map
Please wait while loading the map...
Real estate property taxes paid for housing units in 2022:
This zip code:
0.6% ($2,332)
North Carolina:
0.6% ($1,769)
Median real estate property taxes paid for housing units with mortgages in 2022: $2,340 (0.6%) Median real estate property taxes paid for housing units with no mortgage in 2022: $2,228 (0.6%)
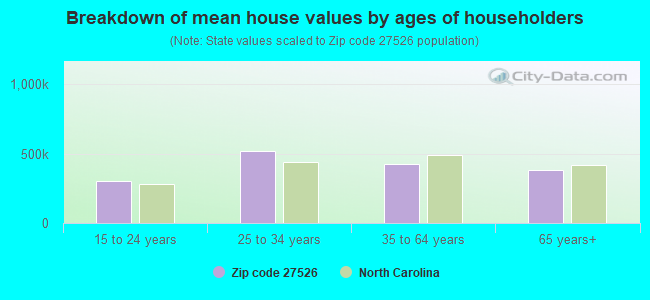
Estimated median house/condo value in 2022: $389,065
27526:
$389,065
North Carolina:
$280,600
According to our research of North Carolina and other state lists, there were 28 registered sex offenders living in 27526 zip code as of April 26, 2024. The ratio of all residents to sex offenders in zip code 27526 is 1,574 to 1. The ratio of registered sex offenders to all residents in this zip code is much lower than the state average.
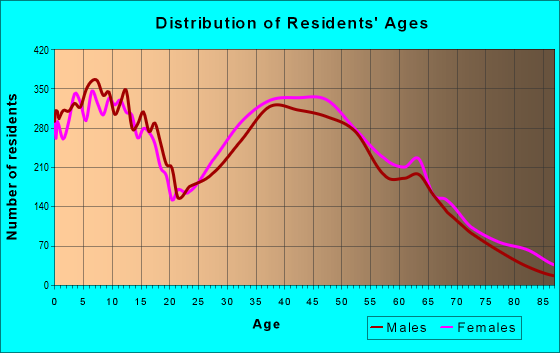
Median resident age:
This zip code:
38.0 years
North Carolina median age:
39.2 years
Average household size:
This zip code:
2.7 people
North Carolina:
2.4 people
Averages for the 2020 tax year for zip code 27526, filed in 2021:
Average Adjusted Gross Income (AGI) in 2020: $81,843 (Individual Income Tax Returns)
Here:
$81,843
State:
$70,020
Salary/wage: $73,908 (reported on 82.7% of returns)
Here:
$73,908
State:
$58,387
(% of AGI for various income ranges: 1141.7% for AGIs below $25k, 3587.3% for AGIs $25k-50k, 6559.5% for AGIs $50k-75k, 9429.4% for AGIs $75k-100k, 19257.0% for AGIs $100k-200k, 68788.2% for AGIs over 200k)
Taxable interest for individuals: $899 (reported on 37.7% of returns)
This zip code:
$899
North Carolina:
$1,479
(% of AGI for various income ranges: 16.8% for AGIs below $25k, 22.5% for AGIs $25k-50k, 37.5% for AGIs $50k-75k, 56.1% for AGIs $75k-100k, 82.6% for AGIs $100k-200k, 414.3% for AGIs over 200k)
Ordinary dividends: $3,850 (reported on 22.5% of returns)
Here:
$3,850
State:
$7,888
(% of AGI for various income ranges: 26.5% for AGIs below $25k, 45.7% for AGIs $25k-50k, 70.2% for AGIs $50k-75k, 124.1% for AGIs $75k-100k, 223.8% for AGIs $100k-200k, 1405.4% for AGIs over 200k)
Net capital gain/loss in AGI: +$13,431 (reported on 20.7% of returns)
Here:
+$13,431
State:
+$23,652
(% of AGI for various income ranges: 13.6% for AGIs below $25k, 40.3% for AGIs $25k-50k, 74.5% for AGIs $50k-75k, 157.5% for AGIs $75k-100k, 397.7% for AGIs $100k-200k, 9638.9% for AGIs over 200k)
Profit/loss from business: +$11,465 (reported on 17.8% of returns)
Here:
+$11,465
State:
+$11,710
(% of AGI for various income ranges: 137.2% for AGIs below $25k, 192.0% for AGIs $25k-50k, 253.0% for AGIs $50k-75k, 299.5% for AGIs $75k-100k, 496.9% for AGIs $100k-200k, 1792.0% for AGIs over 200k)
Taxable individual retirement arrangement distribution: $21,681 (reported on 10.5% of returns)
27526:
$21,681
North Carolina:
$20,247
(% of AGI for various income ranges: 70.1% for AGIs below $25k, 142.8% for AGIs $25k-50k, 248.4% for AGIs $50k-75k, 404.5% for AGIs $75k-100k, 605.9% for AGIs $100k-200k, 2784.1% for AGIs over 200k)
Self-employed (Keogh) retirement plans: $16,908 (reported on 0.5% of returns)
27526:
$16,908
North Carolina:
$26,749
(% of AGI for various income ranges: 4.6% for AGIs $25k-50k, 22.2% for AGIs $100k-200k, 213.0% for AGIs over 200k)
Total itemized deductions: $31,263 (reported on 11.4% of returns)
Here:
$31,263
State:
$34,549
(% of AGI for various income ranges: 71.6% for AGIs below $25k, 130.5% for AGIs $25k-50k, 376.7% for AGIs $50k-75k, 481.6% for AGIs $75k-100k, 986.4% for AGIs $100k-200k, 5700.5% for AGIs over 200k)
Charity contributions: $11,348 (reported on 9.3% of returns)
Here:
$11,348
State:
$13,360
(% of AGI for various income ranges: 4.2% for AGIs below $25k, 22.3% for AGIs $25k-50k, 63.0% for AGIs $50k-75k, 90.3% for AGIs $75k-100k, 266.2% for AGIs $100k-200k, 2595.9% for AGIs over 200k)
Taxes paid: $7,685 (reported on 11.4% of returns)
27526:
$7,685
State:
$7,586
(% of AGI for various income ranges: 9.0% for AGIs below $25k, 23.5% for AGIs $25k-50k, 79.8% for AGIs $50k-75k, 127.6% for AGIs $75k-100k, 290.5% for AGIs $100k-200k, 1246.1% for AGIs over 200k)
Earned income credit: $2,156 (reported on 10.5% of returns)
Here:
$2,156
State:
$2,337
(% of AGI for various income ranges: 74.3% for AGIs below $25k, 64.7% for AGIs $25k-50k, 1.4% for AGIs $50k-75k)
Percentage of individuals using paid preparers for their 2020 taxes: 93.5%
Here:
93%
State:
93%
(% for various income ranges: 91.6% for AGIs below $25k, 94.0% for AGIs $25k-50k, 93.8% for AGIs $50k-75k, 93.2% for AGIs $75k-100k, 94.4% for AGIs $100k-200k, 96.0% for AGIs over 200k)
Averages for the 2012 tax year for zip code 27526, filed in 2013:
Average Adjusted Gross Income (AGI) in 2012: $64,732 (Individual Income Tax Returns)
Here:
$64,732
State:
$54,937
Salary/wage: $57,509 (reported on 85.2% of returns)
Here:
$57,509
State:
$46,336
(% of AGI for various income ranges: 74.7% for AGIs below $25k, 77.8% for AGIs $25k-50k, 76.9% for AGIs $50k-75k, 81.1% for AGIs $75k-100k, 82.8% for AGIs $100k-200k, 55.2% for AGIs over 200k)
Taxable interest for individuals: $975 (reported on 41.4% of returns)
This zip code:
$975
North Carolina:
$1,298
(% of AGI for various income ranges: 1.3% for AGIs below $25k, 0.7% for AGIs $25k-50k, 0.5% for AGIs $50k-75k, 0.4% for AGIs $75k-100k, 0.5% for AGIs $100k-200k, 1.0% for AGIs over 200k)
Ordinary dividends: $3,382 (reported on 20.6% of returns)
Here:
$3,382
State:
$6,213
(% of AGI for various income ranges: 1.2% for AGIs below $25k, 1.0% for AGIs $25k-50k, 0.9% for AGIs $50k-75k, 0.8% for AGIs $75k-100k, 0.7% for AGIs $100k-200k, 2.1% for AGIs over 200k)
Net capital gain/loss in AGI: +$7,731 (reported on 17.4% of returns)
Here:
+$7,731
State:
+$12,740
(% of AGI for various income ranges: 0.2% for AGIs below $25k, 0.2% for AGIs $25k-50k, 0.5% for AGIs $50k-75k, 0.5% for AGIs $75k-100k, 0.9% for AGIs $100k-200k, 8.8% for AGIs over 200k)
Profit/loss from business: +$10,094 (reported on 16.7% of returns)
Here:
+$10,094
State:
+$10,311
(% of AGI for various income ranges: 7.7% for AGIs below $25k, 4.1% for AGIs $25k-50k, 2.4% for AGIs $50k-75k, 2.1% for AGIs $75k-100k, 1.7% for AGIs $100k-200k, 2.2% for AGIs over 200k)
Taxable individual retirement arrangement distribution: $15,283 (reported on 10.2% of returns)
27526:
$15,283
North Carolina:
$15,575
(% of AGI for various income ranges: 3.2% for AGIs below $25k, 2.4% for AGIs $25k-50k, 2.6% for AGIs $50k-75k, 2.3% for AGIs $75k-100k, 2.4% for AGIs $100k-200k, 2.1% for AGIs over 200k)
Self-employment retirement plans: $15,686 (reported on 0.4% of returns)
27526:
$15,686
North Carolina:
$21,078
(% of AGI for various income ranges: 0.2% for AGIs $25k-50k, 0.3% for AGIs over 200k)
Total itemized deductions: $21,796 (21% of AGI, reported on 48.4% of returns)
Here:
$21,796
State:
$23,438
Here:
21.4% of AGI
State:
21.5% of AGI
(% of AGI for various income ranges: 14.6% for AGIs below $25k, 14.8% for AGIs $25k-50k, 17.5% for AGIs $50k-75k, 17.9% for AGIs $75k-100k, 17.1% for AGIs $100k-200k, 14.1% for AGIs over 200k)
Charity contributions: $3,918 (reported on 40.1% of returns)
Here:
$3,918
State:
$4,687
(% of AGI for various income ranges: 1.2% for AGIs below $25k, 1.8% for AGIs $25k-50k, 2.2% for AGIs $50k-75k, 2.3% for AGIs $75k-100k, 2.6% for AGIs $100k-200k, 3.2% for AGIs over 200k)
Taxes paid: $7,930 (reported on 48.4% of returns)
27526:
$7,930
State:
$8,823
(% of AGI for various income ranges: 2.2% for AGIs below $25k, 3.4% for AGIs $25k-50k, 5.2% for AGIs $50k-75k, 6.2% for AGIs $75k-100k, 7.2% for AGIs $100k-200k, 6.9% for AGIs over 200k)
Earned income credit: $2,179 (reported on 14.9% of returns)
Here:
$2,179
State:
$2,376
(% of AGI for various income ranges: 6.2% for AGIs below $25k, 1.1% for AGIs $25k-50k)
Percentage of individuals using paid preparers for their 2012 taxes: 46.1%
Here:
46%
State:
53%
(% for various income ranges: 44.2% for AGIs below $25k, 45.6% for AGIs $25k-50k, 48.5% for AGIs $50k-75k, 44.0% for AGIs $75k-100k, 45.9% for AGIs $100k-200k, 66.1% for AGIs over 200k)
Averages for the 2004 tax year for zip code 27526, filed in 2005:
Average Adjusted Gross Income (AGI) in 2004: $53,939 (Individual Income Tax Returns)
Here:
$53,939
State:
$45,376
Salary/wage: $49,193 (reported on 87.5% of returns)
Here:
$49,193
State:
$39,442
(% of AGI for various income ranges: 131.1% for AGIs below $10k, 77.2% for AGIs $10k-25k, 83.0% for AGIs $25k-50k, 84.4% for AGIs $50k-75k, 85.1% for AGIs $75k-100k, 72.9% for AGIs over 100k)
Taxable interest for individuals: $1,099 (reported on 48.6% of returns)
This zip code:
$1,099
North Carolina:
$1,515
(% of AGI for various income ranges: 8.7% for AGIs below $10k, 2.3% for AGIs $10k-25k, 1.0% for AGIs $25k-50k, 0.8% for AGIs $50k-75k, 0.6% for AGIs $75k-100k, 0.9% for AGIs over 100k)
Taxable dividends: $2,151 (reported on 25.0% of returns)
Here:
$2,151
State:
$4,016
(% of AGI for various income ranges: 4.5% for AGIs below $10k, 1.0% for AGIs $10k-25k, 0.8% for AGIs $25k-50k, 0.7% for AGIs $50k-75k, 0.7% for AGIs $75k-100k, 1.3% for AGIs over 100k)
Net capital gain/loss: +$6,901 (reported on 19.7% of returns)
Here:
+$6,901
State:
+$11,152
(% of AGI for various income ranges: -2.1% for AGIs below $10k, 0.2% for AGIs $10k-25k, 0.5% for AGIs $25k-50k, 0.7% for AGIs $50k-75k, 1.0% for AGIs $75k-100k, 5.4% for AGIs over 100k)
Profit/loss from business: +$9,803 (reported on 16.7% of returns)
Here:
+$9,803
State:
+$9,490
(% of AGI for various income ranges: 1.2% for AGIs below $10k, 6.7% for AGIs $10k-25k, 3.6% for AGIs $25k-50k, 2.6% for AGIs $50k-75k, 2.5% for AGIs $75k-100k, 2.8% for AGIs over 100k)
IRA payment deduction: $3,028 (reported on 2.5% of returns)
27526:
$3,028
North Carolina:
$2,967
(% of AGI for various income ranges: 0.1% for AGIs $10k-25k, 0.2% for AGIs $25k-50k, 0.1% for AGIs $50k-75k, 0.2% for AGIs $75k-100k, 0.1% for AGIs over 100k)
Self-employed pension: $9,369 (reported on 0.6% of returns)
Here:
$9,369
North Carolina:
$14,754
(% of AGI for various income ranges: 0.1% for AGIs $25k-50k, 0.1% for AGIs $50k-75k, 0.1% for AGIs $75k-100k, 0.2% for AGIs over 100k)
Total itemized deductions: $19,053 (23% of AGI, reported on 52.8% of returns)
Here:
$19,053
State:
$19,464
Here:
23.2% of AGI
State:
22.7% of AGI
(% of AGI for various income ranges: 23.9% for AGIs below $10k, 15.1% for AGIs $10k-25k, 18.8% for AGIs $25k-50k, 20.2% for AGIs $50k-75k, 20.2% for AGIs $75k-100k, 17.5% for AGIs over 100k)
Charity contributions deductions: $3,193 (4% of AGI, reported on 46.5% of returns)
Here:
$3,193
State:
$4,035
Here:
3.7% of AGI
State:
4.5% of AGI
(% of AGI for various income ranges: 1.2% for AGIs below $10k, 1.6% for AGIs $10k-25k, 2.2% for AGIs $25k-50k, 2.8% for AGIs $50k-75k, 2.9% for AGIs $75k-100k, 3.1% for AGIs over 100k)
Total tax: $7,630 (reported on 77.0% of returns)
27526:
$7,630
State:
$7,257
(% of AGI for various income ranges: 3.8% for AGIs below $10k, 3.9% for AGIs $10k-25k, 6.2% for AGIs $25k-50k, 7.9% for AGIs $50k-75k, 9.5% for AGIs $75k-100k, 16.1% for AGIs over 100k)
Earned income credit: $1,806 (reported on 12.5% of returns)
Here:
$1,806
State:
$1,851
Percentage of individuals using paid preparers for their 2004 taxes: 53.8%
Here:
54%
State:
62%
(% for various income ranges: 47.5% for AGIs below $10k, 61.5% for AGIs $10k-25k, 54.5% for AGIs $25k-50k, 53.9% for AGIs $50k-75k, 48.5% for AGIs $75k-100k, 54.1% for AGIs over 100k)
Likely homosexual households (counted as self-reported same-sex unmarried-partner households)
Lesbian couples: 0.0% of all households
Gay men: 0.1% of all households
Household received Food Stamps/SNAP in the past 12 months: 1,970 Household did not receive Food Stamps/SNAP in the past 12 months: 19,488
Women who had a birth in the past 12 months: 710 (500 now married, 211 unmarried) Women who did not have a birth in the past 12 months: 12,967 (7,476 now married, 5,530 unmarried)
Housing units in zip code 27526 with a mortgage: 13,015 (1,083 second mortgage, 20 home equity loan, 931 both second mortgage and home equity loan) Houses without a mortgage: 284
Median monthly owner costs for units with a mortgage: $1,640 Median monthly owner costs for units without a mortgage: $486
Residents with income below the poverty level in 2022:
This zip code:
8.2%
Whole state:
12.8%
Residents with income below 50% of the poverty level in 2022:
This zip code:
4.7%
Whole state:
6.8%
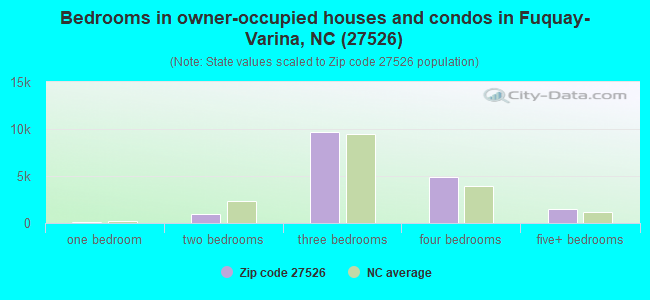
Median number of rooms in houses and condos:
Here:
6.9
State:
6.4
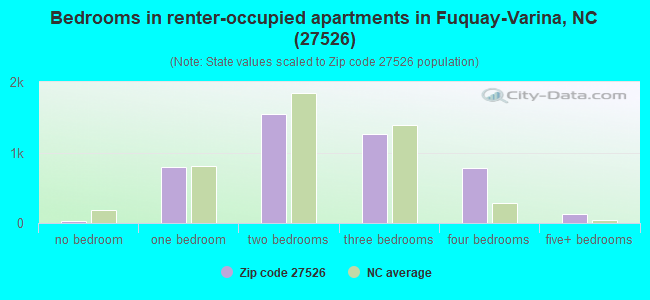
Median number of rooms in apartments:
Here:
4.7
State:
4.4
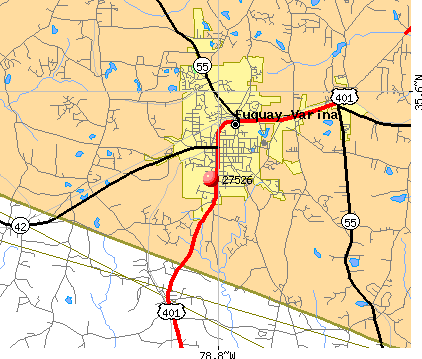
Notable locations in this zip code not listed on our city pages
Churches in zip code 27526 include: Grove Church (A), Bethlehem Church (B), Wake Chapel (C), Mc Coy Grove Church (D), Chalk Level Church (E), Piney Grove Church (F), Cumberland Church (G), Pleasant Grove Church (H), Providence Church (I). Display/hide their locations on the map
Cemeteries: Olive Branch Cemetery (1), Pleasant Hill Cemetery (2), Smith Cemetery (3), Greenlawn Memorial Gardens (4). Display/hide their locations on the map
Reservoirs: Sunset Lake (A), Akins Pond Number Two (B), Pearson Pond (C), Slaughter Pond (D), Parkers Pond (E), Adcock Pond (F), Powell Lake (G), W I Rowland Pond (H). Display/hide their locations on the map
Streams, rivers, and creeks: Coopers Branch (A), Buckhorn Creek (B), Avents Creek (C), Parkers Creek (D), Mill Creek (E), Hector Creek (F). Display/hide their locations on the map
10,974 married couples with children.
2,872 single-parent households (860 men, 2,012 women).
89.7% of residents of 27526 zip code speak English at home.
6.9% of residents speak Spanish at home (71% very well, 18% well, 9% not well, 2% not at all).
1.7% of residents speak other Indo-European language at home (90% very well, 10% well).
0.8% of residents speak Asian or Pacific Island language at home (67% very well, 3% well, 30% not well).
0.5% of residents speak other language at home (76% very well, 24% well).
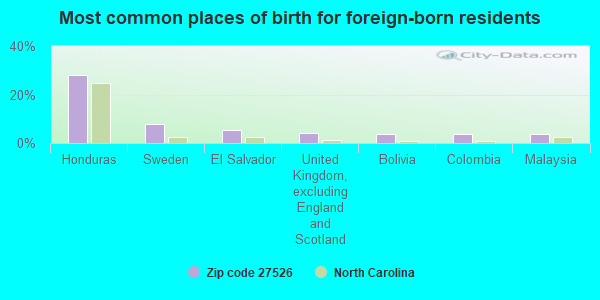
Foreign born population: 3,519 (6.1%) (44.2% of them are naturalized citizens)
This zip code:
6.1%
Whole state:
8.6%
28%Honduras
8%Sweden
5%El Salvador
4%United Kingdom, excluding England and Scotland
4%Bolivia
4%Colombia
4%Malaysia
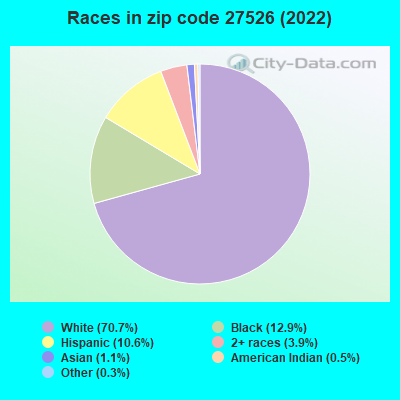
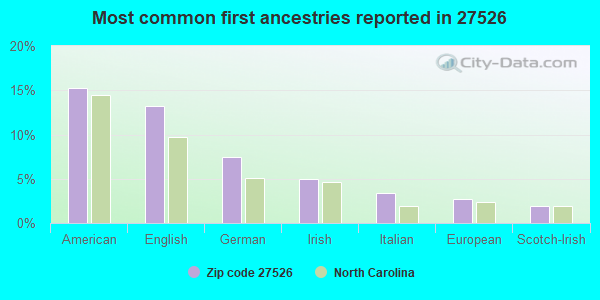
15%American
13%English
7%German
5%Irish
3%Italian
3%European
2%Scotch-Irish
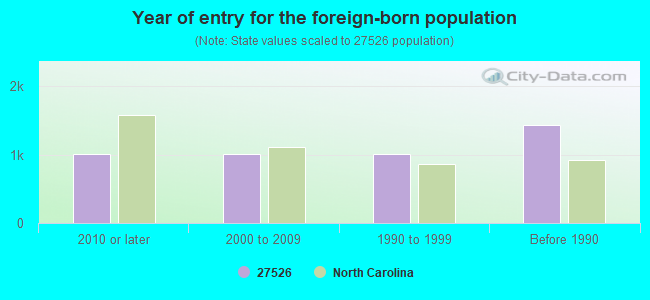
Year of entry for the foreign-born population
1,0082010 or later
1,0052000 to 2009
1,0111990 to 1999
1,438Before 1990
Facilities with environmental interests located in this zip code:
BRYANT GRADING INC. LCID LANDF (376 SPENCE MILL ROAD in FUQUAY VARINA, NC)
STATE MASTER (North Carolina facility info) - -115DA4YG00M69W84AY3WR62YSJ, WASTEWATER FACILITY National Pollutant Discharge Elimination System NON-MAJOR (Tracking pollutant discharge elimination systems) - permit Business SIC classification: CONSTRUCTION SAND AND GRAVEL Alternative names: BRYANT GRADING INCORPORATED
DIVERSICARE ASSISTED LIVING SERVICES (U.S. HIGHWAY 401 in FUQUAY VARINA, NC)
STATE MASTER (North Carolina facility info) - -115DA4YG00TP2W64FBEP829898, WASTEWATER FACILITY National Pollutant Discharge Elimination System NON-MAJOR (Tracking pollutant discharge elimination systems) - permit Business SIC classification: SKILLED NURSING CARE FACILITIES
BALLENTINE ELEMENTARY (1651 MCLAURIN LANE in FUQUAY VARINA, NC)
(National Center for Education Statistics) - STATE ID-327 Organizations: WAKE COUNTY SCHOOLS (SCHOOL DISTRICT)
BASF FIELD TEST SITE (ROUSE ROAD in FUQUAY VARINA, NC)
BRIGHTON FOREST WWTP (NCSR 1375 in FUQUAY VARINA, NC)
National Pollutant Discharge Elimination System NON-MAJOR (Tracking pollutant discharge elimination systems) - permit Business SIC classification: SEWERAGE SYSTEMS Alternative names: BROOKFIELD PROP-BRIGHTON FOR, FMRK INC BRIGHTON FOREST WWTP
BOB BARKER COMPANY INCORPORATED (500 WAKE CHAPEL ROAD in FUQUAY VARINA, NC)
Conditionally Exempt Small Quantity Generators, less than 100 kg/month of hazardous waste (Resource Conservation and Recovery Act (tracking hazardous waste)) - notification Organizations: ROBERT J BARKER (CONTACT/OWNER)
DON JENKINS & SON FORD MURCURY (US HWY 401 N in FUQUAY VARINA, NC)
Small Quantity Generators, between 100 kg and 1000 kg of hazardous waste/month (Resource Conservation and Recovery Act (tracking hazardous waste)) - notification Organizations: HARRY W JENKINS (CONTACT/OWNER)
DUKES IMPORT AUTO REPAIR (1716 W ACADEMY ST in FUQUAY VARINA, NC)
Conditionally Exempt Small Quantity Generators, less than 100 kg/month of hazardous waste (Resource Conservation and Recovery Act (tracking hazardous waste)) - notification Organizations: JESSE M DUKES (CONTACT/OWNER)
Housing units lacking complete plumbing facilities: 0.2% Housing units lacking complete kitchen facilities: 0.6%
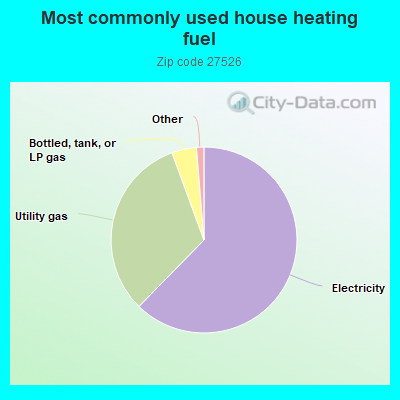
62.4%Electricity
32.1%Utility gas
4.3%Bottled, tank, or LP gas
Population in 1990: 16,537. Population change in the 1990s: +8,369 (+50.6%).
Place of birth for U.S.-born residents:
This state: 25,756
Northeast: 10,684
Midwest: 4,654
South: 9,989
West: 2,696
51% of the 27526 zip code residents lived in the same house 5 years ago. Out of people who lived in different houses, 48% lived in this county. Out of people who lived in different counties, 50% lived in North Carolina.
92% of the 27526 zip code residents lived in the same house 1 year ago. Out of people who lived in different houses, 41% moved from this county. Out of people who lived in different houses, 23% moved from different county within same state. Out of people who lived in different houses, 32% moved from different state. Out of people who lived in different houses, 8% moved from abroad.
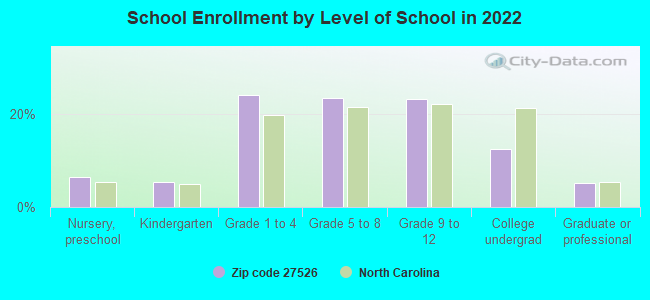
Private vs. public school enrollment:
Students in private schools in grades 1 to 8 (elementary and middle school): 777
Here:
12.3%
North Carolina:
13.8%
Students in private schools in grades 9 to 12 (high school): 528
Here:
16.9%
North Carolina:
11.9%
Students in private undergraduate colleges: 418
Here:
25.0%
North Carolina:
19.3%
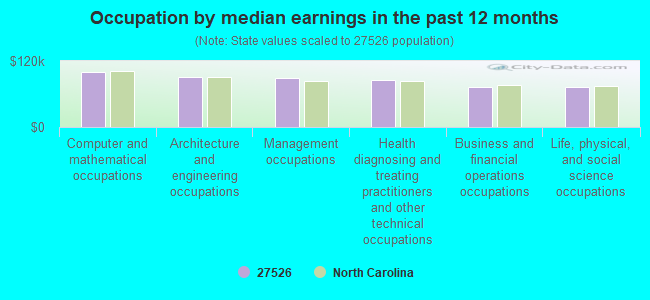
Occupation by median earnings in the past 12 months ($)
99,501Computer and mathematical occupations
91,211Architecture and engineering occupations
89,774Management occupations
86,114Health diagnosing and treating practitioners and other technical occupations
72,755Business and financial operations occupations
72,311Life, physical, and social science occupations
Companies with federal contracts located in this zip code (FUQUAY VARINA, NC):
APEX INSTRUMENTS, INC (204 TECHNOLOGY PARK LANE; small business) : $69,419 in 5 contractsfrom 1999 to 2006
Contracts for Laboratory Equipment and Supplies, Cabinets, Lockers, Bins, and Shelving by Tennessee Valley Authority, Army, EPA Signed by year:2000: $0; 2001: $0; 2002: $0; 2003: $3,076; 2004: $4,141; 2005: $3,631; 2006: $4,571.
Biggest contracts:
$54,000 with Tennessee Valley Authority for Laboratory Equipment and Supplies. Signed on 1999-12-15. Completion date: 1999-12-15.
$4,571 with Army for Laboratory Equipment and Supplies. Signed on 2006-05-01. Completion date: 2006-05-15.
$4,141, same as above.Signed on 2004-04-08. Completion date: 2004-05-28.
$3,631 with EPA for Cabinets, Lockers, Bins, and Shelving. Signed on 2005-08-04. Completion date: 2005-08-12.
TYCO ELECTRONICS CORPORATION (8000 PURFOY ROAD)
$36,660 with Navy for Electrical Insulators and Insulating Materials. Signed on 2004-04-06. Completion date: 2004-06-15.
EDWARDS, CRAIG L (300 POWHATAN DR; small business)
$9,400 with Army for Demolition of Buildings. Signed on 2005-04-04. Completion date: 2005-03-01.
LISA M HOFFMAN (817 SWAN HILL CT; small business) : $8,000 in 2 contractsin 2002
$8,000 with National Institutes of Health for Technical Writing Services. Signed on 2002-10-15. Completion date: 2003-09-15.
$0, same as above.Signed on 2002-10-15. Completion date: 2003-09-15.
HARE SPECIALTY ADVERTISING INC (209 S FUQUAY AVE; small business)
$5,950 with Army for Miscellaneous Items. Signed on 2004-09-29. Completion date: 2004-10-29.
Top industries in this zip code by the number of employees in 2005:
2002 - 2018 National Fire Incident Reporting System (NFIRS) incidents
According to the data from the years 2002 - 2018 the average number of fire incidents per year is 147. The highest number of fires - 219 took place in 2005, and the least - 42 in 2007. The data has a declining trend.
When looking into fire subcategories, the most incidents belonged to: Outside Fires (41.7%), and Structure Fires (41.5%).
Fire incident types reported to NFIRS in Zip Code 27526
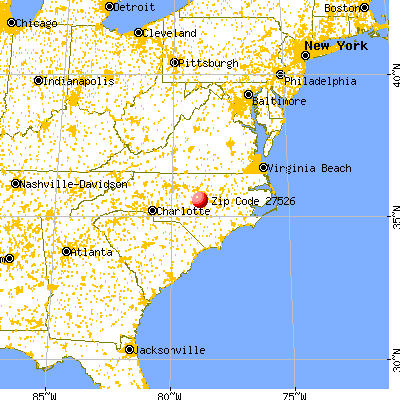


 Nearest zip codes: 27540, 27539, 27592, 27501, 27546, 27562.
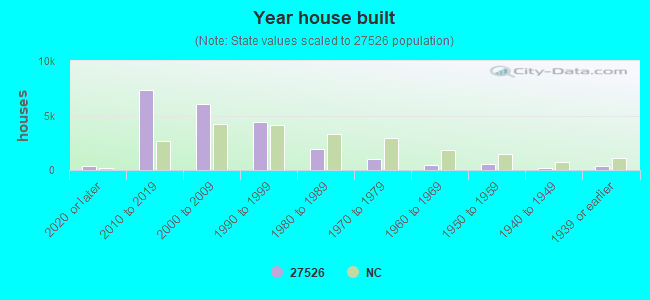


 According to the data from the years 2002 - 2018 the average number of fire incidents per year is 147. The highest number of fires - 219 took place in 2005, and the least - 42 in 2007. The data has a declining trend.
 When looking into fire subcategories, the most incidents belonged to: Outside Fires (41.7%), and Structure Fires (41.5%).