Harnett County, North Carolina (NC)
County owner-occupied free and clear houses and condos in 2010: 8,235
County owner-occupied houses and condos in 2000: 23,753
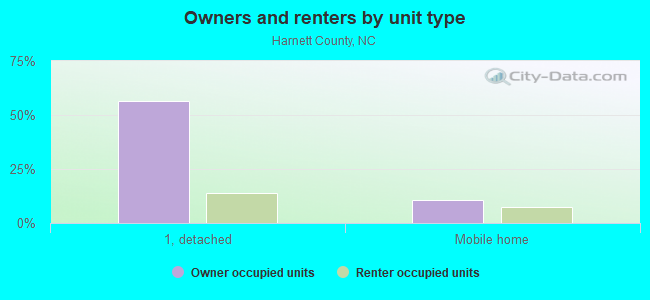
Renter-occupied apartments: 13,777 (it was 10,047 in 2000)
| % of renters here: | 30% |
| State: | 33% |
Land area: 595 sq. mi.
Water area: 6.3 sq. mi.
Population density: 233 people per square mile (high).
Industries providing employment: Educational, health and social services (21.3%), Retail trade (13.3%), Manufacturing (12.1%), Construction (10.6%).
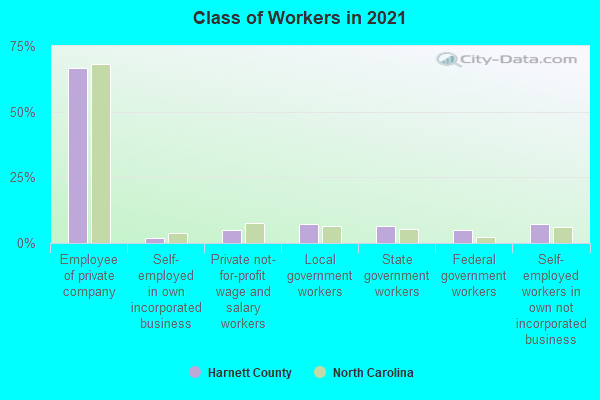
Type of workers:
- Private wage or salary: 71%
- Government: 24%
- Self-employed, not incorporated: 5%
- Unpaid family work: 0%
- OSM Map
- General Map
- Google Map
- MSN Map

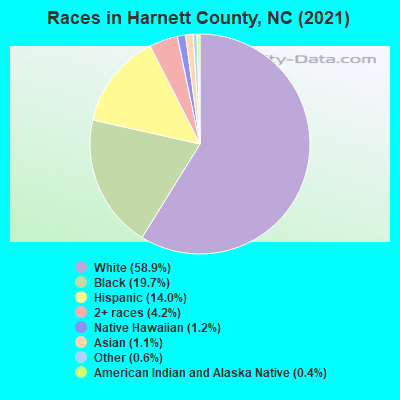
- 81,99559.1%White Non-Hispanic Alone
- 27,61319.9%Black Non-Hispanic Alone
- 20,16514.5%Hispanic or Latino
- 5,4934.0%Two or more races
- 1,3281.0%Asian alone
- 1,0660.8%Native Hawaiian and Other
Pacific Islander alone - 9880.7%American Indian and Alaska Native alone
- 1840.1%Some other race alone
| Median resident age: | 35.6 years |
| North Carolina median age: | 39.2 years |
| Males: 68,463 | |
| Females: 70,369 |

 | Toll Brothers joins Massive Harnett County residential development (45 replies) |
| 2022 NC County Census Estimates (110 replies) |
| NC's 25 Largest Cities (623 replies) |
| North Raleigh compared to South Charlotte... (43 replies) |
| Road Construction/Projects in Coastal NC (429 replies) |
| I-95 projects (74 replies) |
| Harnett County: | 2.0 people |
| North Carolina: | 2 people |
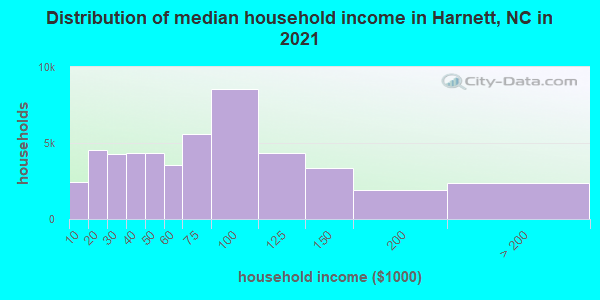
Estimated median household income in 2022: $65,778 ($35,105 in 1999)
| This county: | $65,778 |
| North Carolina: | $67,481 |
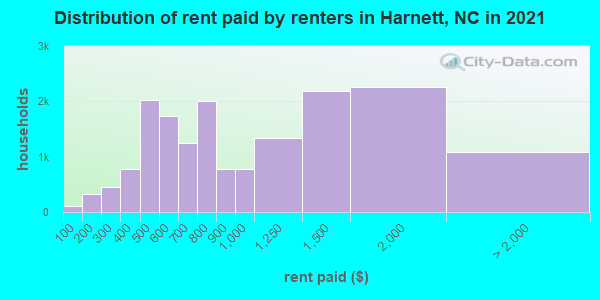
Median contract rent in 2022 for apartments: $709 (lower quartile is $510, upper quartile is $1,131)
| This county: | $709 |
| State: | $945 |
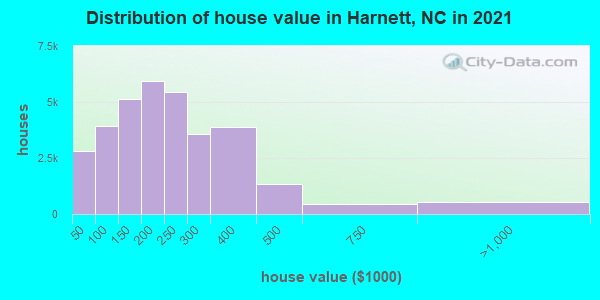
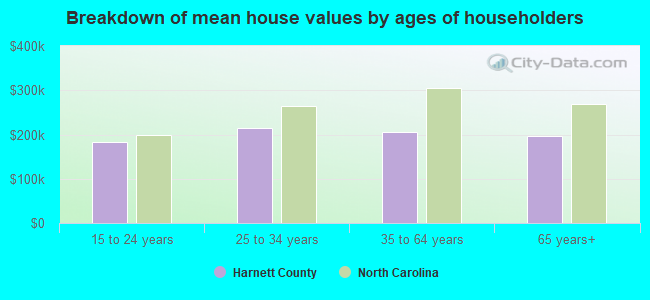
Estimated median house or condo value in 2022: $243,600 (it was $80,600 in 2000)
| Harnett: | $243,600 |
| North Carolina: | $280,600 |
Mean price in 2022:
Median monthly housing costs for homes and condos with a mortgage: $1,395Detached houses: $277,842
Here: $277,842 State: $375,326 Townhouses or other attached units: $381,883
Here: $381,883 State: $317,935 In 2-unit structures: $186,629
Here: $186,629 State: $250,488 In 3-to-4-unit structures: $185,794
Here: $185,794 State: $254,939 In 5-or-more-unit structures: $282,578
Here: $282,578 State: $329,290 Mobile homes: $112,268
Here: $112,268 State: $124,933 Occupied boats, RVs, vans, etc.: $133,387
Here: $133,387 State: $107,261
Median monthly housing costs for units without a mortgage: $432
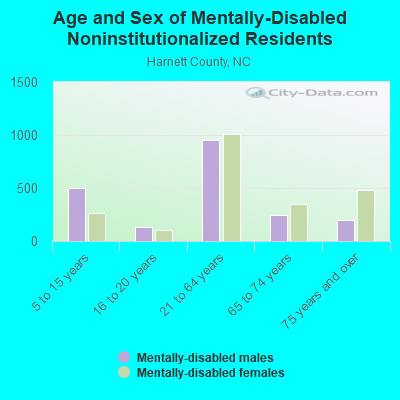
Institutionalized population: 1,470
Crime in 2021 (reported by the sheriff's office or county police, not the county total):
- Murders: 14
- Rapes: 17
- Robberies: 17
- Assaults: 193
- Burglaries: 330
- Thefts: 950
- Auto thefts: 142
Crime in 2020 (reported by the sheriff's office or county police, not the county total):
- Murders: 5
- Rapes: 18
- Robberies: 18
- Assaults: 188
- Burglaries: 462
- Thefts: 905
- Auto thefts: 185
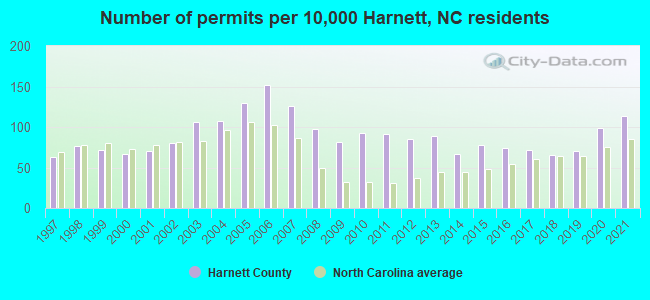
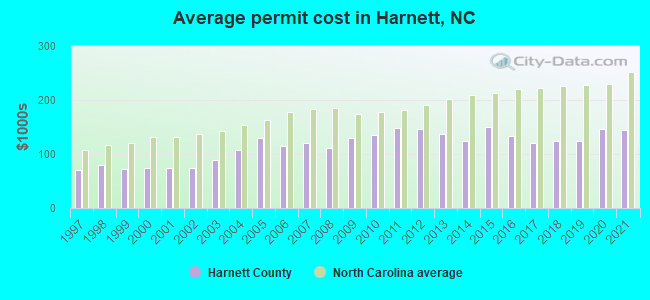
Single-family new house construction building permits:
- 2022: 1031 buildings, average cost: $148,100
- 2021: 1032 buildings, average cost: $144,200
- 2020: 902 buildings, average cost: $146,100
- 2019: 639 buildings, average cost: $123,600
- 2018: 597 buildings, average cost: $123,800
- 2017: 650 buildings, average cost: $121,100
- 2016: 678 buildings, average cost: $133,300
- 2015: 708 buildings, average cost: $149,800
- 2014: 610 buildings, average cost: $124,100
- 2013: 813 buildings, average cost: $137,400
- 2012: 770 buildings, average cost: $145,500
- 2011: 824 buildings, average cost: $149,300
- 2010: 835 buildings, average cost: $135,900
- 2009: 738 buildings, average cost: $128,600
- 2008: 889 buildings, average cost: $111,000
- 2007: 1148 buildings, average cost: $120,800
- 2006: 1383 buildings, average cost: $113,600
- 2005: 1180 buildings, average cost: $130,000
- 2004: 980 buildings, average cost: $106,800
- 2003: 961 buildings, average cost: $88,600
- 2002: 727 buildings, average cost: $75,400
- 2001: 633 buildings, average cost: $74,900
- 2000: 612 buildings, average cost: $75,200
- 1999: 647 buildings, average cost: $73,300
- 1998: 694 buildings, average cost: $78,600
- 1997: 571 buildings, average cost: $70,800
Median real estate property taxes paid for housing units with mortgages in 2022: $1,697 (0.6%)
Median real estate property taxes paid for housing units with no mortgage in 2022: $1,436 (0.8%)
| Harnett County: | 13.2% |
| North Carolina: | 12.8% |
Median age of residents in 2022: 35.6 years old
(Males: 35.4 years old, Females: 35.8 years old)
(Median age for: White residents: 39.8 years old, Black residents: 37.6 years old, American Indian residents: 29.9 years old, Asian residents: 35.3 years old, Hispanic or Latino residents: 23.5 years old, Other race residents: 25.1 years old)
Fair market rent in 2006 for a 1-bedroom apartment in Harnett County is $465 a month.
Fair market rent for a 2-bedroom apartment is $515 a month.
Fair market rent for a 3-bedroom apartment is $695 a month.
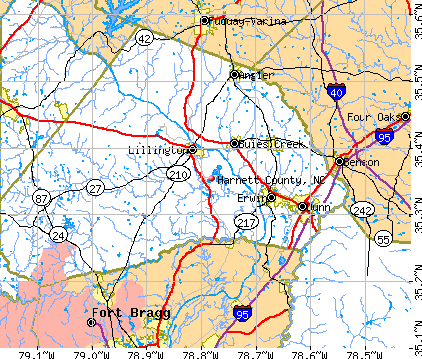
Cities in this county include: Dunn, Erwin, Angier, Lillington, Buies Creek, Coats, Mamers, Bunnlevel.
Notable locations in this county outside city limits:
Notable locations in Harnett County: Glenn Oaks Golf Club (A), Tuckers Grove Campground (B), Cowans Ford (C), Fortneys Forge (D), Hoyles Store (E), Smiths Store (F), Howards Creek Mill (G), Beam Dairy Farm (H), Cowans Ford Visitors Center (I), Cowans Ford Overlook (J), Cove Haven (K), Ranger Island Marina (L), Lincolnton Water Treatment Plant (M). Display/hide their locations on the map
Churches in Harnett County include: Hebron Church (A), Hulls Grove Church (B), Indian Creek Church (C), Ivey Memorial Church (D), Beals Chapel (E), Bethlehem Church (F), Calvary Church (G), Gainsville Church (H), Holy Cross Church (I). Display/hide their locations on the map
Cemeteries: Keever Cemetery (1), Ebenezer Cemetery (2), Forney Cemetery (3). Display/hide their locations on the map
Lakes and reservoirs: Nixon Lake (A), Smith Lake (B), Horseshoe Lake (C), Carpenters Lake (D), Quinlen Lake (E), Taylors Lake (F), Gladdens Lake (G), Episcopal Church Lake (H). Display/hide their locations on the map
Streams, rivers, and creeks: Dellinger Branch (A), Crooked Creek (B), Clark Creek (C), Carpenter Creek (D), Burton Creek (E), Bradshaw Branch (F), Ballard Creek (G), Armstrong Branch (H), Anderson Creek (I). Display/hide their locations on the map
Parks in Harnett County include: Beatty Ford Access Area (1), Black Trailer Park (2). Display/hide their locations on the map
Neighboring counties: Chester County, Tennessee  , Crockett County, Tennessee , Moore County , Pitt County
  , Transylvania County , Roberts County, Texas .
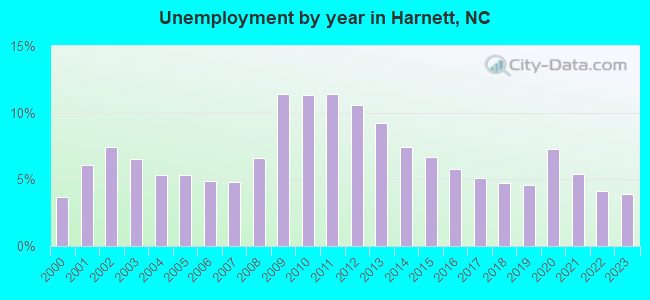
| Here: | 3.6% |
| North Carolina: | 3.2% |
Current college students: 6,071
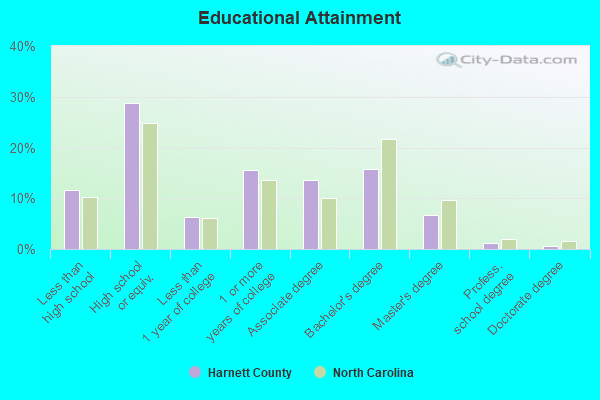
People 25 years of age or older with a high school degree or higher: 87.6%
People 25 years of age or older with a bachelor's degree or higher: 23.7%
Number of foreign born residents: 9,266 (35.3% naturalized citizens)
| Harnett County: | 6.7% |
| Whole state: | 8.6% |
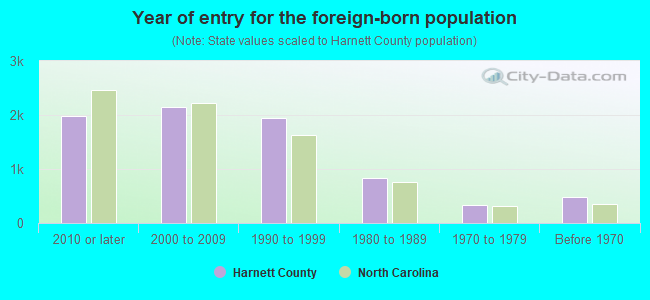
- Year of entry for the foreign-born population
- 2,2562010 or later
- 2,2962000 to 2009
- 1,9971990 to 1999
- 8391980 to 1989
- 3401970 to 1979
- 480Before 1970
Mean travel time to work (commute): minutes
Percentage of county residents living and working in this county: 98.0%
Housing units in structures:
- One, detached: 39,493
- One, attached: 1,630
- Two: 1,454
- 3 or 4: 1,548
- 5 to 9: 1,065
- 10 to 19: 178
- 20 to 49: 340
- 50 or more: 202
- Mobile homes: 9,015
Housing units in Harnett County with a mortgage: 24,492 (1,375 second mortgage, 0 home equity loan, 1,177 both second mortgage and home equity loan)
Houses without a mortgage: 434
| Here: | 5.2% with mortgage |
| State: | 97.0% with mortgage |
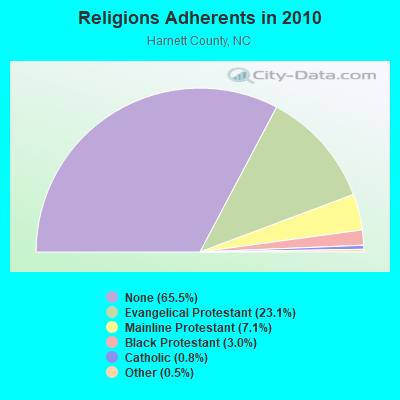
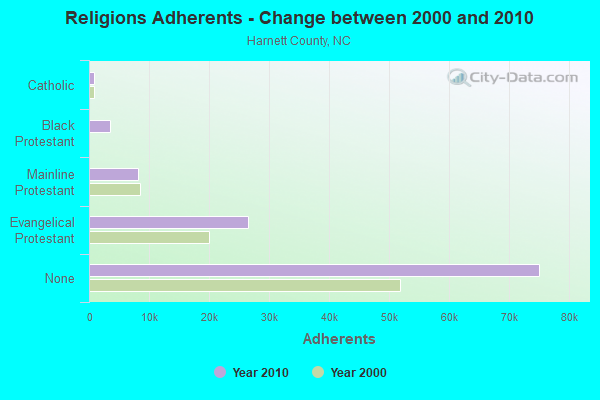
Religion statistics for Harnett County
| Religion | Adherents | Congregations |
|---|---|---|
| Evangelical Protestant | 26,479 | 115 |
| Mainline Protestant | 8,199 | 40 |
| Black Protestant | 3,488 | 21 |
| Catholic | 895 | 1 |
| Other | 533 | 3 |
| None | 75,084 | - |
Source: Clifford Grammich, Kirk Hadaway, Richard Houseal, Dale E.Jones, Alexei Krindatch, Richie Stanley and Richard H.Taylor. 2012. 2010 U.S.Religion Census: Religious Congregations & Membership Study. Association of Statisticians of American Religious Bodies. Jones, Dale E., et al. 2002. Congregations and Membership in the United States 2000. Nashville, TN: Glenmary Research Center.
Food Environment Statistics:
| Harnett County: | 1.57 / 10,000 pop. |
| State: | 2.05 / 10,000 pop. |
| Here: | 0.09 / 10,000 pop. |
| North Carolina: | 0.14 / 10,000 pop. |
| This county: | 0.64 / 10,000 pop. |
| North Carolina: | 0.92 / 10,000 pop. |
| Harnett County: | 4.61 / 10,000 pop. |
| North Carolina: | 4.75 / 10,000 pop. |
| This county: | 4.15 / 10,000 pop. |
| State: | 7.57 / 10,000 pop. |
| Harnett County: | 8.7% |
| North Carolina: | 9.8% |
| Harnett County: | 29.5% |
| State: | 28.3% |
| Here: | 14.0% |
| State: | 15.6% |
Agriculture in Harnett County:
Average size of farms: 157 acresAverage value of agricultural products sold per farm: $143,881
Average value of crops sold per acre for harvested cropland: $562.80
The value of nursery, greenhouse, floriculture, and sod as a percentage of the total market value of agricultural products sold: 1.32%
The value of livestock, poultry, and their products as a percentage of the total market value of agricultural products sold: 71.53%
Average total farm production expenses per farm: $121,279
Harvested cropland as a percentage of land in farms: 46.46%
Irrigated harvested cropland as a percentage of land in farms: 6.97%
Average market value of all machinery and equipment per farm: $73,725
The percentage of farms operated by a family or individual: 91.10%
Average age of principal farm operators: 55 years
Average number of cattle and calves per 100 acres of all land in farms: 7.52
Corn for grain: 3135 harvested acres
All wheat for grain: 2897 harvested acres
Upland cotton: 14473 harvested acres
Soybeans for beans: 20434 harvested acres
Vegetables: 744 harvested acres
Land in orchards: 48 acres
Tornado activity:
Harnett County historical area-adjusted tornado activity is significantly below North Carolina state average. It is 5413722.6 times below overall U.S. average.Earthquake activity:
Harnett County-area historical earthquake activity is significantly above North Carolina state average. It is 51% smaller than the overall U.S. average.On 8/23/2011 at 17:51:04, a magnitude 5.8 (5.8 MW, Depth: 3.7 mi, Class: Moderate, Intensity: VI - VII) earthquake occurred 183.0 miles away from Harnett County center
On 8/9/2020 at 12:07:37, a magnitude 5.1 (5.1 MW, Depth: 4.7 mi) earthquake occurred 151.0 miles away from the county center
On 11/22/1974 at 05:25:55, a magnitude 4.7 (4.7 MB, Class: Light, Intensity: IV - V) earthquake occurred 186.7 miles away from the county center
On 8/2/1974 at 08:52:09, a magnitude 4.9 (4.3 MB, 4.9 LG) earthquake occurred 234.5 miles away from the county center
On 12/9/2003 at 20:59:14, a magnitude 4.5 (4.5 MB, 4.5 LG) earthquake occurred 162.1 miles away from Harnett County center
On 12/9/2003 at 20:59:18, a magnitude 4.5 (4.5 ML, Depth: 6.2 mi) earthquake occurred 171.7 miles away from the county center
Magnitude types: regional Lg-wave magnitude (LG), body-wave magnitude (MB), local magnitude (ML), moment magnitude (MW)
Most recent natural disasters:
- North Carolina Covid-19 Pandemic, Incident Period: January 20, 2020, FEMA Id: 4487, Natural disaster type: Other
- North Carolina Hurricane Florence, Incident Period: September 7, 2018 - September 29, 2018, FEMA Id: 4393, Natural disaster type: Hurricane
- North Carolina Hurricane Matthew, Incident Period: October 04, 2016 to October 24, 2016, Emergency Declared EM-3380: October 07, 2016, FEMA Id: 3380, Natural disaster type: Hurricane
- North Carolina Hurricane Matthew, Incident Period: October 04, 2016 to October 24, 2016, Major Disaster (Presidential) Declared DR-4285: October 10, 2016, FEMA Id: 4285, Natural disaster type: Hurricane
- North Carolina Severe Storms, Tornadoes, and Flooding, Incident Period: April 16, 2011, Major Disaster (Presidential) Declared DR-1969: April 19, 2011, FEMA Id: 1969, Natural disaster type: Storm, Tornado, Flood
- North Carolina Hurricane Katrina Evacuation, Incident Period: August 29, 2005 to October 01, 2005, Emergency Declared EM-3222: September 05, 2005, FEMA Id: 3222, Natural disaster type: Hurricane
- North Carolina Hurricane Isabel, Incident Period: September 18, 2003 to September 26, 2003, Major Disaster (Presidential) Declared DR-1490: September 18, 2003, FEMA Id: 1490, Natural disaster type: Hurricane
- North Carolina Severe Ice Storm, Incident Period: December 04, 2002 to December 06, 2002, Major Disaster (Presidential) Declared DR-1448: December 12, 2002, FEMA Id: 1448, Natural disaster type: Ice Storm
- North Carolina Winter Storm, Incident Period: January 24, 2000 to February 01, 2000, Major Disaster (Presidential) Declared DR-1312: January 31, 2000, FEMA Id: 1312, Natural disaster type: Winter Storm
- North Carolina Hurricane Floyd & Irene, Incident Period: September 15, 1999 to November 02, 1999, Major Disaster (Presidential) Declared DR-1292: September 16, 1999, FEMA Id: 1292, Natural disaster type: Hurricane
- 5 other natural disasters have been reported since 1953.
The number of natural disasters in Harnett County (15) is near the US average (15).
Major Disasters (Presidential) Declared: 9
Emergencies Declared: 4
Causes of natural disasters: Hurricanes: 8, Ice Storms: 2, Blizzard: 1, Drought: 1, Flood: 1, Storm: 1, Tornado: 1, Winter Storm: 1, Other: 1 (Note: some incidents may be assigned to more than one category).
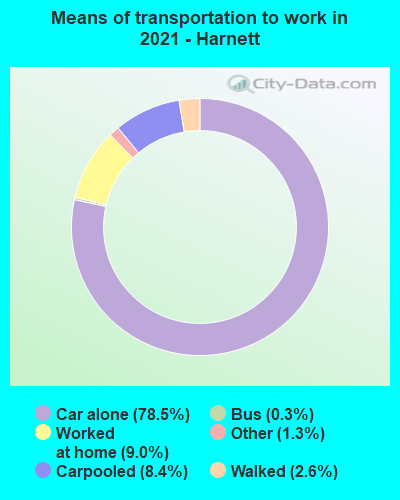
Means of transportation to work:
- Drove a car alone: 23,085 (71.5%)
- Carpooled: 3,124 (9.7%)
- Bus: 60 (0.2%)
- Taxicab, motorcycle, or other means: 370 (1.1%)
- Walked: 963 (3.0%)
- Worked at home: 4,493 (13.9%)
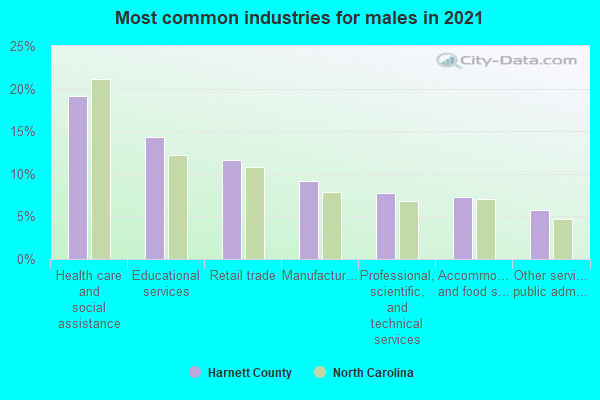
- Health care and social assistance (20%)
- Retail trade (15%)
- Educational services (14%)
- Manufacturing (8%)
- Accommodation and food services (8%)
- Public administration (7%)
- Professional, scientific, and technical services (6%)
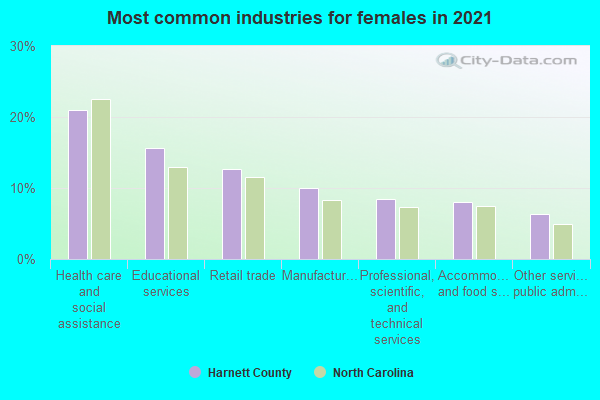
- Health care and social assistance (20%)
- Retail trade (15%)
- Educational services (14%)
- Manufacturing (8%)
- Accommodation and food services (8%)
- Public administration (7%)
- Professional, scientific, and technical services (6%)
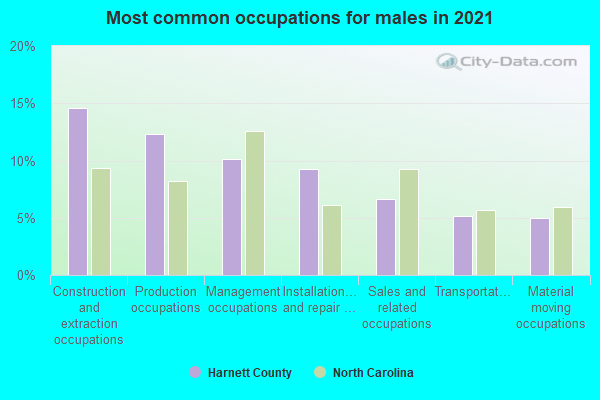
- Construction and extraction occupations (13%)
- Management occupations (9%)
- Material moving occupations (9%)
- Sales and related occupations (8%)
- Production occupations (8%)
- Office and administrative support occupations (7%)
- Transportation occupations (7%)
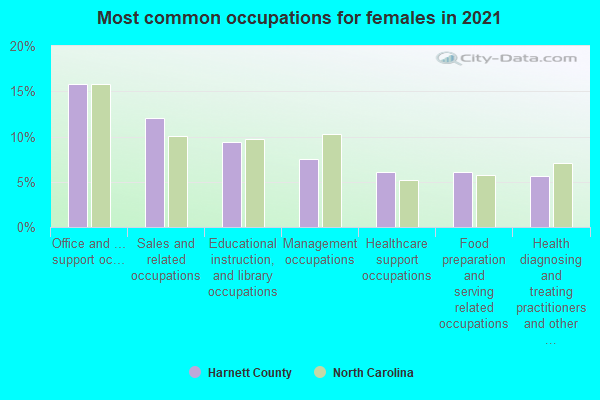
- Office and administrative support occupations (14%)
- Sales and related occupations (11%)
- Educational instruction, and library occupations (10%)
- Healthcare support occupations (8%)
- Management occupations (8%)
- Health diagnosing and treating practitioners and other technical occupations (8%)
- Production occupations (8%)
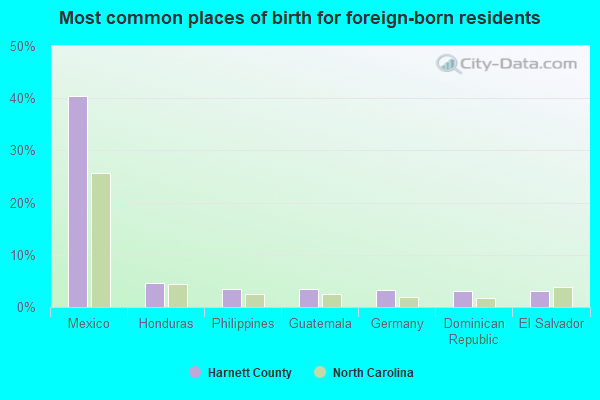
- Mexico (41%)
- Honduras (5%)
- Jamaica (5%)
- Germany (3%)
- Colombia (3%)
- Philippines (3%)
- Dominican Republic (2%)
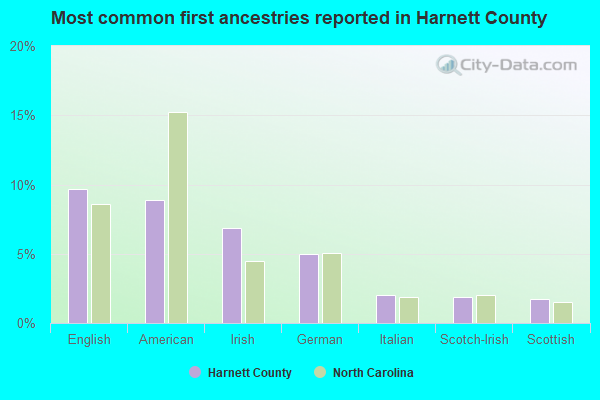
- English (9%)
- American (8%)
- Irish (6%)
- German (5%)
- Italian (2%)
- Scottish (2%)
- Scotch-Irish (2%)
People in group quarters in Harnett County, North Carolina in 2010:
- 1,765 people in college/university student housing
- 981 people in state prisons
- 479 people in nursing facilities/skilled-nursing facilities
- 53 people in group homes intended for adults
- 40 people in residential treatment centers for adults
- 28 people in emergency and transitional shelters (with sleeping facilities) for people experiencing homelessness
- 24 people in workers' group living quarters and job corps centers
- 10 people in group homes for juveniles (non-correctional)
People in group quarters in Harnett County, North Carolina in 2000:
- 1,063 people in college dormitories (includes college quarters off campus)
- 876 people in state prisons
- 518 people in nursing homes
- 252 people in other noninstitutional group quarters
- 132 people in homes for the mentally retarded
- 20 people in other nonhousehold living situations
- 13 people in unknown juvenile institutions
- 7 people in homes or halfway houses for drug/alcohol abuse
- 6 people in homes for the mentally ill
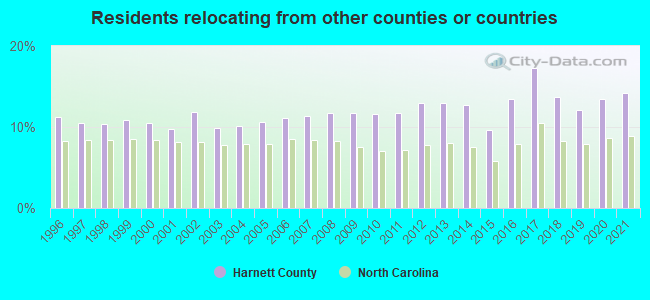
14.17% of this county's 2021 resident taxpayers lived in other counties in 2020 ($54,170 average adjusted gross income)
| Here: | 14.17% |
| North Carolina average: | 8.85% |
0.29% of residents moved from foreign countries ($1,285 average AGI)
Harnett County: 0.29% North Carolina average: 0.04%
8.57% relocated from other counties in North Carolina ($30,932 average AGI)
5.31% relocated from other states ($21,953 average AGI)
Harnett County: 5.31% North Carolina average: 4.18%
Top counties from which taxpayers relocated into this county between 2020 and 2021:
| from Wake County, NC | |
| from Cumberland County, NC | |
| from Lee County, NC | |
| from Johnston County, NC | |
| from Moore County, NC | |
| from Sampson County, NC | |
| from Durham County, NC |
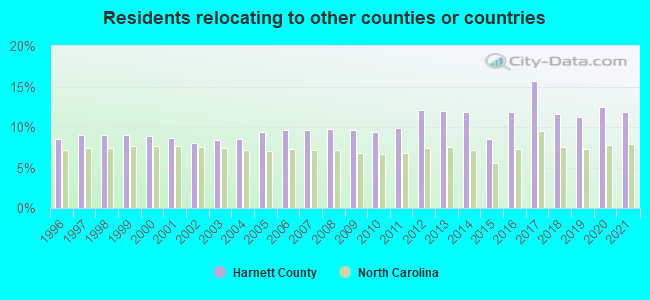
11.85% of this county's 2020 resident taxpayers moved to other counties in 2021 ($52,888 average adjusted gross income)
| Here: | 11.85% |
| North Carolina average: | 7.89% |
0.17% of residents moved to foreign countries ($1,047 average AGI)
Harnett County: 0.17% North Carolina average: 0.03%
7.09% relocated to other counties in North Carolina ($28,967 average AGI)
4.58% relocated to other states ($22,875 average AGI)
Harnett County: 4.58% North Carolina average: 3.18%
Top counties to which taxpayers relocated from this county between 2020 and 2021:
| to Cumberland County, NC | |
| to Wake County, NC | |
| to Johnston County, NC | |
| to Lee County, NC | |
| to Moore County, NC | |
| to Sampson County, NC | |
| to Hoke County, NC |
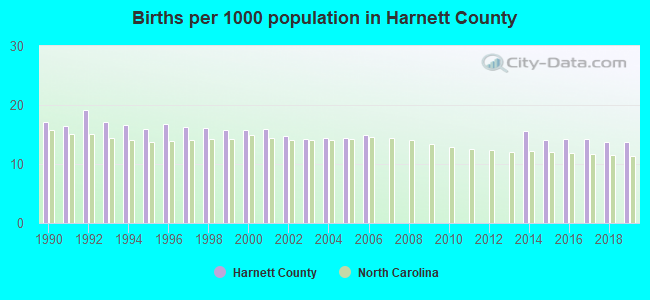
Births per 1000 population from 1990 to 1999: 16.8
Births per 1000 population from 2000 to 2009: 10.4
Births per 1000 population from 2010 to 2022: 7.6
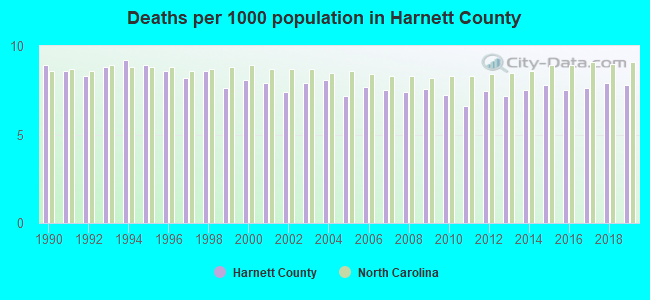
Deaths per 1000 population from 1990 to 1999: 8.6
Deaths per 1000 population from 2000 to 2009: 7.7
Deaths per 1000 population from 2010 to 2020: 7.6
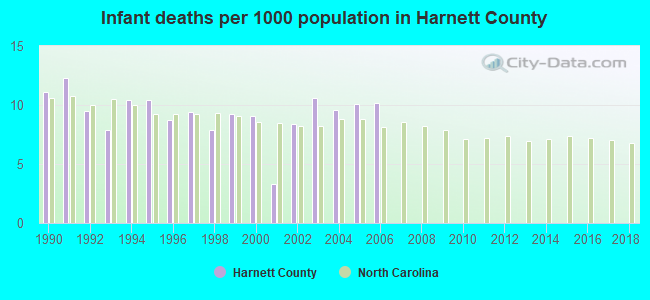
Infant deaths per 1000 live births from 1990 to 1999: 9.7
Infant deaths per 1000 live births from 2000 to 2006: 8.8
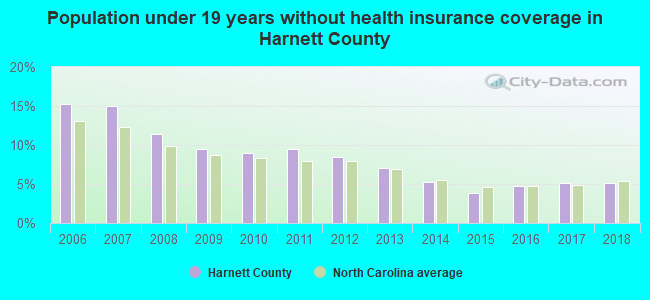
Persons under 19 years old without health insurance coverage in 2018: 5.1%
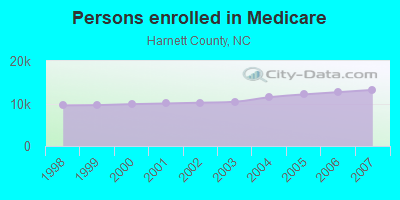
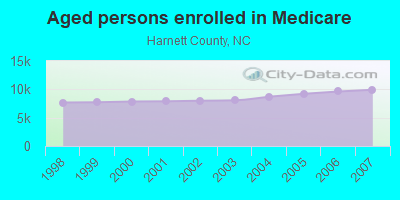
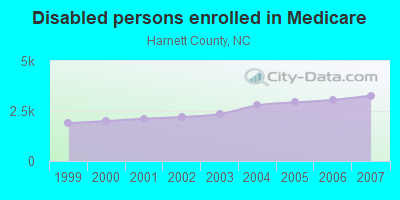
Persons enrolled in hospital insurance and/or supplemental medical insurance (Medicare) in July 1, 2007: 13,197 (9,924 aged, 3,273 disabled)
Children under 18 without health insurance coverage in 2007: 4,075 (13%)
Most common underlying causes of death in Harnett County, North Carolina in 1999 - 2019:
- Atherosclerotic heart disease (1,331)
- Bronchus or lung, unspecified - Malignant neoplasms (1,266)
- Chronic obstructive pulmonary disease, unspecified (811)
- Acute myocardial infarction, unspecified (660)
- Stroke, not specified as haemorrhage or infarction (618)
- Unspecified dementia (585)
- Alzheimer disease, unspecified (405)
- Chronic ischaemic heart disease, unspecified (342)
- Unspecified diabetes mellitus, without complications (316)
- Septicaemia, unspecified (247)
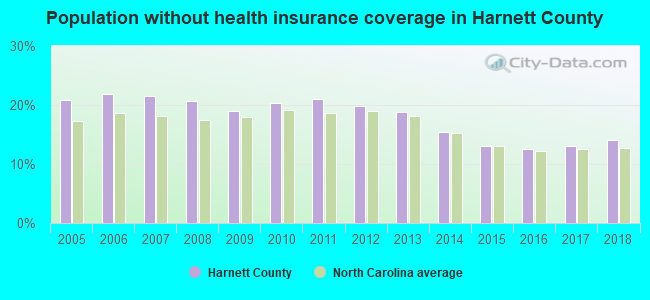
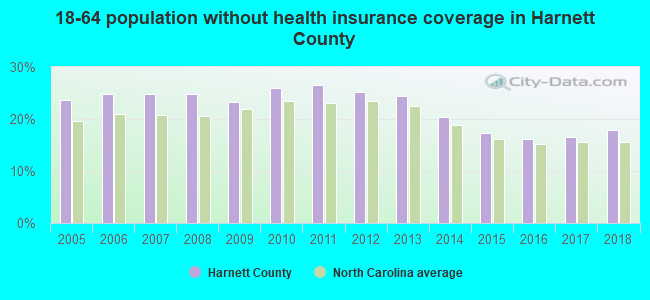
Population without health insurance coverage in 2000: 16%
Children under 18 without health insurance coverage in 2000: 14%
Short term general hospital admissions per 100,000 population in 2004: 6,822
Short term general hospital beds per 100,000 population in 2004: 123
Emergency room visits per 100,000 population in 2004: 32,701
General practice office based MDs per 100,000 population in 2005: 1,523
Medical specialist MDs per 100,000 population in 2005: 863
Dentists per 100,000 population in 1998: 5
Total births per 100,000 population, July 2005 - July 2006 : 10
Total deaths per 100,000 population, July 2005 - July 2006: 47
Limited-service eating places per 100,000 population in 2005 : 9
Homicides per 1,000,000 population from 2000 to 2006: 59.6. This is less than state average.
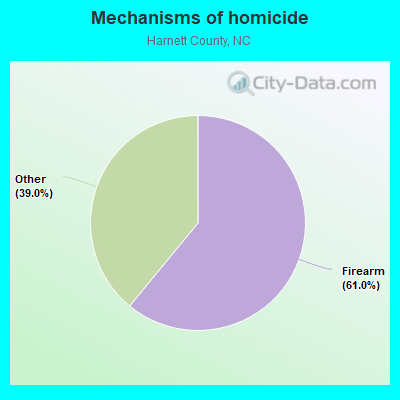
- Firearm - 36.4
- Other - 23.3
Suicides per 1,000,000 population from 2000 to 2006: 101.8. This is less than state average.
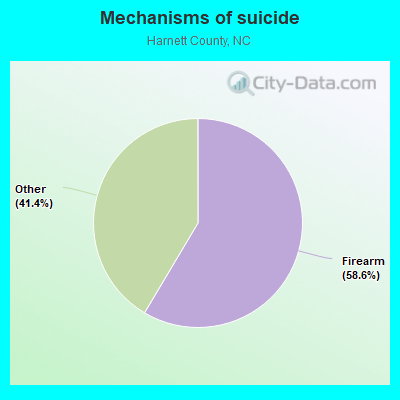
- Firearm - 59.6
- Other - 42.2
Household type by relationship:
Households: 138,832- Male householders: 26,299 (6,915 living alone), Female householders: 24,285 (5,144 living alone)
25,645 spouses (25,508 opposite-sex spouses), 3,530 unmarried partners, (3,519 opposite-sex unmarried partners), 43,455 children (41,128 natural, 264 adopted, 2,063 stepchildren), 2,346 grandchildren, 2,329 brothers or sisters, 2,283 parents, 380 foster children, 2,185 other relatives, 3,026 non-relatives
- In group quarters: 3,069
Size of family households: 16,305 2-persons, 7,801 3-persons, 6,025 4-persons, 4,157 5-persons, 564 6-persons, 745 7-or-more-persons.
Size of nonfamily households: 12,059 1-person, 2,446 2-persons, 482 3-persons.
22,182 married couples with children.
9,570 single-parent households (1,674 men, 7,896 women).
87.9% of residents of Harnett speak English at home.
9.6% of residents speak Spanish at home (69% speak English very well, 14% speak English well, 12% speak English not well, 5% don't speak English at all).
1.2% of residents speak other Indo-European language at home (87% speak English very well, 9% speak English well, 4% speak English not well).
0.7% of residents speak Asian or Pacific Island language at home (56% speak English very well, 21% speak English well, 22% speak English not well).
0.2% of residents speak other language at home (82% speak English very well, 18% speak English well).
In fiscal year 2004:
Federal Government expenditure: $470,052,000 ($4,629 per capita)
Department of Defense expenditure: $90,383,000
Federal direct payments to individuals for retirement and disability: $187,088,000
Federal other direct payments to individuals: $89,490,000
Federal direct payments not to individuals: $6,075,000
Federal grants: $99,374,000
Federal procurement contracts: $70,534,000 ($65,047,000 Department of Defense)
Federal salaries and wages: $17,491,000 ($10,398,000 Department of Defense)
Federal Government direct loans: $336,000
Federal guaranteed/insured loans: $104,094,000
Federal Government insurance: $47,591,000
Population change from April 1, 2000 to July 1, 2005:
Births: 7,619| Here: | 73 per 1000 residents |
| State: | 72 per 1000 residents |
Deaths: 4,008
| Here: | 39 per 1000 residents |
| State: | 44 per 1000 residents |
Net international migration: +1,468
| Here: | +14 per 1000 residents |
| State: | +18 per 1000 residents |
Net internal migration: +7,689
| Here: | +74 per 1000 residents |
| State: | +27 per 1000 residents |
Total withdrawal of fresh water for public supply: 10.00 millions of gallons per day (3% from ground, 97% from surface)
| Here: | 6.4 |
| State: | 6.4 |
| Here: | 4.8 |
| State: | 4.4 |
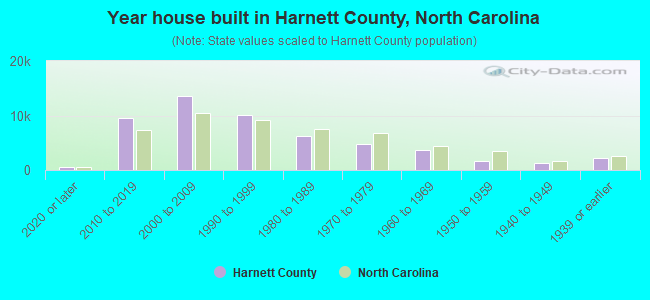
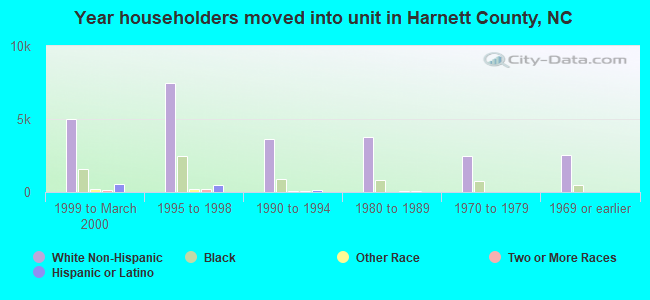
- Year house built in Harnett County, North Carolina
- 1,9662020 or later
- 11,9582010 to 2019
- 12,1692000 to 2009
- 8,9981990 to 1999
- 4,4271980 to 1989
- 5,3411970 to 1979
- 3,2681960 to 1969
- 3,3091950 to 1959
- 1,2691940 to 1949
- 2,2201939 or earlier
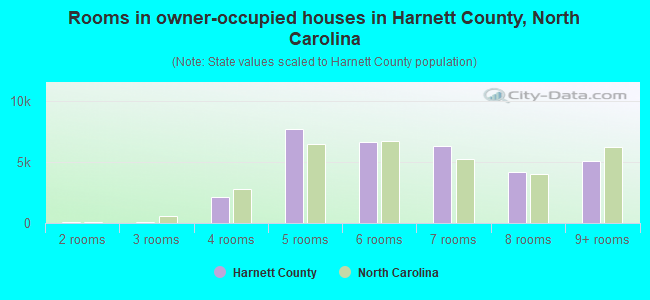
- Rooms in owner-occupied houses in Harnett County, North Carolina
- 01 room
- 02 rooms
- 2073 rooms
- 1,8614 rooms
- 7,5775 rooms
- 9,2866 rooms
- 7,0897 rooms
- 5,7498 rooms
- 5,0529+ rooms
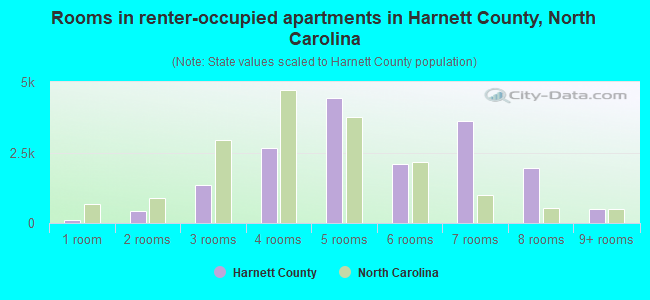
- Rooms in renter-occupied apartments in Harnett County, North Carolina
- 3481 room
- 4722 rooms
- 1,5083 rooms
- 3,3814 rooms
- 3,8745 rooms
- 1,9016 rooms
- 1,0087 rooms
- 6828 rooms
- 5899+ rooms
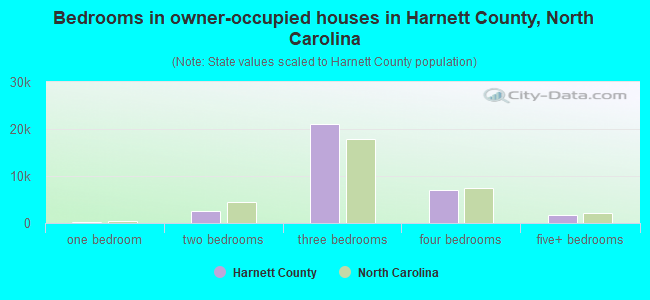
- Bedrooms in owner-occupied houses in Harnett County, North Carolina
- 0no bedroom
- 1071 bedroom
- 3,2222 bedrooms
- 23,6223 bedrooms
- 8,2474 bedrooms
- 1,6235+ bedrooms
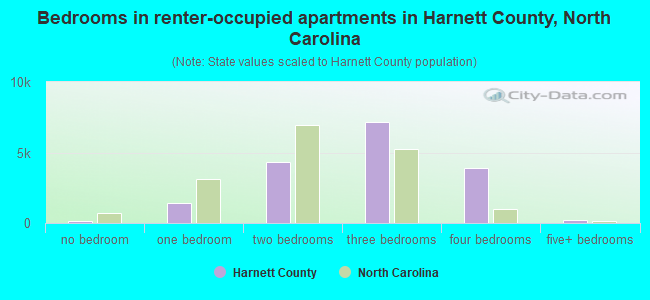
- Bedrooms in renter-occupied apartments in Harnett County, North Carolina
- 348no bedroom
- 1,2031 bedroom
- 4,8702 bedrooms
- 5,0963 bedrooms
- 2,0684 bedrooms
- 1785+ bedrooms
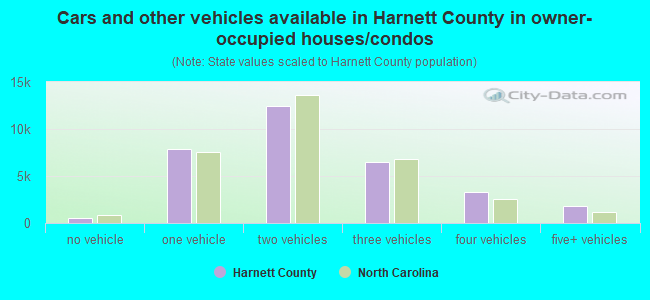
- Cars and other vehicles available in Harnett County in owner-occupied houses/condos
- 566no vehicle
- 8,6601 vehicle
- 14,9582 vehicles
- 7,6233 vehicles
- 2,6724 vehicles
- 2,3425+ vehicles
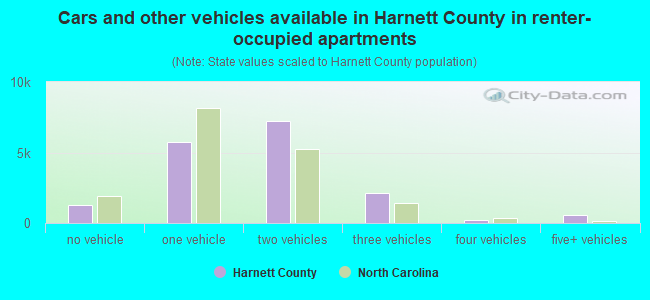
- Cars and other vehicles available in Harnett County in renter-occupied apartments
- 1,052no vehicle
- 5,2581 vehicle
- 5,1762 vehicles
- 1,9153 vehicles
- 2074 vehicles
- 1555+ vehicles
84.4% of Harnett County residents lived in the same house 1 years ago.
Out of people who lived in different houses, 26% lived in this county.
Out of people who lived in different counties, 65% lived in North Carolina.
| Harnett County: | 84.4% |
| State average: | 87.3% |
Place of birth for U.S.-born residents:
- This state: 72,963
- Other state: 51,477
- Northeast: 18,231
- Midwest: 7,674
- South: 19,554
- West: 6,018
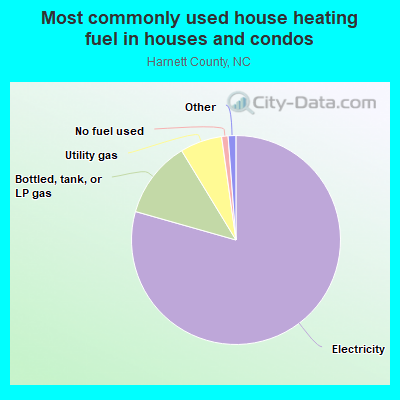
- 79.8%Electricity
- 11.6%Bottled, tank, or LP gas
- 6.6%Utility gas
- 0.8%No fuel used
- 0.4%Wood
- 0.3%Other fuel
- 0.2%Solar energy
- 0.2%Fuel oil, kerosene, etc.
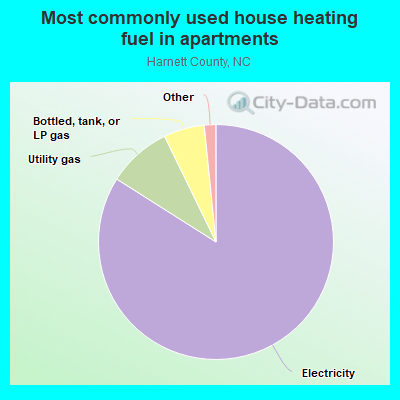
- 84.5%Electricity
- 8.7%Utility gas
- 5.0%Bottled, tank, or LP gas
- 0.9%No fuel used
- 0.7%Fuel oil, kerosene, etc.
- 0.2%Other fuel
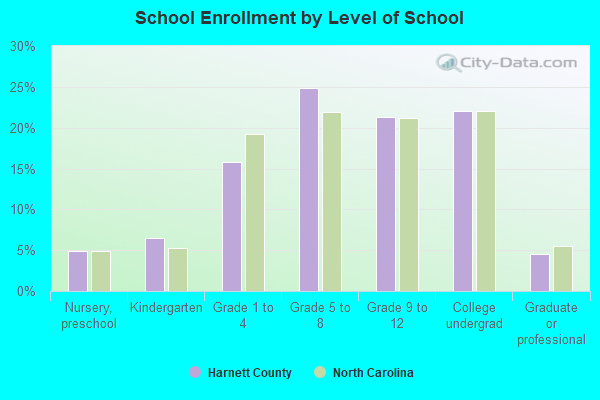
Private vs. public school enrollment:
| Here: | 17.2% |
| North Carolina: | 13.8% |
| Here: | 16.0% |
| North Carolina: | 11.9% |
| Here: | 37.2% |
| North Carolina: | 19.3% |
Harnett County government finances - Expenditure in 2020:
- Bond Funds - Cash and Securities: $1,691,000
- Charges - Hospital Public: $90,546,000
Hospital Public: $86,348,000
Elementary and Secondary Education School Lunch: $2,202,000
Elementary and Secondary Education School Lunch: $1,641,000
Elementary and Secondary Education - Other: $142,000
Elementary and Secondary Education - Other: $66,000
Other: $31,000
Elementary and Secondary Education School Tuition and Transportation: $20,000
Elementary and Secondary Education School Tuition and Transportation: $19,000
- Construction - Hospitals: $1,332,000
Hospitals: $687,000
Elementary and Secondary Education: $302,000
Elementary and Secondary Education: $26,000
- Current Operations - Elementary and Secondary Education: $182,504,000
Elementary and Secondary Education: $174,720,000
Hospitals: $95,030,000
Hospitals: $90,545,000
General - Other: $474,000
General - Other: $460,000
- Federal Intergovernmental - Health and Hospitals: $9,178,000
Health and Hospitals: $8,918,000
Education: $2,411,000
Education: $2,266,000
- General - Interest on Debt: $13,399,000
Interest on Debt: $8,228,000
- Intergovernmental to Local - Other - Elementary and Secondary Education: $1,189,000
Other - Elementary and Secondary Education: $1,030,000
- Long Term Debt - Beginning Outstanding - Unspecified Public Purpose: $277,195,000
Outstanding Unspecified Public Purpose: $259,842,000
Outstanding Unspecified Public Purpose: $246,628,000
Beginning Outstanding - Unspecified Public Purpose: $243,115,000
Issue, Unspecified Public Purpose: $21,145,000
Retired Unspecified Public Purpose: $17,633,000
Retired Unspecified Public Purpose: $17,352,000
Beginning Outstanding - Public Debt for Private Purpose: $1,870,000
Retired Nonguaranteed - Public Debt for Private Purpose: $1,250,000
Outstanding Nonguaranteed - Industrial Revenue: $620,000
- Miscellaneous - General Revenue - Other: $6,709,000
General Revenue - Other: $3,166,000
Interest Earnings: $382,000
Fines and Forfeits: $293,000
Interest Earnings: $288,000
Fines and Forfeits: $275,000
Sale of Property: $29,000
- Other Capital Outlay - Elementary and Secondary Education: $4,046,000
Elementary and Secondary Education: $3,521,000
Hospitals: $1,134,000
Hospitals: $811,000
- Other Funds - Cash and Securities: $28,717,000
Cash and Securities: $25,744,000
- Sinking Funds - Cash and Securities: $620,000
- State Intergovernmental - Education: $157,084,000
Education: $144,389,000
- Tax - Property: $24,999,000
Property: $23,643,000
Other: $584,000
Other: $469,000
- Total Salaries and Wages: $155,355,000
: $148,678,000
Harnett County government finances - Revenue in 2020:
- Bond Funds - Cash and Securities: $1,691,000
- Charges - Hospital Public: $90,546,000
Hospital Public: $86,348,000
Elementary and Secondary Education School Lunch: $2,202,000
Elementary and Secondary Education School Lunch: $1,641,000
Elementary and Secondary Education - Other: $142,000
Elementary and Secondary Education - Other: $66,000
Other: $31,000
Elementary and Secondary Education School Tuition and Transportation: $20,000
Elementary and Secondary Education School Tuition and Transportation: $19,000
- Construction - Hospitals: $1,332,000
Hospitals: $687,000
Elementary and Secondary Education: $302,000
Elementary and Secondary Education: $26,000
- Current Operations - Elementary and Secondary Education: $182,504,000
Elementary and Secondary Education: $174,720,000
Hospitals: $95,030,000
Hospitals: $90,545,000
General - Other: $474,000
General - Other: $460,000
- Federal Intergovernmental - Health and Hospitals: $9,178,000
Health and Hospitals: $8,918,000
Education: $2,411,000
Education: $2,266,000
- General - Interest on Debt: $13,399,000
Interest on Debt: $8,228,000
- Intergovernmental to Local - Other - Elementary and Secondary Education: $1,189,000
Other - Elementary and Secondary Education: $1,030,000
- Long Term Debt - Beginning Outstanding - Unspecified Public Purpose: $277,195,000
Outstanding Unspecified Public Purpose: $259,842,000
Outstanding Unspecified Public Purpose: $246,628,000
Beginning Outstanding - Unspecified Public Purpose: $243,115,000
Issue, Unspecified Public Purpose: $21,145,000
Retired Unspecified Public Purpose: $17,633,000
Retired Unspecified Public Purpose: $17,352,000
Beginning Outstanding - Public Debt for Private Purpose: $1,870,000
Retired Nonguaranteed - Public Debt for Private Purpose: $1,250,000
Outstanding Nonguaranteed - Industrial Revenue: $620,000
- Miscellaneous - General Revenue - Other: $6,709,000
General Revenue - Other: $3,166,000
Interest Earnings: $382,000
Fines and Forfeits: $293,000
Interest Earnings: $288,000
Fines and Forfeits: $275,000
Sale of Property: $29,000
- Other Capital Outlay - Elementary and Secondary Education: $4,046,000
Elementary and Secondary Education: $3,521,000
Hospitals: $1,134,000
Hospitals: $811,000
- Other Funds - Cash and Securities: $28,717,000
Cash and Securities: $25,744,000
- Sinking Funds - Cash and Securities: $620,000
- State Intergovernmental - Education: $157,084,000
Education: $144,389,000
- Tax - Property: $24,999,000
Property: $23,643,000
Other: $584,000
Other: $469,000
- Total Salaries and Wages: $155,355,000
: $148,678,000
Harnett County government finances - Debt in 2020:
- Bond Funds - Cash and Securities: $1,691,000
- Charges - Hospital Public: $90,546,000
Hospital Public: $86,348,000
Elementary and Secondary Education School Lunch: $2,202,000
Elementary and Secondary Education School Lunch: $1,641,000
Elementary and Secondary Education - Other: $142,000
Elementary and Secondary Education - Other: $66,000
Other: $31,000
Elementary and Secondary Education School Tuition and Transportation: $20,000
Elementary and Secondary Education School Tuition and Transportation: $19,000
- Construction - Hospitals: $1,332,000
Hospitals: $687,000
Elementary and Secondary Education: $302,000
Elementary and Secondary Education: $26,000
- Current Operations - Elementary and Secondary Education: $182,504,000
Elementary and Secondary Education: $174,720,000
Hospitals: $95,030,000
Hospitals: $90,545,000
General - Other: $474,000
General - Other: $460,000
- Federal Intergovernmental - Health and Hospitals: $9,178,000
Health and Hospitals: $8,918,000
Education: $2,411,000
Education: $2,266,000
- General - Interest on Debt: $13,399,000
Interest on Debt: $8,228,000
- Intergovernmental to Local - Other - Elementary and Secondary Education: $1,189,000
Other - Elementary and Secondary Education: $1,030,000
- Long Term Debt - Beginning Outstanding - Unspecified Public Purpose: $277,195,000
Outstanding Unspecified Public Purpose: $259,842,000
Outstanding Unspecified Public Purpose: $246,628,000
Beginning Outstanding - Unspecified Public Purpose: $243,115,000
Issue, Unspecified Public Purpose: $21,145,000
Retired Unspecified Public Purpose: $17,633,000
Retired Unspecified Public Purpose: $17,352,000
Beginning Outstanding - Public Debt for Private Purpose: $1,870,000
Retired Nonguaranteed - Public Debt for Private Purpose: $1,250,000
Outstanding Nonguaranteed - Industrial Revenue: $620,000
- Miscellaneous - General Revenue - Other: $6,709,000
General Revenue - Other: $3,166,000
Interest Earnings: $382,000
Fines and Forfeits: $293,000
Interest Earnings: $288,000
Fines and Forfeits: $275,000
Sale of Property: $29,000
- Other Capital Outlay - Elementary and Secondary Education: $4,046,000
Elementary and Secondary Education: $3,521,000
Hospitals: $1,134,000
Hospitals: $811,000
- Other Funds - Cash and Securities: $28,717,000
Cash and Securities: $25,744,000
- Sinking Funds - Cash and Securities: $620,000
- State Intergovernmental - Education: $157,084,000
Education: $144,389,000
- Tax - Property: $24,999,000
Property: $23,643,000
Other: $584,000
Other: $469,000
- Total Salaries and Wages: $155,355,000
: $148,678,000
Harnett County government finances - Cash and Securities in 2020:
- Bond Funds - Cash and Securities: $1,691,000
- Charges - Hospital Public: $90,546,000
Hospital Public: $86,348,000
Elementary and Secondary Education School Lunch: $2,202,000
Elementary and Secondary Education School Lunch: $1,641,000
Elementary and Secondary Education - Other: $142,000
Elementary and Secondary Education - Other: $66,000
Other: $31,000
Elementary and Secondary Education School Tuition and Transportation: $20,000
Elementary and Secondary Education School Tuition and Transportation: $19,000
- Construction - Hospitals: $1,332,000
Hospitals: $687,000
Elementary and Secondary Education: $302,000
Elementary and Secondary Education: $26,000
- Current Operations - Elementary and Secondary Education: $182,504,000
Elementary and Secondary Education: $174,720,000
Hospitals: $95,030,000
Hospitals: $90,545,000
General - Other: $474,000
General - Other: $460,000
- Federal Intergovernmental - Health and Hospitals: $9,178,000
Health and Hospitals: $8,918,000
Education: $2,411,000
Education: $2,266,000
- General - Interest on Debt: $13,399,000
Interest on Debt: $8,228,000
- Intergovernmental to Local - Other - Elementary and Secondary Education: $1,189,000
Other - Elementary and Secondary Education: $1,030,000
- Long Term Debt - Beginning Outstanding - Unspecified Public Purpose: $277,195,000
Outstanding Unspecified Public Purpose: $259,842,000
Outstanding Unspecified Public Purpose: $246,628,000
Beginning Outstanding - Unspecified Public Purpose: $243,115,000
Issue, Unspecified Public Purpose: $21,145,000
Retired Unspecified Public Purpose: $17,633,000
Retired Unspecified Public Purpose: $17,352,000
Beginning Outstanding - Public Debt for Private Purpose: $1,870,000
Retired Nonguaranteed - Public Debt for Private Purpose: $1,250,000
Outstanding Nonguaranteed - Industrial Revenue: $620,000
- Miscellaneous - General Revenue - Other: $6,709,000
General Revenue - Other: $3,166,000
Interest Earnings: $382,000
Fines and Forfeits: $293,000
Interest Earnings: $288,000
Fines and Forfeits: $275,000
Sale of Property: $29,000
- Other Capital Outlay - Elementary and Secondary Education: $4,046,000
Elementary and Secondary Education: $3,521,000
Hospitals: $1,134,000
Hospitals: $811,000
- Other Funds - Cash and Securities: $28,717,000
Cash and Securities: $25,744,000
- Sinking Funds - Cash and Securities: $620,000
- State Intergovernmental - Education: $157,084,000
Education: $144,389,000
- Tax - Property: $24,999,000
Property: $23,643,000
Other: $584,000
Other: $469,000
- Total Salaries and Wages: $155,355,000
: $148,678,000
Supplemental Security Income (SSI) in 2006:
- Total number of recipients: 2,568
- Number of aged recipients: 311
- Number of blind and disabled recipients: 2,257
- Number of recipients under 18: 495
- Number of recipients between 18 and 64: 1,421
- Number of recipients older than 64: 652
- Number of recipients also receiving OASDI: 1,108
- Amount of payments (thousands of dollars): 1,075
| Most common first names in Harnett County, NC among deceased individuals | ||
| Name | Count | Lived (average) |
|---|---|---|
| James | 627 | 69.8 years |
| William | 479 | 71.1 years |
| Mary | 409 | 76.7 years |
| John | 395 | 72.6 years |
| Robert | 209 | 70.7 years |
| George | 174 | 72.0 years |
| Annie | 173 | 77.2 years |
| Charles | 168 | 65.5 years |
| Joseph | 150 | 71.1 years |
| Willie | 148 | 71.9 years |
| Most common last names in Harnett County, NC among deceased individuals | ||
| Last name | Count | Lived (average) |
|---|---|---|
| Smith | 380 | 73.0 years |
| Johnson | 369 | 74.4 years |
| Lee | 272 | 72.8 years |
| Williams | 271 | 72.8 years |
| Jackson | 237 | 74.2 years |
| Matthews | 221 | 75.6 years |
| Byrd | 214 | 75.0 years |
| Stewart | 207 | 75.3 years |
| Mclean | 201 | 71.5 years |
| Mcneill | 186 | 70.7 years |
| Businesses in Harnett County, NC | ||||
| Name | Count | Name | Count | |
|---|---|---|---|---|
| ALDI | 1 | Lane Furniture | 1 | |
| AT&T | 2 | Little Caesars Pizza | 1 | |
| Ace Hardware | 1 | Lowe's | 1 | |
| Advance Auto Parts | 3 | MasterBrand Cabinets | 3 | |
| Applebee's | 1 | McDonald's | 4 | |
| Arby's | 2 | Microtel | 1 | |
| AutoZone | 3 | Nike | 5 | |
| Baskin-Robbins | 1 | Payless | 1 | |
| Blockbuster | 1 | Penske | 1 | |
| Burger King | 4 | Pizza Hut | 3 | |
| CVS | 3 | Quality | 2 | |
| Chevrolet | 3 | Quiznos | 2 | |
| Chick-Fil-A | 1 | RadioShack | 3 | |
| Comfort Inn | 2 | Rite Aid | 2 | |
| Cracker Barrel | 1 | Ruby Tuesday | 1 | |
| Cricket Wireless | 2 | SAS Shoes | 1 | |
| Curves | 2 | SONIC Drive-In | 1 | |
| Dairy Queen | 3 | Sears | 2 | |
| Domino's Pizza | 2 | Sprint Nextel | 3 | |
| Dunkin Donuts | 4 | Staples | 1 | |
| FedEx | 9 | Starbucks | 1 | |
| Ford | 3 | Subway | 7 | |
| GNC | 1 | Super 8 | 1 | |
| GameStop | 2 | T-Mobile | 5 | |
| H&R Block | 4 | Taco Bell | 2 | |
| Hardee's | 2 | True Value | 1 | |
| Hilton | 1 | U-Haul | 11 | |
| Home Depot | 1 | U.S. Cellular | 1 | |
| Jimmy John's | 4 | UPS | 15 | |
| Jones New York | 3 | Verizon Wireless | 1 | |
| KFC | 3 | Waffle House | 3 | |
| Kohl's | 1 | Walgreens | 1 | |
| Kroger | 1 | Walmart | 2 | |
| La-Z-Boy | 1 | Wendy's | 2 | |
Harnett County on our top lists:
- #23 on the list of "Top 101 counties with the largest number of people moving in compared to moving out (pop. 50,000+)"
- #25 on the list of "Top 101 counties with the highest percentage of residents relocating from other counties between 2010 and 2011 (pop. 50,000+)"
- #36 on the list of "Top 101 counties with the highest percentage of residents relocating from foreign countries between 2010 and 2011 (pop. 50,000+)"
- #52 on the list of "Top 101 counties with the smallest number of people without health insurance coverage in 2000 (pop. 50,000+)"
- #53 on the list of "Top 101 counties with the highest percentage of residents relocating to foreign countries in 2011 (pop. 50,000+)"
- #58 on the list of "Top 101 counties with the highest percentage of residents relocating from foreign countries between 2010 and 2011"
- #67 on the list of "Top 101 counties with the highest percentage of residents relocating from other counties between 2010 and 2011"
- #70 on the list of "Top 101 counties with the highest percentage of residents relocating to other counties in 2011 (pop. 50,000+)"
- #77 on the list of "Top 101 counties with the highest percentage of residents relocating to foreign countries in 2011"
- #88 on the list of "Top 101 counties with the lowest ground withdrawal of fresh water for public supply (pop. 50,000+)"