Hoke County, North Carolina (NC)
County owner-occupied free and clear houses and condos in 2010: 2,751
County owner-occupied houses and condos in 2000: 8,531
Renter-occupied apartments: 4,846 (it was 2,842 in 2000)
| % of renters here: | 25% |
| State: | 33% |
Land area: 391 sq. mi.
Water area: 1.1 sq. mi.
Population density: 137 people per square mile (average).
Industries providing employment: Educational, health and social services (25.6%), Retail trade (13.0%), Professional, scientific, management, administrative, and waste management services (11.6%), Manufacturing (11.0%).
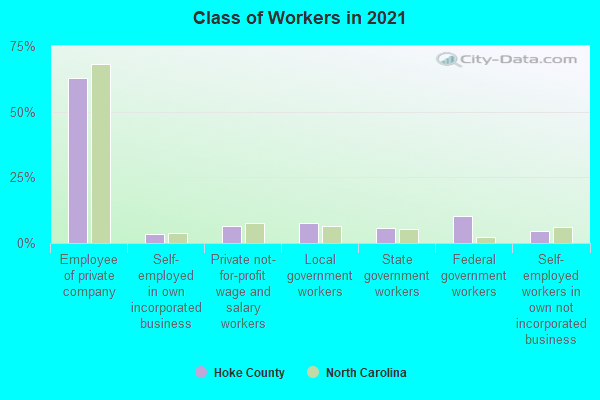
Type of workers:
- Private wage or salary: 63%
- Government: 32%
- Self-employed, not incorporated: 4%
- Unpaid family work: 0%
- OSM Map
- General Map
- Google Map
- MSN Map

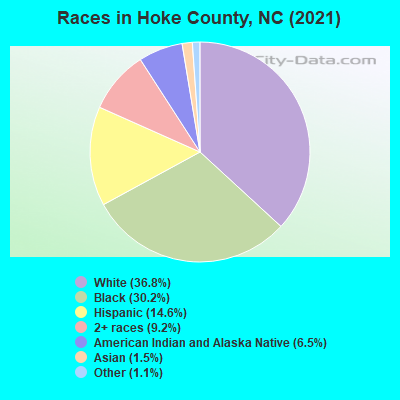
- 19,99336.9%White Non-Hispanic Alone
- 17,02331.4%Black Non-Hispanic Alone
- 8,22815.2%Hispanic or Latino
- 3,8477.1%Two or more races
- 3,6746.8%American Indian and Alaska Native alone
- 7681.4%Asian alone
- 6241.2%Some other race alone
- 530.10%Native Hawaiian and Other
Pacific Islander alone
| Median resident age: | 33.6 years |
| North Carolina median age: | 39.2 years |
| Males: 26,515 | |
| Females: 27,246 |

 | 2022 NC County Census Estimates (110 replies) |
| Why is Fayetteville treated like it does not exist? (162 replies) |
| Moving to Raeford (28 replies) |
| move to Fayetteville NC (14 replies) |
| Fayetteville, North Carolina (22 replies) |
| Are some of NC's rural blue counties truly "Liberal"? (20 replies) |
| Hoke County: | 2.0 people |
| North Carolina: | 2 people |
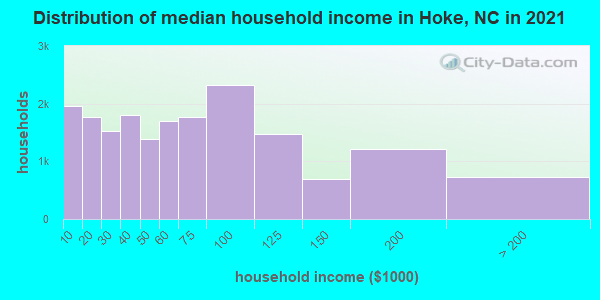
Estimated median household income in 2022: $58,259 ($33,230 in 1999)
| This county: | $58,259 |
| North Carolina: | $67,481 |
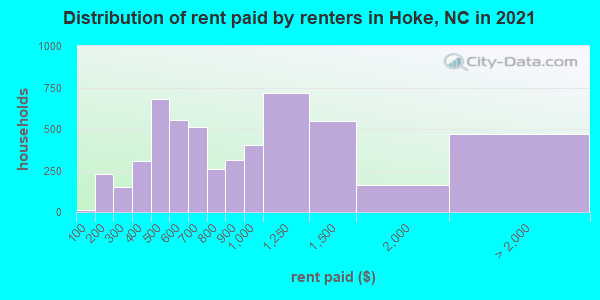
Median contract rent in 2022 for apartments: $772 (lower quartile is $546, upper quartile is $1,244)
| This county: | $772 |
| State: | $945 |
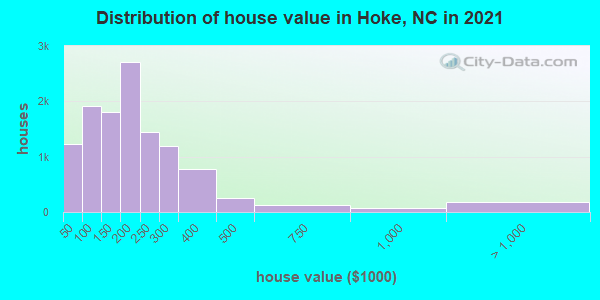
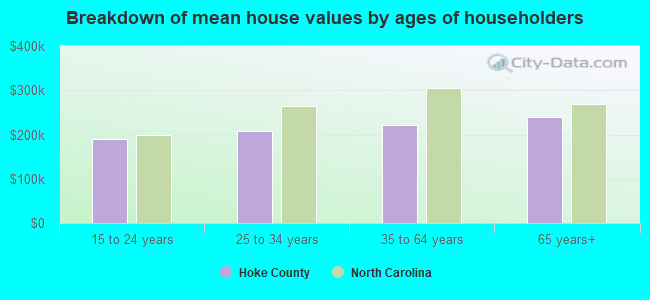
Estimated median house or condo value in 2022: $212,033 (it was $70,700 in 2000)
| Hoke: | $212,033 |
| North Carolina: | $280,600 |
Median monthly housing costs for homes and condos with a mortgage: $1,326
Median monthly housing costs for units without a mortgage: $427
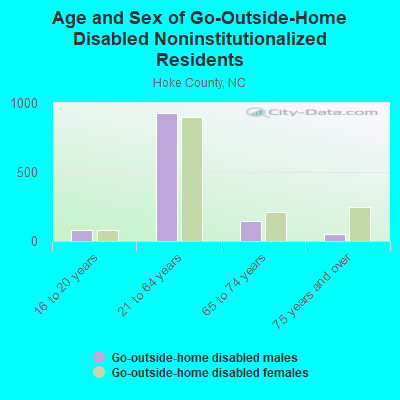
Institutionalized population: 595
Crime in 2018 (reported by the sheriff's office or county police, not the county total):
- Murders: 1
- Rapes: 0
- Robberies: 8
- Assaults: 12
- Burglaries: 331
- Thefts: 531
- Auto thefts: 81
Crime in 2017 (reported by the sheriff's office or county police, not the county total):
- Murders: 6
- Rapes: 3
- Robberies: 14
- Assaults: 55
- Burglaries: 445
- Thefts: 558
- Auto thefts: 42
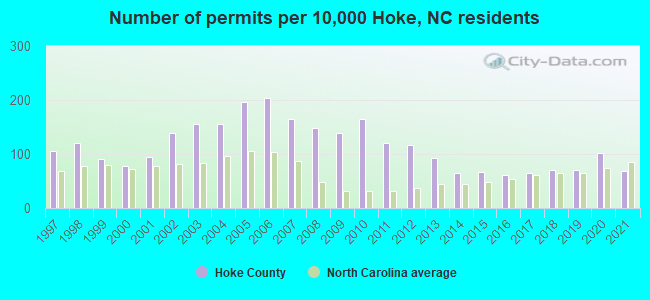
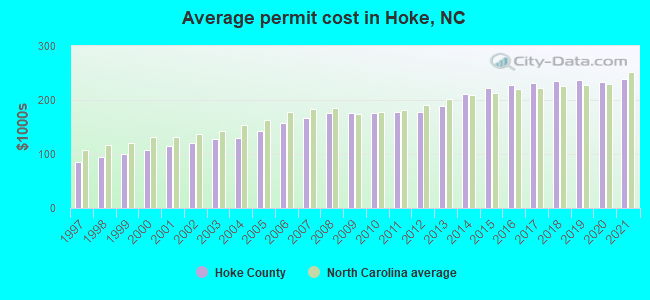
Single-family new house construction building permits:
- 2022: 348 buildings, average cost: $258,700
- 2021: 231 buildings, average cost: $237,600
- 2020: 339 buildings, average cost: $234,200
- 2019: 236 buildings, average cost: $237,100
- 2018: 240 buildings, average cost: $235,200
- 2017: 219 buildings, average cost: $230,600
- 2016: 210 buildings, average cost: $227,400
- 2015: 225 buildings, average cost: $223,300
- 2014: 219 buildings, average cost: $212,200
- 2013: 314 buildings, average cost: $188,800
- 2012: 394 buildings, average cost: $177,500
- 2011: 406 buildings, average cost: $177,300
- 2010: 555 buildings, average cost: $176,000
- 2009: 468 buildings, average cost: $176,400
- 2008: 502 buildings, average cost: $176,100
- 2007: 554 buildings, average cost: $166,900
- 2006: 686 buildings, average cost: $158,100
- 2005: 660 buildings, average cost: $141,600
- 2004: 523 buildings, average cost: $130,100
- 2003: 523 buildings, average cost: $127,500
- 2002: 467 buildings, average cost: $120,100
- 2001: 318 buildings, average cost: $115,000
- 2000: 261 buildings, average cost: $107,100
- 1999: 302 buildings, average cost: $100,100
- 1998: 406 buildings, average cost: $94,700
- 1997: 354 buildings, average cost: $85,200
Median real estate property taxes paid for housing units with mortgages in 2022: $1,496 (0.6%)
Median real estate property taxes paid for housing units with no mortgage in 2022: $864 (0.6%)
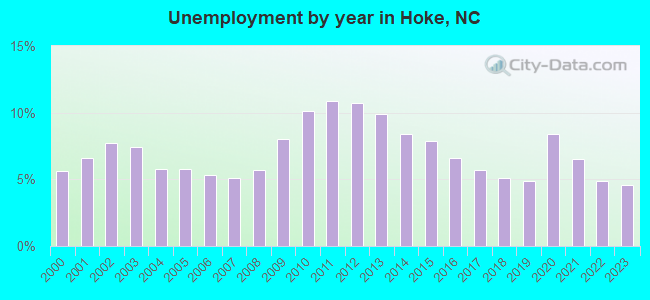
| Hoke County: | 16.5% |
| North Carolina: | 12.8% |
Median age of residents in 2022: 33.6 years old
(Males: 32.9 years old, Females: 34.7 years old)
(Median age for: White residents: 34.6 years old, Black residents: 38.4 years old, American Indian residents: 36.8 years old, Asian residents: 38.8 years old, Hispanic or Latino residents: 26.4 years old, Other race residents: 29.3 years old)
Fair market rent in 2006 for a 1-bedroom apartment in Hoke County is $490 a month.
Fair market rent for a 2-bedroom apartment is $543 a month.
Fair market rent for a 3-bedroom apartment is $743 a month.
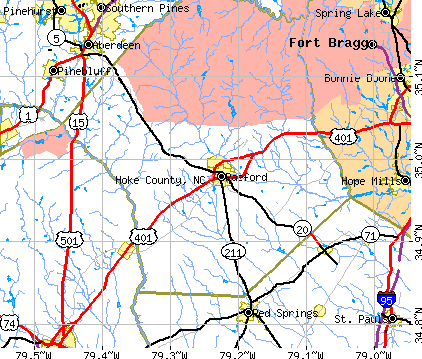
Cities in this county include: Raeford, Rockfish, Silver City, Ashley Heights, Five Points, Bowmore, Dundarrach.
Notable locations in this county outside city limits:
Notable locations in Hoke County: Twin Valley Country Club (A), White Store (B), Old Stanback Ferry (C), Old Smith Ferry (D). Display/hide their locations on the map
Churches in Hoke County include: Gum Springs Church (A), Hanna Church (B), Harmony Community Church (C), Hopewell Church (D), Jerusalem Church (E), Union Church (F), Long Pine Church (G), Bethel Church (H), Madison Grove Church (I). Display/hide their locations on the map
Cemeteries: Bennett Cemetery (1), Pine View Cemetery (2), Richmond-Sturdivant Cemetery (3). Display/hide their locations on the map
Lakes, reservoirs, and swamps: Gaddys Goose Ponds (A), Ingold Pond (B), City Pond (C), Blewett Falls Lake (D), Nelson Lake (E), Moran McLendon Pond (F), Crawford Lake (G), Concordia Farms Lake (H). Display/hide their locations on the map
Streams, rivers, and creeks: Flag Branch (A), Featherbed Branch (B), Dula Thoroughfare (C), Derita Creek (D), Deep Bottom Branch (E), Culpepper Creek (F), Cribs Creek (G), Cranes Branch (H), Childs Branch (I). Display/hide their locations on the map
Park in Hoke County: Pee Dee National Wildlife Refuge (1). Display/hide its location on the map
Neighboring counties: Anson County  , Anderson County, South Carolina , Cherokee County, South Carolina , Cabarrus County
  , Chesterfield County, South Carolina
  , Mecklenburg County .
| Here: | 4.2% |
| North Carolina: | 3.2% |
Current college students: 1,723
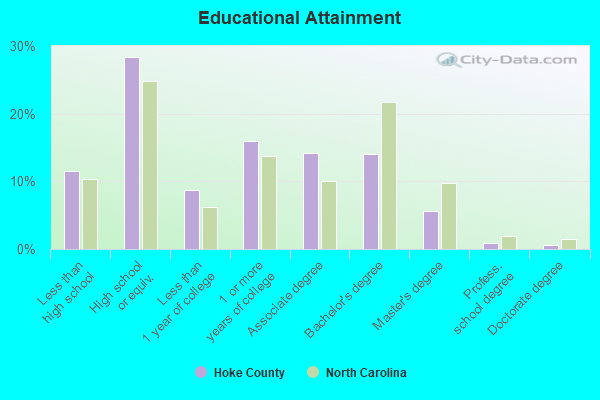
People 25 years of age or older with a high school degree or higher: 88.9%
People 25 years of age or older with a bachelor's degree or higher: 20.2%
Number of foreign born residents: 3,149 (45.1% naturalized citizens)
| Hoke County: | 5.9% |
| Whole state: | 8.6% |
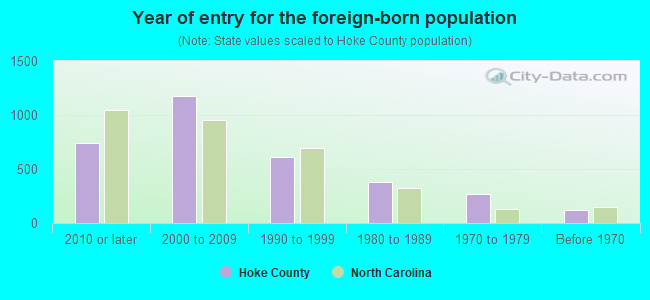
- Year of entry for the foreign-born population
- 7862010 or later
- 1,0122000 to 2009
- 5411990 to 1999
- 3831980 to 1989
- 2671970 to 1979
- 121Before 1970
Mean travel time to work (commute): minutes
Percentage of county residents living and working in this county: 98.0%
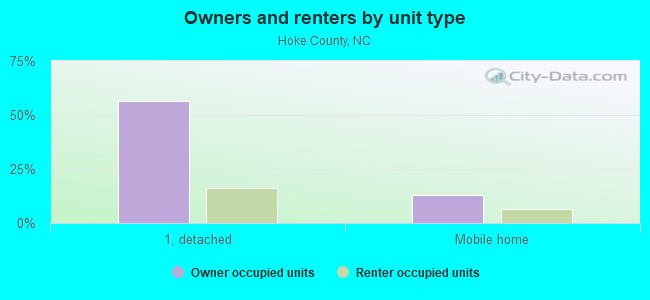
Housing units in structures:
- One, detached: 15,152
- One, attached: 61
- Two: 626
- 3 or 4: 223
- 5 to 9: 174
- 10 to 19: 45
- 20 to 49: 250
- 50 or more: 82
- Mobile homes: 4,123
Housing units in Hoke County with a mortgage: 8,923 (314 second mortgage, 5 home equity loan, 192 both second mortgage and home equity loan)
Houses without a mortgage: 96
| Here: | 7.7% with mortgage |
| State: | 97.0% with mortgage |
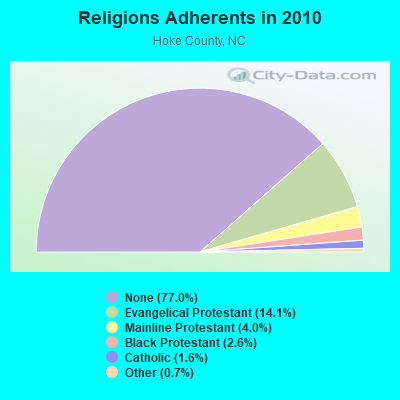
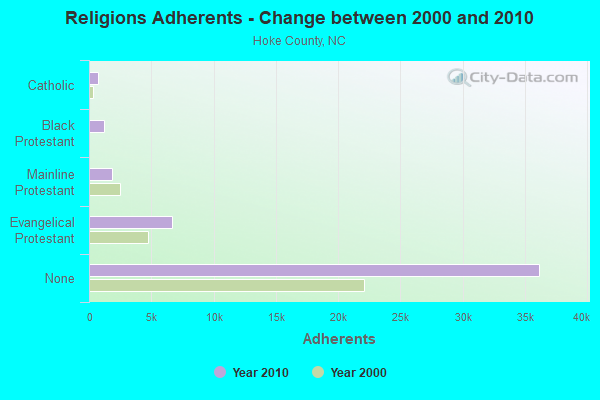
Religion statistics for Hoke County
| Religion | Adherents | Congregations |
|---|---|---|
| Evangelical Protestant | 6,634 | 32 |
| Mainline Protestant | 1,878 | 12 |
| Black Protestant | 1,229 | 5 |
| Catholic | 729 | 1 |
| Other | 311 | 2 |
| None | 36,171 | - |
Source: Clifford Grammich, Kirk Hadaway, Richard Houseal, Dale E.Jones, Alexei Krindatch, Richie Stanley and Richard H.Taylor. 2012. 2010 U.S.Religion Census: Religious Congregations & Membership Study. Association of Statisticians of American Religious Bodies. Jones, Dale E., et al. 2002. Congregations and Membership in the United States 2000. Nashville, TN: Glenmary Research Center.
Food Environment Statistics:
| Hoke County: | 1.90 / 10,000 pop. |
| State: | 2.05 / 10,000 pop. |
| This county: | 0.47 / 10,000 pop. |
| North Carolina: | 0.92 / 10,000 pop. |
| Hoke County: | 4.27 / 10,000 pop. |
| North Carolina: | 4.75 / 10,000 pop. |
| This county: | 1.66 / 10,000 pop. |
| State: | 7.57 / 10,000 pop. |
| Hoke County: | 10.8% |
| North Carolina: | 9.8% |
| Hoke County: | 32.7% |
| State: | 28.3% |
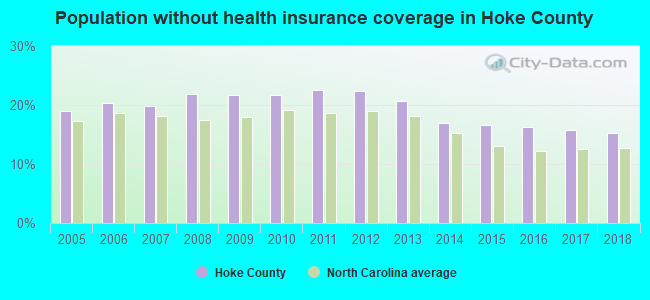
| Here: | 21.3% |
| State: | 15.6% |
Agriculture in Hoke County:
Average size of farms: 315 acresAverage value of agricultural products sold per farm: $221,436
Average value of crops sold per acre for harvested cropland: $285.03
The value of nursery, greenhouse, floriculture, and sod as a percentage of the total market value of agricultural products sold: 6.14%
The value of livestock, poultry, and their products as a percentage of the total market value of agricultural products sold: 76.34%
Average total farm production expenses per farm: $197,915
Harvested cropland as a percentage of land in farms: 58.32%
Irrigated harvested cropland as a percentage of land in farms: 6.05%
Average market value of all machinery and equipment per farm: $114,924
The percentage of farms operated by a family or individual: 86.07%
Average age of principal farm operators: 55 years
Average number of cattle and calves per 100 acres of all land in farms: 2.41
Corn for grain: 1469 harvested acres
All wheat for grain: 3896 harvested acres
Upland cotton: 21098 harvested acres
Soybeans for beans: 8801 harvested acres
Vegetables: 24 harvested acres
Land in orchards: 30 acres
Tornado activity:
Hoke County historical area-adjusted tornado activity is significantly below North Carolina state average. It is 9714023.5 times below overall U.S. average.Tornadoes in this county have caused 5 injuries recorded between 1950 and 2004.
On 5/15/1976, a category 2 (max. wind speeds 113-157 mph) tornado injured 4 people and caused between $5000 and $50,000 in damages.
Earthquake activity:
Hoke County-area historical earthquake activity is significantly above North Carolina state average. It is 48% smaller than the overall U.S. average.On 8/23/2011 at 17:51:04, a magnitude 5.8 (5.8 MW, Depth: 3.7 mi, Class: Moderate, Intensity: VI - VII) earthquake occurred 215.5 miles away from Hoke County center
On 8/9/2020 at 12:07:37, a magnitude 5.1 (5.1 MW, Depth: 4.7 mi) earthquake occurred 147.0 miles away from the county center
On 11/22/1974 at 05:25:55, a magnitude 4.7 (4.7 MB, Class: Light, Intensity: IV - V) earthquake occurred 152.6 miles away from the county center
On 8/2/1974 at 08:52:09, a magnitude 4.9 (4.3 MB, 4.9 LG) earthquake occurred 200.4 miles away from the county center
On 8/21/1992 at 16:31:55, a magnitude 4.4 (4.1 MB, 4.1 LG, 4.4 LG, Depth: 6.2 mi) earthquake occurred 142.3 miles away from Hoke County center
On 9/25/2006 at 05:44:20, a magnitude 3.7 (3.7 ML, Depth: 3.1 mi, Class: Light, Intensity: II - III) earthquake occurred 31.1 miles away from the county center
Magnitude types: regional Lg-wave magnitude (LG), body-wave magnitude (MB), local magnitude (ML), moment magnitude (MW)
Most recent natural disasters:
- North Carolina Covid-19 Pandemic, Incident Period: January 20, 2020, FEMA Id: 4487, Natural disaster type: Other
- North Carolina Hurricane Dorian, Incident Period: September 1, 2019 - September 9, 2019, FEMA Id: 4465, Natural disaster type: Hurricane
- North Carolina Hurricane Florence, Incident Period: September 7, 2018 - September 29, 2018, FEMA Id: 4393, Natural disaster type: Hurricane
- North Carolina Hurricane Matthew, Incident Period: October 04, 2016 to October 24, 2016, Emergency Declared EM-3380: October 07, 2016, FEMA Id: 3380, Natural disaster type: Hurricane
- North Carolina Hurricane Matthew, Incident Period: October 04, 2016 to October 24, 2016, Major Disaster (Presidential) Declared DR-4285: October 10, 2016, FEMA Id: 4285, Natural disaster type: Hurricane
- North Carolina Severe Storms, Tornadoes, and Flooding, Incident Period: April 16, 2011, Major Disaster (Presidential) Declared DR-1969: April 19, 2011, FEMA Id: 1969, Natural disaster type: Storm, Tornado, Flood
- North Carolina Hurricane Katrina Evacuation, Incident Period: August 29, 2005 to October 01, 2005, Emergency Declared EM-3222: September 05, 2005, FEMA Id: 3222, Natural disaster type: Hurricane
- North Carolina Tropical Storm Frances, Incident Period: September 07, 2004 to September 12, 2004, Major Disaster (Presidential) Declared DR-1546: September 10, 2004, FEMA Id: 1546, Natural disaster type: Tropical Storm
- North Carolina Winter Storm, Incident Period: January 24, 2000 to February 01, 2000, Major Disaster (Presidential) Declared DR-1312: January 31, 2000, FEMA Id: 1312, Natural disaster type: Winter Storm
- North Carolina Hurricane Floyd & Irene, Incident Period: September 15, 1999 to November 02, 1999, Major Disaster (Presidential) Declared DR-1292: September 16, 1999, FEMA Id: 1292, Natural disaster type: Hurricane
- 2 other natural disasters have been reported since 1953.
The number of natural disasters in Hoke County (12) is smaller than the US average (15).
Major Disasters (Presidential) Declared: 6
Emergencies Declared: 3
Causes of natural disasters: Hurricanes: 8, Flood: 1, Storm: 1, Tornado: 1, Tropical Storm: 1, Winter Storm: 1, Other: 1 (Note: some incidents may be assigned to more than one category).
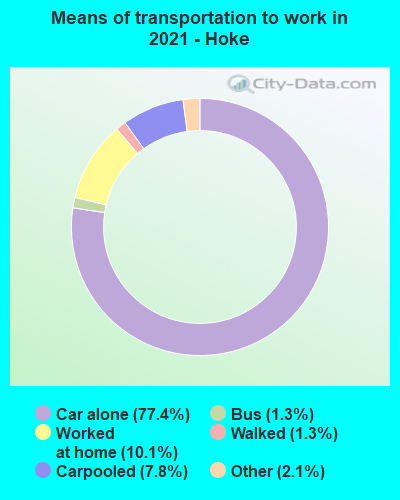
Means of transportation to work:
- Drove a car alone: 7,691 (69.9%)
- Carpooled: 921 (8.4%)
- Bus: 101 (0.9%)
- Taxicab, motorcycle, or other means: 211 (1.9%)
- Bicycle: 13 (0.1%)
- Walked: 150 (1.4%)
- Worked at home: 1,921 (17.5%)
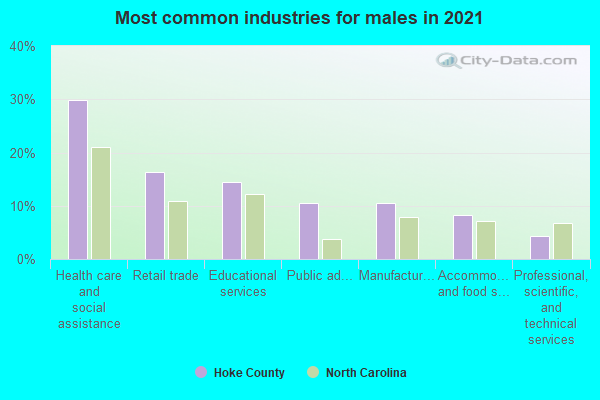
- Health care and social assistance (31%)
- Educational services (14%)
- Retail trade (13%)
- Public administration (10%)
- Accommodation and food services (9%)
- Manufacturing (7%)
- Professional, scientific, and technical services (5%)
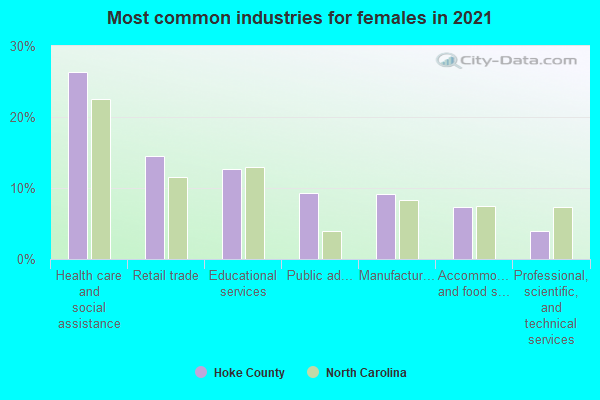
- Health care and social assistance (28%)
- Educational services (13%)
- Retail trade (12%)
- Public administration (9%)
- Accommodation and food services (8%)
- Manufacturing (7%)
- Professional, scientific, and technical services (5%)
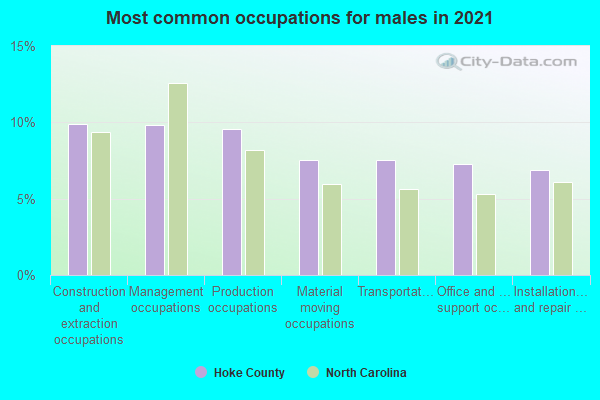
- Management occupations (11%)
- Material moving occupations (9%)
- Production occupations (9%)
- Construction and extraction occupations (8%)
- Installation, maintenance, and repair occupations (8%)
- Transportation occupations (7%)
- Sales and related occupations (7%)
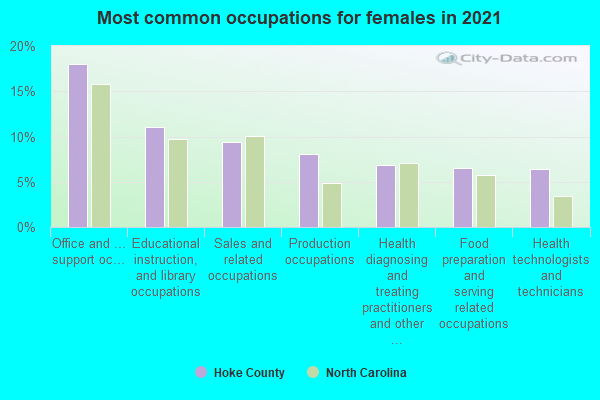
- Office and administrative support occupations (19%)
- Educational instruction, and library occupations (11%)
- Sales and related occupations (10%)
- Health diagnosing and treating practitioners and other technical occupations (8%)
- Food preparation and serving related occupations (7%)
- Healthcare support occupations (6%)
- Production occupations (5%)
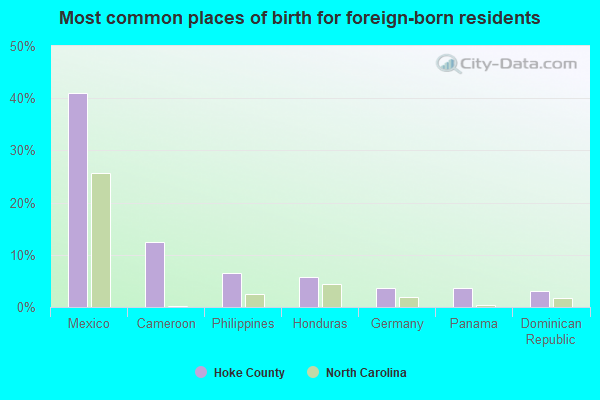
- Mexico (37%)
- Panama (7%)
- Philippines (5%)
- Vietnam (4%)
- Honduras (4%)
- Cameroon (3%)
- Germany (3%)
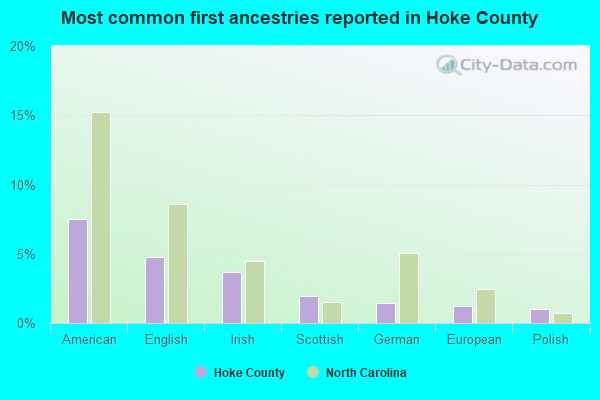
- American (7%)
- English (6%)
- Irish (3%)
- German (2%)
- Scottish (1%)
- African (1%)
- Polish (1%)
People in group quarters in Hoke County, North Carolina in 2010:
- 320 people in state prisons
- 133 people in local jails and other municipal confinement facilities
- 129 people in nursing facilities/skilled-nursing facilities
- 57 people in group homes intended for adults
- 13 people in residential treatment centers for juveniles (non-correctional)
- 9 people in college/university student housing
- 9 people in residential treatment centers for adults
People in group quarters in Hoke County, North Carolina in 2000:
- 916 people in state prisons
- 113 people in nursing homes
- 56 people in other nonhousehold living situations
- 24 people in local jails and other confinement facilities (including police lockups)
- 13 people in homes for the mentally retarded
- 2 people in college dormitories (includes college quarters off campus)
- 2 people in other noninstitutional group quarters
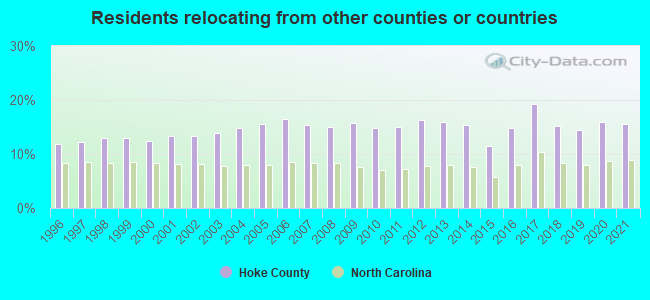
15.52% of this county's 2021 resident taxpayers lived in other counties in 2020 ($45,746 average adjusted gross income)
| Here: | 15.52% |
| North Carolina average: | 8.85% |
0.37% of residents moved from foreign countries ($1,235 average AGI)
Hoke County: 0.37% North Carolina average: 0.04%
8.80% relocated from other counties in North Carolina ($24,311 average AGI)
6.35% relocated from other states ($20,201 average AGI)
Hoke County: 6.35% North Carolina average: 4.18%
Top counties from which taxpayers relocated into this county between 2020 and 2021:
| from Cumberland County, NC | |
| from Robeson County, NC | |
| from Moore County, NC | |
| from Harnett County, NC | |
| from Scotland County, NC | |
| from Wake County, NC | |
| from Pierce County, WA |
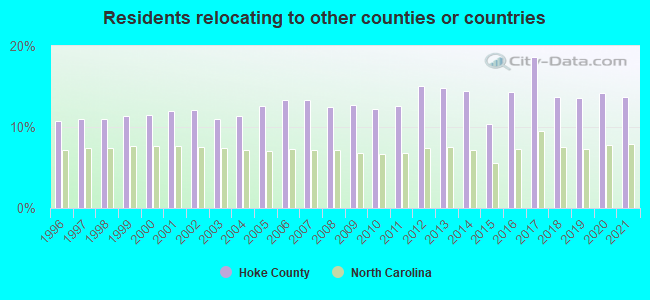
13.74% of this county's 2020 resident taxpayers moved to other counties in 2021 ($47,626 average adjusted gross income)
| Here: | 13.74% |
| North Carolina average: | 7.89% |
0.21% of residents moved to foreign countries ($994 average AGI)
Hoke County: 0.21% North Carolina average: 0.03%
7.92% relocated to other counties in North Carolina ($25,170 average AGI)
5.61% relocated to other states ($21,461 average AGI)
Hoke County: 5.61% North Carolina average: 3.18%
Top counties to which taxpayers relocated from this county between 2020 and 2021:
| to Cumberland County, NC | |
| to Moore County, NC | |
| to Robeson County, NC | |
| to Harnett County, NC | |
| to Wake County, NC | |
| to Montgomery County, TN | |
| to Scotland County, NC |
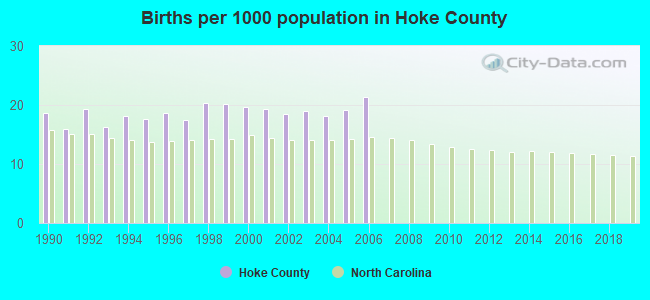
Births per 1000 population from 1990 to 1999: 18.3
Births per 1000 population from 2000 to 2006: 19.3
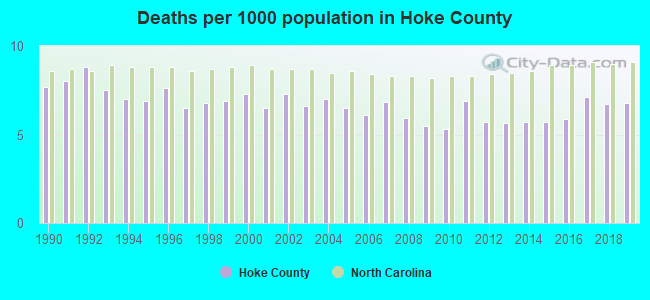
Deaths per 1000 population from 1990 to 1999: 7.4
Deaths per 1000 population from 2000 to 2009: 6.6
Deaths per 1000 population from 2010 to 2020: 6.4
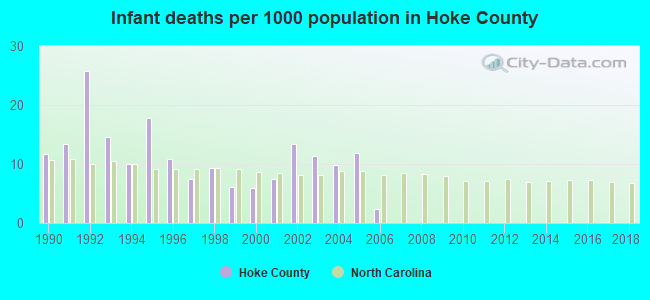
Infant deaths per 1000 live births from 1990 to 1999: 12.7
Infant deaths per 1000 live births from 2000 to 2006: 8.9
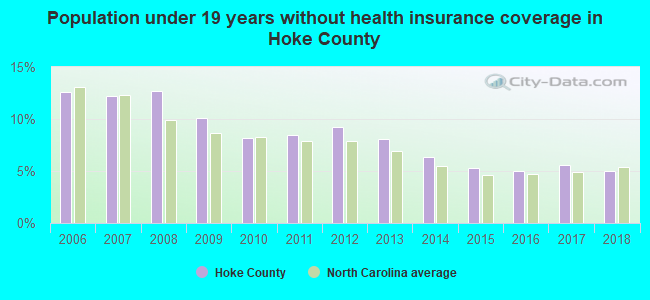
Persons under 19 years old without health insurance coverage in 2018: 5.0%

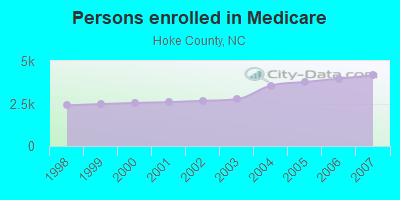
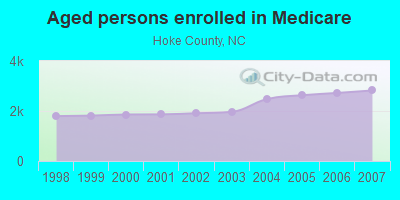
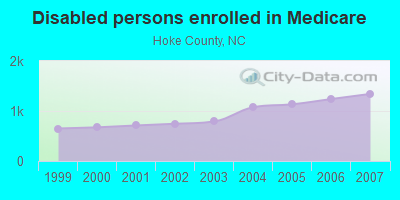
Persons enrolled in hospital insurance and/or supplemental medical insurance (Medicare) in July 1, 2007: 4,163 (2,821 aged, 1,342 disabled)
Children under 18 without health insurance coverage in 2007: 2,033 (15%)
Most common underlying causes of death in Hoke County, North Carolina in 1999 - 2019:
- Bronchus or lung, unspecified - Malignant neoplasms (418)
- Atherosclerotic heart disease (297)
- Chronic obstructive pulmonary disease, unspecified (167)
- Acute myocardial infarction, unspecified (155)
- Alzheimer disease, unspecified (122)
- Chronic ischaemic heart disease, unspecified (77)
- Unspecified dementia (47)
- Stroke, not specified as haemorrhage or infarction (44)
- Atherosclerotic cardiovascular disease, so described (32)
- Cardiac arrest, unspecified (23)
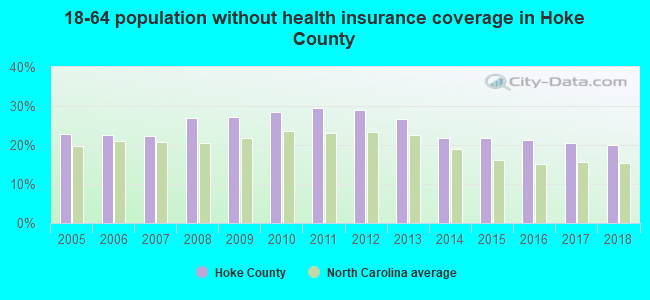
Population without health insurance coverage in 2000: 21%
Children under 18 without health insurance coverage in 2000: 18%
Medical specialist MDs per 100,000 population in 2005: 685
Dentists per 100,000 population in 1998: 2
Total births per 100,000 population, July 2005 - July 2006 : 10
Total deaths per 100,000 population, July 2005 - July 2006: 34
Limited-service eating places per 100,000 population in 2005 : 2
EPA green book nonattainment status in 2004-2006: 1
Homicides per 1,000,000 population from 2000 to 2006: 107.8. This is more than state average.
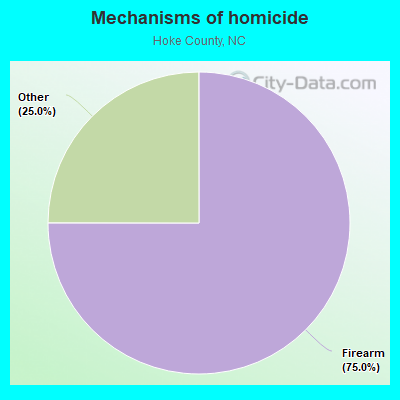
- Firearm - 80.8
- Other - 26.9
Household type by relationship:
Households: 53,761- Male householders: 8,711 (2,791 living alone), Female householders: 10,656 (3,382 living alone)
8,983 spouses (8,978 opposite-sex spouses), 1,213 unmarried partners, (1,213 opposite-sex unmarried partners), 17,515 children (16,392 natural, 229 adopted, 901 stepchildren), 1,820 grandchildren, 593 brothers or sisters, 611 parents, 175 foster children, 1,022 other relatives, 1,114 non-relatives
- In group quarters: 1,163
Size of family households: 4,817 2-persons, 3,207 3-persons, 2,456 4-persons, 1,224 5-persons, 534 6-persons, 268 7-or-more-persons.
Size of nonfamily households: 6,175 1-person, 551 2-persons, 18 3-persons, 30 4-persons, 42 5-persons.
8,175 married couples with children.
4,167 single-parent households (759 men, 3,408 women).
88.5% of residents of Hoke speak English at home.
8.6% of residents speak Spanish at home (60% speak English very well, 14% speak English well, 15% speak English not well, 10% don't speak English at all).
1.2% of residents speak other Indo-European language at home (61% speak English very well, 32% speak English well, 7% speak English not well).
1.2% of residents speak Asian or Pacific Island language at home (58% speak English very well, 34% speak English well, 7% speak English not well).
0.2% of residents speak other language at home (100% speak English very well).
In fiscal year 2004:
Federal Government expenditure: $142,827,000 ($3,638 per capita)
Department of Defense expenditure: $21,482,000
Federal direct payments to individuals for retirement and disability: $67,261,000
Federal other direct payments to individuals: $22,713,000
Federal direct payments not to individuals: $2,220,000
Federal grants: $36,599,000
Federal procurement contracts: $5,058,000 ($1,186,000 Department of Defense)
Federal salaries and wages: $8,977,000 ($6,427,000 Department of Defense)
Federal Government direct loans: $9,841,000
Federal guaranteed/insured loans: $72,452,000
Federal Government insurance: $9,717,000
Population change from April 1, 2000 to July 1, 2005:
Births: 3,727| Here: | 91 per 1000 residents |
| State: | 72 per 1000 residents |
Deaths: 1,312
| Here: | 32 per 1000 residents |
| State: | 44 per 1000 residents |
Net international migration: +765
| Here: | +19 per 1000 residents |
| State: | +18 per 1000 residents |
Net internal migration: +4,248
| Here: | +104 per 1000 residents |
| State: | +27 per 1000 residents |
Total withdrawal of fresh water for public supply: 1.50 millions of gallons per day (all from ground)
| Here: | 6.1 |
| State: | 6.4 |
| Here: | 5.1 |
| State: | 4.4 |
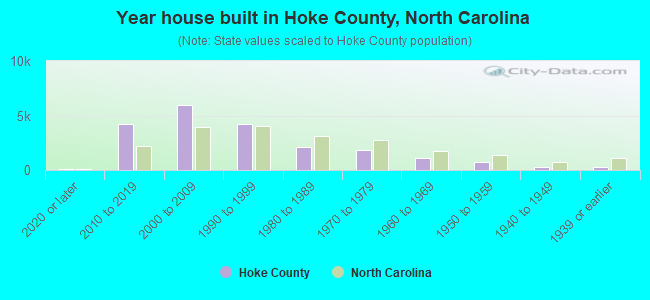
- Year house built in Hoke County, North Carolina
- 2072020 or later
- 4,2312010 to 2019
- 6,2352000 to 2009
- 4,3031990 to 1999
- 1,9791980 to 1989
- 1,6881970 to 1979
- 1,0151960 to 1969
- 6261950 to 1959
- 3251940 to 1949
- 3491939 or earlier
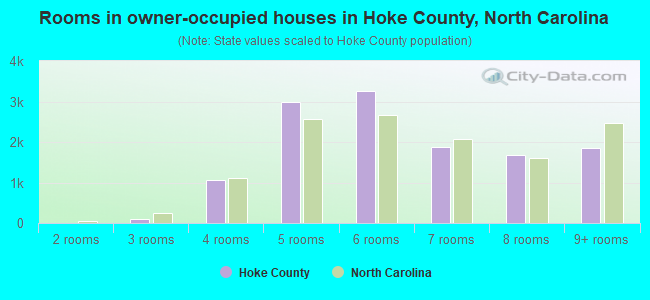
- Rooms in owner-occupied houses in Hoke County, North Carolina
- 221 room
- 02 rooms
- 763 rooms
- 9804 rooms
- 3,5035 rooms
- 3,3616 rooms
- 2,1747 rooms
- 1,6198 rooms
- 1,8599+ rooms
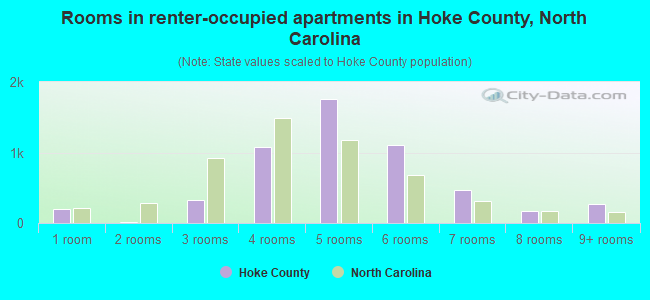
- Rooms in renter-occupied apartments in Hoke County, North Carolina
- 2121 room
- 402 rooms
- 3513 rooms
- 1,1134 rooms
- 1,7335 rooms
- 1,1886 rooms
- 5237 rooms
- 2288 rooms
- 3229+ rooms
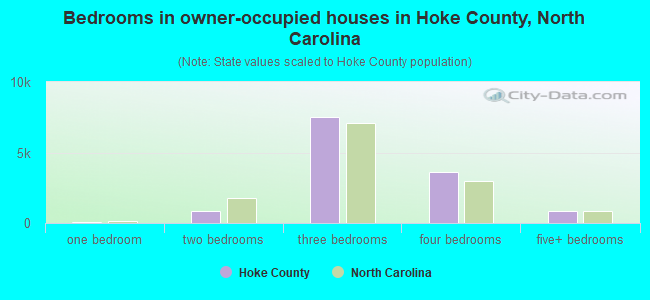
- Bedrooms in owner-occupied houses in Hoke County, North Carolina
- 23no bedroom
- 381 bedroom
- 9032 bedrooms
- 7,9963 bedrooms
- 3,7674 bedrooms
- 9335+ bedrooms
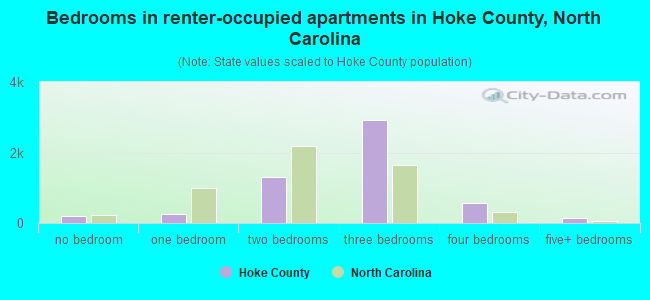
- Bedrooms in renter-occupied apartments in Hoke County, North Carolina
- 215no bedroom
- 2751 bedroom
- 1,3052 bedrooms
- 3,0753 bedrooms
- 7154 bedrooms
- 1565+ bedrooms
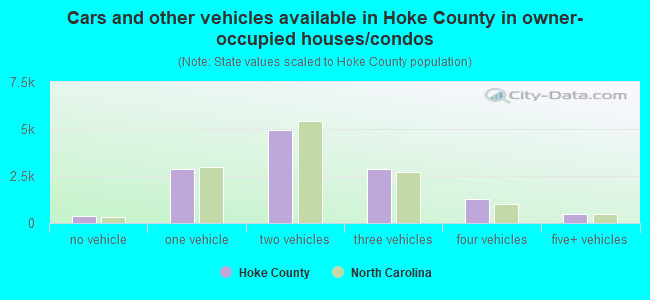
- Cars and other vehicles available in Hoke County in owner-occupied houses/condos
- 371no vehicle
- 3,2581 vehicle
- 5,3852 vehicles
- 2,7993 vehicles
- 1,2134 vehicles
- 6075+ vehicles
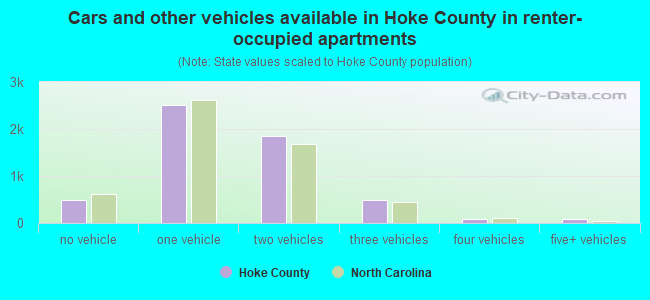
- Cars and other vehicles available in Hoke County in renter-occupied apartments
- 566no vehicle
- 2,6831 vehicle
- 1,7102 vehicles
- 5703 vehicles
- 1024 vehicles
- 1175+ vehicles
87.7% of Hoke County residents lived in the same house 1 years ago.
Out of people who lived in different houses, 17% lived in this county.
Out of people who lived in different counties, 66% lived in North Carolina.
| Hoke County: | 87.7% |
| State average: | 87.3% |
Place of birth for U.S.-born residents:
- This state: 26,986
- Other state: 21,788
- Northeast: 4,661
- Midwest: 2,840
- South: 9,847
- West: 4,455
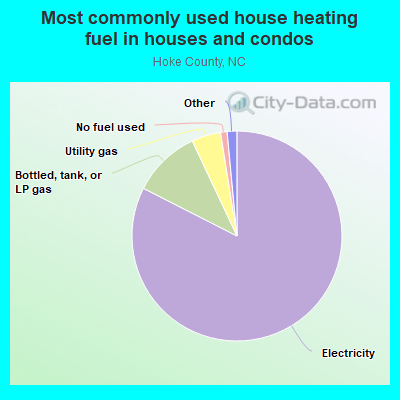
- 84.0%Electricity
- 10.2%Bottled, tank, or LP gas
- 4.0%Utility gas
- 0.7%Wood
- 0.6%No fuel used
- 0.5%Fuel oil, kerosene, etc.
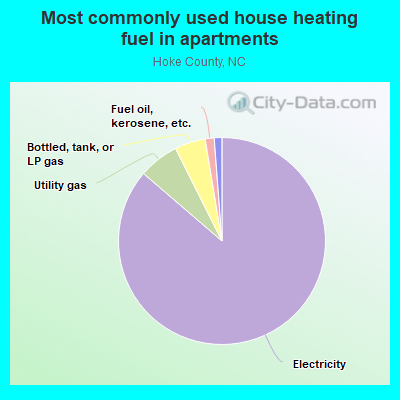
- 85.4%Electricity
- 7.1%Utility gas
- 4.8%Bottled, tank, or LP gas
- 1.3%Fuel oil, kerosene, etc.
- 0.9%No fuel used
- 0.4%Wood
- 0.2%Other fuel
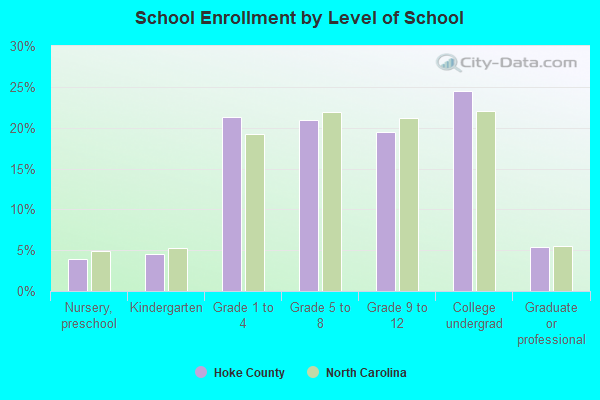
Private vs. public school enrollment:
| Here: | 13.2% |
| North Carolina: | 13.8% |
| Here: | 14.8% |
| North Carolina: | 11.9% |
| Here: | 20.4% |
| North Carolina: | 19.3% |
Hoke County government finances - Expenditure in 2017:
- Charges - Elementary and Secondary Education School Lunch: $913,000
Elementary and Secondary Education School Tuition and Transportation: $106,000
Elementary and Secondary Education - Other: $7,000
- Construction - Elementary and Secondary Education: $412,000
- Current Operations - Elementary and Secondary Education: $76,392,000
Liquor Stores: $1,014,000
Health - Other: $10,000
Police Protection: $7,000
- Federal Intergovernmental - Education: $1,110,000
- General - Interest on Debt: $1,127,000
- Intergovernmental to Local - Other - Elementary and Secondary Education: $557,000
Other - Health - Other: $6,000
- Long Term Debt - Beginning Outstanding - Unspecified Public Purpose: $59,116,000
Outstanding Unspecified Public Purpose: $56,006,000
Retired Unspecified Public Purpose: $3,110,000
Beginning Outstanding - Public Debt for Private Purpose: $605,000
Outstanding Nonguaranteed - Industrial Revenue: $505,000
Retired Nonguaranteed - Public Debt for Private Purpose: $100,000
- Miscellaneous - General Revenue - Other: $2,325,000
Fines and Forfeits: $242,000
- Other Capital Outlay - Elementary and Secondary Education: $1,429,000
- Other Funds - Cash and Securities: $2,617,000
- Revenue - Liquor Stores: $1,207,000
- Sinking Funds - Cash and Securities: $505,000
- State Intergovernmental - Education: $68,990,000
- Tax - Property: $6,348,000
Alcoholic Beverage Sales: $136,000
- Total Salaries and Wages: $47,314,000
Hoke County government finances - Revenue in 2017:
- Charges - Elementary and Secondary Education School Lunch: $913,000
Elementary and Secondary Education School Tuition and Transportation: $106,000
Elementary and Secondary Education - Other: $7,000
- Construction - Elementary and Secondary Education: $412,000
- Current Operations - Elementary and Secondary Education: $76,392,000
Liquor Stores: $1,014,000
Health - Other: $10,000
Police Protection: $7,000
- Federal Intergovernmental - Education: $1,110,000
- General - Interest on Debt: $1,127,000
- Intergovernmental to Local - Other - Elementary and Secondary Education: $557,000
Other - Health - Other: $6,000
- Long Term Debt - Beginning Outstanding - Unspecified Public Purpose: $59,116,000
Outstanding Unspecified Public Purpose: $56,006,000
Retired Unspecified Public Purpose: $3,110,000
Beginning Outstanding - Public Debt for Private Purpose: $605,000
Outstanding Nonguaranteed - Industrial Revenue: $505,000
Retired Nonguaranteed - Public Debt for Private Purpose: $100,000
- Miscellaneous - General Revenue - Other: $2,325,000
Fines and Forfeits: $242,000
- Other Capital Outlay - Elementary and Secondary Education: $1,429,000
- Other Funds - Cash and Securities: $2,617,000
- Revenue - Liquor Stores: $1,207,000
- Sinking Funds - Cash and Securities: $505,000
- State Intergovernmental - Education: $68,990,000
- Tax - Property: $6,348,000
Alcoholic Beverage Sales: $136,000
- Total Salaries and Wages: $47,314,000
Hoke County government finances - Debt in 2017:
- Charges - Elementary and Secondary Education School Lunch: $913,000
Elementary and Secondary Education School Tuition and Transportation: $106,000
Elementary and Secondary Education - Other: $7,000
- Construction - Elementary and Secondary Education: $412,000
- Current Operations - Elementary and Secondary Education: $76,392,000
Liquor Stores: $1,014,000
Health - Other: $10,000
Police Protection: $7,000
- Federal Intergovernmental - Education: $1,110,000
- General - Interest on Debt: $1,127,000
- Intergovernmental to Local - Other - Elementary and Secondary Education: $557,000
Other - Health - Other: $6,000
- Long Term Debt - Beginning Outstanding - Unspecified Public Purpose: $59,116,000
Outstanding Unspecified Public Purpose: $56,006,000
Retired Unspecified Public Purpose: $3,110,000
Beginning Outstanding - Public Debt for Private Purpose: $605,000
Outstanding Nonguaranteed - Industrial Revenue: $505,000
Retired Nonguaranteed - Public Debt for Private Purpose: $100,000
- Miscellaneous - General Revenue - Other: $2,325,000
Fines and Forfeits: $242,000
- Other Capital Outlay - Elementary and Secondary Education: $1,429,000
- Other Funds - Cash and Securities: $2,617,000
- Revenue - Liquor Stores: $1,207,000
- Sinking Funds - Cash and Securities: $505,000
- State Intergovernmental - Education: $68,990,000
- Tax - Property: $6,348,000
Alcoholic Beverage Sales: $136,000
- Total Salaries and Wages: $47,314,000
Hoke County government finances - Cash and Securities in 2017:
- Charges - Elementary and Secondary Education School Lunch: $913,000
Elementary and Secondary Education School Tuition and Transportation: $106,000
Elementary and Secondary Education - Other: $7,000
- Construction - Elementary and Secondary Education: $412,000
- Current Operations - Elementary and Secondary Education: $76,392,000
Liquor Stores: $1,014,000
Health - Other: $10,000
Police Protection: $7,000
- Federal Intergovernmental - Education: $1,110,000
- General - Interest on Debt: $1,127,000
- Intergovernmental to Local - Other - Elementary and Secondary Education: $557,000
Other - Health - Other: $6,000
- Long Term Debt - Beginning Outstanding - Unspecified Public Purpose: $59,116,000
Outstanding Unspecified Public Purpose: $56,006,000
Retired Unspecified Public Purpose: $3,110,000
Beginning Outstanding - Public Debt for Private Purpose: $605,000
Outstanding Nonguaranteed - Industrial Revenue: $505,000
Retired Nonguaranteed - Public Debt for Private Purpose: $100,000
- Miscellaneous - General Revenue - Other: $2,325,000
Fines and Forfeits: $242,000
- Other Capital Outlay - Elementary and Secondary Education: $1,429,000
- Other Funds - Cash and Securities: $2,617,000
- Revenue - Liquor Stores: $1,207,000
- Sinking Funds - Cash and Securities: $505,000
- State Intergovernmental - Education: $68,990,000
- Tax - Property: $6,348,000
Alcoholic Beverage Sales: $136,000
- Total Salaries and Wages: $47,314,000
Supplemental Security Income (SSI) in 2006:
- Total number of recipients: 1,251
- Number of aged recipients: 158
- Number of blind and disabled recipients: 1,093
- Number of recipients under 18: 276
- Number of recipients between 18 and 64: 647
- Number of recipients older than 64: 328
- Number of recipients also receiving OASDI: 508
- Amount of payments (thousands of dollars): 515
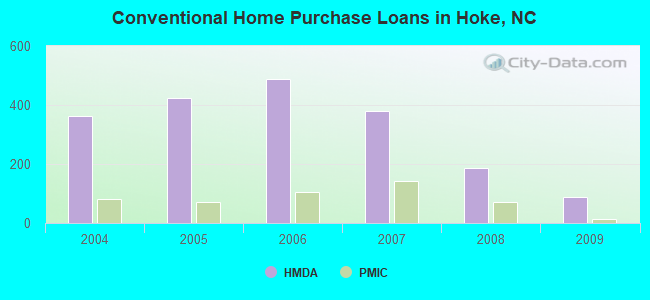
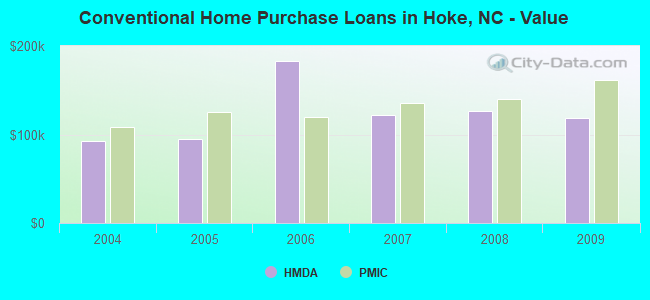
| Home Mortgage Disclosure Act Aggregated Statistics For Year 2009 (Based on 4 full tracts) | ||||||||||||
| A) FHA, FSA/RHS & VA Home Purchase Loans | B) Conventional Home Purchase Loans | C) Refinancings | D) Home Improvement Loans | F) Non-occupant Loans on < 5 Family Dwellings (A B C & D) | G) Loans On Manufactured Home Dwelling (A B C & D) | |||||||
|---|---|---|---|---|---|---|---|---|---|---|---|---|
| Number | Average Value | Number | Average Value | Number | Average Value | Number | Average Value | Number | Average Value | Number | Average Value | |
| LOANS ORIGINATED | 802 | $171,229 | 89 | $119,022 | 878 | $158,118 | 41 | $47,390 | 62 | $107,468 | 58 | $67,500 |
| APPLICATIONS APPROVED, NOT ACCEPTED | 22 | $152,545 | 5 | $93,200 | 76 | $138,961 | 9 | $12,778 | 6 | $120,000 | 10 | $68,500 |
| APPLICATIONS DENIED | 60 | $146,183 | 22 | $102,227 | 266 | $120,429 | 58 | $32,259 | 28 | $85,179 | 32 | $67,656 |
| APPLICATIONS WITHDRAWN | 48 | $164,896 | 12 | $170,500 | 229 | $141,716 | 6 | $38,333 | 13 | $83,538 | 15 | $105,533 |
| FILES CLOSED FOR INCOMPLETENESS | 8 | $144,125 | 8 | $165,500 | 54 | $136,037 | 1 | $177,000 | 1 | $63,000 | 5 | $84,600 |
Detailed HMDA statistics for the following Tracts: 9701.00 , 9702.00, 9703.00, 9704.00
| Private Mortgage Insurance Companies Aggregated Statistics For Year 2009 (Based on 4 full tracts) | ||||||||
| A) Conventional Home Purchase Loans | B) Refinancings | C) Non-occupant Loans on < 5 Family Dwellings (A & B) | D) Loans On Manufactured Home Dwelling (A & B) | |||||
|---|---|---|---|---|---|---|---|---|
| Number | Average Value | Number | Average Value | Number | Average Value | Number | Average Value | |
| LOANS ORIGINATED | 14 | $162,143 | 15 | $160,333 | 1 | $211,000 | 0 | $0 |
| APPLICATIONS APPROVED, NOT ACCEPTED | 5 | $219,000 | 8 | $117,250 | 0 | $0 | 1 | $79,000 |
| APPLICATIONS DENIED | 3 | $270,667 | 1 | $107,000 | 1 | $240,000 | 0 | $0 |
| APPLICATIONS WITHDRAWN | 0 | $0 | 2 | $140,500 | 0 | $0 | 0 | $0 |
| FILES CLOSED FOR INCOMPLETENESS | 1 | $199,000 | 1 | $119,000 | 1 | $199,000 | 0 | $0 |
Detailed PMIC statistics for the following Tracts: 9701.00 , 9702.00, 9703.00, 9704.00
| Most common first names in Hoke County, NC among deceased individuals | ||
| Name | Count | Lived (average) |
|---|---|---|
| James | 249 | 69.2 years |
| John | 201 | 71.6 years |
| Mary | 198 | 77.6 years |
| William | 164 | 73.1 years |
| Robert | 107 | 66.8 years |
| Annie | 85 | 76.3 years |
| Willie | 75 | 71.8 years |
| Charles | 64 | 64.4 years |
| Margaret | 60 | 78.2 years |
| George | 59 | 72.5 years |
| Most common last names in Hoke County, NC among deceased individuals | ||
| Last name | Count | Lived (average) |
|---|---|---|
| Smith | 94 | 71.3 years |
| Mcneill | 85 | 72.4 years |
| Jones | 70 | 71.1 years |
| Johnson | 67 | 72.2 years |
| Davis | 64 | 73.2 years |
| Campbell | 63 | 69.5 years |
| Graham | 55 | 73.4 years |
| Williams | 53 | 68.4 years |
| Ray | 53 | 71.5 years |
| Mclean | 50 | 73.9 years |
| Businesses in Hoke County, NC | ||||
| Name | Count | Name | Count | |
|---|---|---|---|---|
| Advance Auto Parts | 1 | KFC | 1 | |
| AutoZone | 1 | McDonald's | 1 | |
| Burger King | 1 | Papa John's Pizza | 1 | |
| CVS | 1 | Subway | 3 | |
| Days Inn | 1 | T-Mobile | 1 | |
| Domino's Pizza | 2 | U-Haul | 2 | |
| Dunkin Donuts | 1 | U.S. Cellular | 1 | |
| FedEx | 2 | UPS | 1 | |
| H&R Block | 2 | Waffle House | 1 | |
| Hardee's | 1 | Walmart | 1 | |
Hoke County on our top lists:
- #19 on the list of "Top 101 counties with the highest percentage of residents relocating from other counties between 2010 and 2011"
- #40 on the list of "Top 101 counties with the highest percentage of residents relocating to foreign countries in 2011"
- #43 on the list of "Top 101 counties with the highest percentage of residents relocating to other counties in 2011"
- #44 on the list of "Top 101 counties with the highest percentage of residents relocating from foreign countries between 2010 and 2011"
- #98 on the list of "Top 101 counties with the smallest number of people without health insurance coverage in 2000"