Estimated zip code population in 2022: 26,442
Zip code population in 2010: 19,589
Zip code population in 2000: 15,339
Houses and condos: 9,693
Renter-occupied apartments: 2,022
% of renters here:
22%State:
33%
March 2022 cost of living index in zip code 27591: 93.5
(less than average, U.S. average is 100)
Land area: 66.3
sq. mi.
Water area: 0.4
sq. mi.
Population density: 399 people per square mile (very low).
OSM Map
General Map
Google Map
MSN Map
OSM Map
General Map
Google Map
MSN Map
OSM Map
General Map
Google Map
MSN Map
OSM Map
General Map
Google Map
MSN Map
Please wait while loading the map...
Real estate property taxes paid for housing units in 2022:
This zip code:
0.6% ($1,835)North Carolina:
0.6% ($1,769)
Median real estate property taxes paid for housing units with mortgages in 2022: $2,137 (0.6%)
Median real estate property taxes paid for housing units with no mortgage in 2022: $1,346 (0.6%)
Profiles of local businesses
Business Search - 14 Million verified businesses
Males: 13,242 Females: 13,198
For population 25 years and over in 27591:
High school or higher: 89.5%Bachelor's degree or higher: 32.3%Graduate or professional degree: 11.0%Unemployed: 1.5%Mean travel time to work (commute): 30.6 minutes
For population 15 years and over in 27591:
Never married: 24.8%Now married: 57.2%Separated: 2.3%Widowed: 5.4%Divorced: 10.3%
Zip code 27591 compared to state average:
Unemployed percentage below state average. Hispanic race population percentage above state average. Renting percentage below state average. 12,800 48.4% White 6,410 24.2% Hispanic or Latino 6,316 23.9% Black 649 2.5% Two or more races 126 0.5% Asian 88 0.3% American Indian 50 0.2% Some other race
Data:
Median household income ($)
Median household income (% change since 2000)
Household income diversity
Ratio of average income to average house value (%)
Ratio of average income to average rent
Median household income ($) - White
Median household income ($) - Black or African American
Median household income ($) - Asian
Median household income ($) - Hispanic or Latino
Median household income ($) - American Indian and Alaska Native
Median household income ($) - Multirace
Median household income ($) - Other Race
Median household income for houses/condos with a mortgage ($)
Median household income for apartments without a mortgage ($)
Races - White alone (%)
Races - White alone (% change since 2000)
Races - Black alone (%)
Races - Black alone (% change since 2000)
Races - American Indian alone (%)
Races - American Indian alone (% change since 2000)
Races - Asian alone (%)
Races - Asian alone (% change since 2000)
Races - Hispanic (%)
Races - Hispanic (% change since 2000)
Races - Native Hawaiian and Other Pacific Islander alone (%)
Races - Native Hawaiian and Other Pacific Islander alone (% change since 2000)
Races - Two or more races (%)
Races - Two or more races (% change since 2000)
Races - Other race alone (%)
Races - Other race alone (% change since 2000)
Racial diversity
Unemployment (%)
Unemployment (% change since 2000)
Unemployment (%) - White
Unemployment (%) - Black or African American
Unemployment (%) - Asian
Unemployment (%) - Hispanic or Latino
Unemployment (%) - American Indian and Alaska Native
Unemployment (%) - Multirace
Unemployment (%) - Other Race
Population density (people per square mile)
Population - Males (%)
Population - Females (%)
Population - Males (%) - White
Population - Males (%) - Black or African American
Population - Males (%) - Asian
Population - Males (%) - Hispanic or Latino
Population - Males (%) - American Indian and Alaska Native
Population - Males (%) - Multirace
Population - Males (%) - Other Race
Population - Females (%) - White
Population - Females (%) - Black or African American
Population - Females (%) - Asian
Population - Females (%) - Hispanic or Latino
Population - Females (%) - American Indian and Alaska Native
Population - Females (%) - Multirace
Population - Females (%) - Other Race
Coronavirus confirmed cases (Apr 27, 2024)
Deaths caused by coronavirus (Apr 27, 2024)
Coronavirus confirmed cases (per 100k population) (Apr 27, 2024)
Deaths caused by coronavirus (per 100k population) (Apr 27, 2024)
Daily increase in number of cases (Apr 27, 2024)
Weekly increase in number of cases (Apr 27, 2024)
Cases doubled (in days) (Apr 27, 2024)
Hospitalized patients (Apr 18, 2022)
Negative test results (Apr 18, 2022)
Total test results (Apr 18, 2022)
COVID Vaccine doses distributed (per 100k population) (Sep 19, 2023)
COVID Vaccine doses administered (per 100k population) (Sep 19, 2023)
COVID Vaccine doses distributed (Sep 19, 2023)
COVID Vaccine doses administered (Sep 19, 2023)
Likely homosexual households (%)
Likely homosexual households (% change since 2000)
Likely homosexual households - Lesbian couples (%)
Likely homosexual households - Lesbian couples (% change since 2000)
Likely homosexual households - Gay men (%)
Likely homosexual households - Gay men (% change since 2000)
Cost of living index
Median gross rent ($)
Median contract rent ($)
Median monthly housing costs ($)
Median house or condo value ($)
Median house or condo value ($ change since 2000)
Mean house or condo value by units in structure - 1, detached ($)
Mean house or condo value by units in structure - 1, attached ($)
Mean house or condo value by units in structure - 2 ($)
Mean house or condo value by units in structure by units in structure - 3 or 4 ($)
Mean house or condo value by units in structure - 5 or more ($)
Mean house or condo value by units in structure - Boat, RV, van, etc. ($)
Mean house or condo value by units in structure - Mobile home ($)
Median house or condo value ($) - White
Median house or condo value ($) - Black or African American
Median house or condo value ($) - Asian
Median house or condo value ($) - Hispanic or Latino
Median house or condo value ($) - American Indian and Alaska Native
Median house or condo value ($) - Multirace
Median house or condo value ($) - Other Race
Median resident age
Resident age diversity
Median resident age - Males
Median resident age - Females
Median resident age - White
Median resident age - Black or African American
Median resident age - Asian
Median resident age - Hispanic or Latino
Median resident age - American Indian and Alaska Native
Median resident age - Multirace
Median resident age - Other Race
Median resident age - Males - White
Median resident age - Males - Black or African American
Median resident age - Males - Asian
Median resident age - Males - Hispanic or Latino
Median resident age - Males - American Indian and Alaska Native
Median resident age - Males - Multirace
Median resident age - Males - Other Race
Median resident age - Females - White
Median resident age - Females - Black or African American
Median resident age - Females - Asian
Median resident age - Females - Hispanic or Latino
Median resident age - Females - American Indian and Alaska Native
Median resident age - Females - Multirace
Median resident age - Females - Other Race
Commute - mean travel time to work (minutes)
Travel time to work - Less than 5 minutes (%)
Travel time to work - Less than 5 minutes (% change since 2000)
Travel time to work - 5 to 9 minutes (%)
Travel time to work - 5 to 9 minutes (% change since 2000)
Travel time to work - 10 to 19 minutes (%)
Travel time to work - 10 to 19 minutes (% change since 2000)
Travel time to work - 20 to 29 minutes (%)
Travel time to work - 20 to 29 minutes (% change since 2000)
Travel time to work - 30 to 39 minutes (%)
Travel time to work - 30 to 39 minutes (% change since 2000)
Travel time to work - 40 to 59 minutes (%)
Travel time to work - 40 to 59 minutes (% change since 2000)
Travel time to work - 60 to 89 minutes (%)
Travel time to work - 60 to 89 minutes (% change since 2000)
Travel time to work - 90 or more minutes (%)
Travel time to work - 90 or more minutes (% change since 2000)
Marital status - Never married (%)
Marital status - Now married (%)
Marital status - Separated (%)
Marital status - Widowed (%)
Marital status - Divorced (%)
Median family income ($)
Median family income (% change since 2000)
Median non-family income ($)
Median non-family income (% change since 2000)
Median per capita income ($)
Median per capita income (% change since 2000)
Median family income ($) - White
Median family income ($) - Black or African American
Median family income ($) - Asian
Median family income ($) - Hispanic or Latino
Median family income ($) - American Indian and Alaska Native
Median family income ($) - Multirace
Median family income ($) - Other Race
Median year house/condo built
Median year apartment built
Year house built - Built 2005 or later (%)
Year house built - Built 2000 to 2004 (%)
Year house built - Built 1990 to 1999 (%)
Year house built - Built 1980 to 1989 (%)
Year house built - Built 1970 to 1979 (%)
Year house built - Built 1960 to 1969 (%)
Year house built - Built 1950 to 1959 (%)
Year house built - Built 1940 to 1949 (%)
Year house built - Built 1939 or earlier (%)
Average household size
Household density (households per square mile)
Average household size - White
Average household size - Black or African American
Average household size - Asian
Average household size - Hispanic or Latino
Average household size - American Indian and Alaska Native
Average household size - Multirace
Average household size - Other Race
Occupied housing units (%)
Vacant housing units (%)
Owner occupied housing units (%)
Renter occupied housing units (%)
Vacancy status - For rent (%)
Vacancy status - For sale only (%)
Vacancy status - Rented or sold, not occupied (%)
Vacancy status - For seasonal, recreational, or occasional use (%)
Vacancy status - For migrant workers (%)
Vacancy status - Other vacant (%)
Residents with income below the poverty level (%)
Residents with income below 50% of the poverty level (%)
Children below poverty level (%)
Poor families by family type - Married-couple family (%)
Poor families by family type - Male, no wife present (%)
Poor families by family type - Female, no husband present (%)
Poverty status for native-born residents (%)
Poverty status for foreign-born residents (%)
Poverty among high school graduates not in families (%)
Poverty among people who did not graduate high school not in families (%)
Residents with income below the poverty level (%) - White
Residents with income below the poverty level (%) - Black or African American
Residents with income below the poverty level (%) - Asian
Residents with income below the poverty level (%) - Hispanic or Latino
Residents with income below the poverty level (%) - American Indian and Alaska Native
Residents with income below the poverty level (%) - Multirace
Residents with income below the poverty level (%) - Other Race
Air pollution - Air Quality Index (AQI)
Air pollution - CO
Air pollution - NO2
Air pollution - SO2
Air pollution - Ozone
Air pollution - PM10
Air pollution - PM25
Air pollution - Pb
Crime - Murders per 100,000 population
Crime - Rapes per 100,000 population
Crime - Robberies per 100,000 population
Crime - Assaults per 100,000 population
Crime - Burglaries per 100,000 population
Crime - Thefts per 100,000 population
Crime - Auto thefts per 100,000 population
Crime - Arson per 100,000 population
Crime - City-data.com crime index
Crime - Violent crime index
Crime - Property crime index
Crime - Murders per 100,000 population (5 year average)
Crime - Rapes per 100,000 population (5 year average)
Crime - Robberies per 100,000 population (5 year average)
Crime - Assaults per 100,000 population (5 year average)
Crime - Burglaries per 100,000 population (5 year average)
Crime - Thefts per 100,000 population (5 year average)
Crime - Auto thefts per 100,000 population (5 year average)
Crime - Arson per 100,000 population (5 year average)
Crime - City-data.com crime index (5 year average)
Crime - Violent crime index (5 year average)
Crime - Property crime index (5 year average)
1996 Presidential Elections Results (%) - Democratic Party (Clinton)
1996 Presidential Elections Results (%) - Republican Party (Dole)
1996 Presidential Elections Results (%) - Other
2000 Presidential Elections Results (%) - Democratic Party (Gore)
2000 Presidential Elections Results (%) - Republican Party (Bush)
2000 Presidential Elections Results (%) - Other
2004 Presidential Elections Results (%) - Democratic Party (Kerry)
2004 Presidential Elections Results (%) - Republican Party (Bush)
2004 Presidential Elections Results (%) - Other
2008 Presidential Elections Results (%) - Democratic Party (Obama)
2008 Presidential Elections Results (%) - Republican Party (McCain)
2008 Presidential Elections Results (%) - Other
2012 Presidential Elections Results (%) - Democratic Party (Obama)
2012 Presidential Elections Results (%) - Republican Party (Romney)
2012 Presidential Elections Results (%) - Other
2016 Presidential Elections Results (%) - Democratic Party (Clinton)
2016 Presidential Elections Results (%) - Republican Party (Trump)
2016 Presidential Elections Results (%) - Other
2020 Presidential Elections Results (%) - Democratic Party (Biden)
2020 Presidential Elections Results (%) - Republican Party (Trump)
2020 Presidential Elections Results (%) - Other
Ancestries Reported - Arab (%)
Ancestries Reported - Czech (%)
Ancestries Reported - Danish (%)
Ancestries Reported - Dutch (%)
Ancestries Reported - English (%)
Ancestries Reported - French (%)
Ancestries Reported - French Canadian (%)
Ancestries Reported - German (%)
Ancestries Reported - Greek (%)
Ancestries Reported - Hungarian (%)
Ancestries Reported - Irish (%)
Ancestries Reported - Italian (%)
Ancestries Reported - Lithuanian (%)
Ancestries Reported - Norwegian (%)
Ancestries Reported - Polish (%)
Ancestries Reported - Portuguese (%)
Ancestries Reported - Russian (%)
Ancestries Reported - Scotch-Irish (%)
Ancestries Reported - Scottish (%)
Ancestries Reported - Slovak (%)
Ancestries Reported - Subsaharan African (%)
Ancestries Reported - Swedish (%)
Ancestries Reported - Swiss (%)
Ancestries Reported - Ukrainian (%)
Ancestries Reported - United States (%)
Ancestries Reported - Welsh (%)
Ancestries Reported - West Indian (%)
Ancestries Reported - Other (%)
Educational Attainment - No schooling completed (%)
Educational Attainment - Less than high school (%)
Educational Attainment - High school or equivalent (%)
Educational Attainment - Less than 1 year of college (%)
Educational Attainment - 1 or more years of college (%)
Educational Attainment - Associate degree (%)
Educational Attainment - Bachelor's degree (%)
Educational Attainment - Master's degree (%)
Educational Attainment - Professional school degree (%)
Educational Attainment - Doctorate degree (%)
School Enrollment - Nursery, preschool (%)
School Enrollment - Kindergarten (%)
School Enrollment - Grade 1 to 4 (%)
School Enrollment - Grade 5 to 8 (%)
School Enrollment - Grade 9 to 12 (%)
School Enrollment - College undergrad (%)
School Enrollment - Graduate or professional (%)
School Enrollment - Not enrolled in school (%)
School enrollment - Public schools (%)
School enrollment - Private schools (%)
School enrollment - Not enrolled (%)
Median number of rooms in houses and condos
Median number of rooms in apartments
Housing units lacking complete plumbing facilities (%)
Housing units lacking complete kitchen facilities (%)
Density of houses
Urban houses (%)
Rural houses (%)
Households with people 60 years and over (%)
Households with people 65 years and over (%)
Households with people 75 years and over (%)
Households with one or more nonrelatives (%)
Households with no nonrelatives (%)
Population in households (%)
Family households (%)
Nonfamily households (%)
Population in families (%)
Family households with own children (%)
Median number of bedrooms in owner occupied houses
Mean number of bedrooms in owner occupied houses
Median number of bedrooms in renter occupied houses
Mean number of bedrooms in renter occupied houses
Median number of vehichles in owner occupied houses
Mean number of vehichles in owner occupied houses
Median number of vehichles in renter occupied houses
Mean number of vehichles in renter occupied houses
Mortgage status - with mortgage (%)
Mortgage status - with second mortgage (%)
Mortgage status - with home equity loan (%)
Mortgage status - with both second mortgage and home equity loan (%)
Mortgage status - without a mortgage (%)
Average family size
Average family size - White
Average family size - Black or African American
Average family size - Asian
Average family size - Hispanic or Latino
Average family size - American Indian and Alaska Native
Average family size - Multirace
Average family size - Other Race
Geographical mobility - Same house 1 year ago (%)
Geographical mobility - Moved within same county (%)
Geographical mobility - Moved from different county within same state (%)
Geographical mobility - Moved from different state (%)
Geographical mobility - Moved from abroad (%)
Place of birth - Born in state of residence (%)
Place of birth - Born in other state (%)
Place of birth - Native, outside of US (%)
Place of birth - Foreign born (%)
Housing units in structures - 1, detached (%)
Housing units in structures - 1, attached (%)
Housing units in structures - 2 (%)
Housing units in structures - 3 or 4 (%)
Housing units in structures - 5 to 9 (%)
Housing units in structures - 10 to 19 (%)
Housing units in structures - 20 to 49 (%)
Housing units in structures - 50 or more (%)
Housing units in structures - Mobile home (%)
Housing units in structures - Boat, RV, van, etc. (%)
House/condo owner moved in on average (years ago)
Renter moved in on average (years ago)
Year householder moved into unit - Moved in 1999 to March 2000 (%)
Year householder moved into unit - Moved in 1995 to 1998 (%)
Year householder moved into unit - Moved in 1990 to 1994 (%)
Year householder moved into unit - Moved in 1980 to 1989 (%)
Year householder moved into unit - Moved in 1970 to 1979 (%)
Year householder moved into unit - Moved in 1969 or earlier (%)
Means of transportation to work - Drove car alone (%)
Means of transportation to work - Carpooled (%)
Means of transportation to work - Public transportation (%)
Means of transportation to work - Bus or trolley bus (%)
Means of transportation to work - Streetcar or trolley car (%)
Means of transportation to work - Subway or elevated (%)
Means of transportation to work - Railroad (%)
Means of transportation to work - Ferryboat (%)
Means of transportation to work - Taxicab (%)
Means of transportation to work - Motorcycle (%)
Means of transportation to work - Bicycle (%)
Means of transportation to work - Walked (%)
Means of transportation to work - Other means (%)
Working at home (%)
Industry diversity
Most Common Industries - Agriculture, forestry, fishing and hunting, and mining (%)
Most Common Industries - Agriculture, forestry, fishing and hunting (%)
Most Common Industries - Mining, quarrying, and oil and gas extraction (%)
Most Common Industries - Construction (%)
Most Common Industries - Manufacturing (%)
Most Common Industries - Wholesale trade (%)
Most Common Industries - Retail trade (%)
Most Common Industries - Transportation and warehousing, and utilities (%)
Most Common Industries - Transportation and warehousing (%)
Most Common Industries - Utilities (%)
Most Common Industries - Information (%)
Most Common Industries - Finance and insurance, and real estate and rental and leasing (%)
Most Common Industries - Finance and insurance (%)
Most Common Industries - Real estate and rental and leasing (%)
Most Common Industries - Professional, scientific, and management, and administrative and waste management services (%)
Most Common Industries - Professional, scientific, and technical services (%)
Most Common Industries - Management of companies and enterprises (%)
Most Common Industries - Administrative and support and waste management services (%)
Most Common Industries - Educational services, and health care and social assistance (%)
Most Common Industries - Educational services (%)
Most Common Industries - Health care and social assistance (%)
Most Common Industries - Arts, entertainment, and recreation, and accommodation and food services (%)
Most Common Industries - Arts, entertainment, and recreation (%)
Most Common Industries - Accommodation and food services (%)
Most Common Industries - Other services, except public administration (%)
Most Common Industries - Public administration (%)
Occupation diversity
Most Common Occupations - Management, business, science, and arts occupations (%)
Most Common Occupations - Management, business, and financial occupations (%)
Most Common Occupations - Management occupations (%)
Most Common Occupations - Business and financial operations occupations (%)
Most Common Occupations - Computer, engineering, and science occupations (%)
Most Common Occupations - Computer and mathematical occupations (%)
Most Common Occupations - Architecture and engineering occupations (%)
Most Common Occupations - Life, physical, and social science occupations (%)
Most Common Occupations - Education, legal, community service, arts, and media occupations (%)
Most Common Occupations - Community and social service occupations (%)
Most Common Occupations - Legal occupations (%)
Most Common Occupations - Education, training, and library occupations (%)
Most Common Occupations - Arts, design, entertainment, sports, and media occupations (%)
Most Common Occupations - Healthcare practitioners and technical occupations (%)
Most Common Occupations - Health diagnosing and treating practitioners and other technical occupations (%)
Most Common Occupations - Health technologists and technicians (%)
Most Common Occupations - Service occupations (%)
Most Common Occupations - Healthcare support occupations (%)
Most Common Occupations - Protective service occupations (%)
Most Common Occupations - Fire fighting and prevention, and other protective service workers including supervisors (%)
Most Common Occupations - Law enforcement workers including supervisors (%)
Most Common Occupations - Food preparation and serving related occupations (%)
Most Common Occupations - Building and grounds cleaning and maintenance occupations (%)
Most Common Occupations - Personal care and service occupations (%)
Most Common Occupations - Sales and office occupations (%)
Most Common Occupations - Sales and related occupations (%)
Most Common Occupations - Office and administrative support occupations (%)
Most Common Occupations - Natural resources, construction, and maintenance occupations (%)
Most Common Occupations - Farming, fishing, and forestry occupations (%)
Most Common Occupations - Construction and extraction occupations (%)
Most Common Occupations - Installation, maintenance, and repair occupations (%)
Most Common Occupations - Production, transportation, and material moving occupations (%)
Most Common Occupations - Production occupations (%)
Most Common Occupations - Transportation occupations (%)
Most Common Occupations - Material moving occupations (%)
People in Group quarters - Institutionalized population (%)
People in Group quarters - Correctional institutions (%)
People in Group quarters - Federal prisons and detention centers (%)
People in Group quarters - Halfway houses (%)
People in Group quarters - Local jails and other confinement facilities (including police lockups) (%)
People in Group quarters - Military disciplinary barracks (%)
People in Group quarters - State prisons (%)
People in Group quarters - Other types of correctional institutions (%)
People in Group quarters - Nursing homes (%)
People in Group quarters - Hospitals/wards, hospices, and schools for the handicapped (%)
People in Group quarters - Hospitals/wards and hospices for chronically ill (%)
People in Group quarters - Hospices or homes for chronically ill (%)
People in Group quarters - Military hospitals or wards for chronically ill (%)
People in Group quarters - Other hospitals or wards for chronically ill (%)
People in Group quarters - Hospitals or wards for drug/alcohol abuse (%)
People in Group quarters - Mental (Psychiatric) hospitals or wards (%)
People in Group quarters - Schools, hospitals, or wards for the mentally retarded (%)
People in Group quarters - Schools, hospitals, or wards for the physically handicapped (%)
People in Group quarters - Institutions for the deaf (%)
People in Group quarters - Institutions for the blind (%)
People in Group quarters - Orthopedic wards and institutions for the physically handicapped (%)
People in Group quarters - Wards in general hospitals for patients who have no usual home elsewhere (%)
People in Group quarters - Wards in military hospitals for patients who have no usual home elsewhere (%)
People in Group quarters - Juvenile institutions (%)
People in Group quarters - Long-term care (%)
People in Group quarters - Homes for abused, dependent, and neglected children (%)
People in Group quarters - Residential treatment centers for emotionally disturbed children (%)
People in Group quarters - Training schools for juvenile delinquents (%)
People in Group quarters - Short-term care, detention or diagnostic centers for delinquent children (%)
People in Group quarters - Type of juvenile institution unknown (%)
People in Group quarters - Noninstitutionalized population (%)
People in Group quarters - College dormitories (includes college quarters off campus) (%)
People in Group quarters - Military quarters (%)
People in Group quarters - On base (%)
People in Group quarters - Barracks, unaccompanied personnel housing (UPH), (Enlisted/Officer), ;and similar group living quarters for military personnel (%)
People in Group quarters - Transient quarters for temporary residents (%)
People in Group quarters - Military ships (%)
People in Group quarters - Group homes (%)
People in Group quarters - Homes or halfway houses for drug/alcohol abuse (%)
People in Group quarters - Homes for the mentally ill (%)
People in Group quarters - Homes for the mentally retarded (%)
People in Group quarters - Homes for the physically handicapped (%)
People in Group quarters - Other group homes (%)
People in Group quarters - Religious group quarters (%)
People in Group quarters - Dormitories (%)
People in Group quarters - Agriculture workers' dormitories on farms (%)
People in Group quarters - Job Corps and vocational training facilities (%)
People in Group quarters - Other workers' dormitories (%)
People in Group quarters - Crews of maritime vessels (%)
People in Group quarters - Other nonhousehold living situations (%)
People in Group quarters - Other noninstitutional group quarters (%)
Residents speaking English at home (%)
Residents speaking English at home - Born in the United States (%)
Residents speaking English at home - Native, born elsewhere (%)
Residents speaking English at home - Foreign born (%)
Residents speaking Spanish at home (%)
Residents speaking Spanish at home - Born in the United States (%)
Residents speaking Spanish at home - Native, born elsewhere (%)
Residents speaking Spanish at home - Foreign born (%)
Residents speaking other language at home (%)
Residents speaking other language at home - Born in the United States (%)
Residents speaking other language at home - Native, born elsewhere (%)
Residents speaking other language at home - Foreign born (%)
Class of Workers - Employee of private company (%)
Class of Workers - Self-employed in own incorporated business (%)
Class of Workers - Private not-for-profit wage and salary workers (%)
Class of Workers - Local government workers (%)
Class of Workers - State government workers (%)
Class of Workers - Federal government workers (%)
Class of Workers - Self-employed workers in own not incorporated business and Unpaid family workers (%)
House heating fuel used in houses and condos - Utility gas (%)
House heating fuel used in houses and condos - Bottled, tank, or LP gas (%)
House heating fuel used in houses and condos - Electricity (%)
House heating fuel used in houses and condos - Fuel oil, kerosene, etc. (%)
House heating fuel used in houses and condos - Coal or coke (%)
House heating fuel used in houses and condos - Wood (%)
House heating fuel used in houses and condos - Solar energy (%)
House heating fuel used in houses and condos - Other fuel (%)
House heating fuel used in houses and condos - No fuel used (%)
House heating fuel used in apartments - Utility gas (%)
House heating fuel used in apartments - Bottled, tank, or LP gas (%)
House heating fuel used in apartments - Electricity (%)
House heating fuel used in apartments - Fuel oil, kerosene, etc. (%)
House heating fuel used in apartments - Coal or coke (%)
House heating fuel used in apartments - Wood (%)
House heating fuel used in apartments - Solar energy (%)
House heating fuel used in apartments - Other fuel (%)
House heating fuel used in apartments - No fuel used (%)
Armed forces status - In Armed Forces (%)
Armed forces status - Civilian (%)
Armed forces status - Civilian - Veteran (%)
Armed forces status - Civilian - Nonveteran (%)
Fatal accidents locations in years 2005-2021
Fatal accidents locations in 2005
Fatal accidents locations in 2006
Fatal accidents locations in 2007
Fatal accidents locations in 2008
Fatal accidents locations in 2009
Fatal accidents locations in 2010
Fatal accidents locations in 2011
Fatal accidents locations in 2012
Fatal accidents locations in 2013
Fatal accidents locations in 2014
Fatal accidents locations in 2015
Fatal accidents locations in 2016
Fatal accidents locations in 2017
Fatal accidents locations in 2018
Fatal accidents locations in 2019
Fatal accidents locations in 2020
Fatal accidents locations in 2021
Alcohol use - People drinking some alcohol every month (%)
Alcohol use - People not drinking at all (%)
Alcohol use - Average days/month drinking alcohol
Alcohol use - Average drinks/week
Alcohol use - Average days/year people drink much
Audiometry - Average condition of hearing (%)
Audiometry - People that can hear a whisper from across a quiet room (%)
Audiometry - People that can hear normal voice from across a quiet room (%)
Audiometry - Ears ringing, roaring, buzzing (%)
Audiometry - Had a job exposure to loud noise (%)
Audiometry - Had off-work exposure to loud noise (%)
Blood Pressure & Cholesterol - Has high blood pressure (%)
Blood Pressure & Cholesterol - Checking blood pressure at home (%)
Blood Pressure & Cholesterol - Frequently checking blood cholesterol (%)
Blood Pressure & Cholesterol - Has high cholesterol level (%)
Consumer Behavior - Money monthly spent on food at supermarket/grocery store
Consumer Behavior - Money monthly spent on food at other stores
Consumer Behavior - Money monthly spent on eating out
Consumer Behavior - Money monthly spent on carryout/delivered foods
Consumer Behavior - Income spent on food at supermarket/grocery store (%)
Consumer Behavior - Income spent on food at other stores (%)
Consumer Behavior - Income spent on eating out (%)
Consumer Behavior - Income spent on carryout/delivered foods (%)
Current Health Status - General health condition (%)
Current Health Status - Blood donors (%)
Current Health Status - Has blood ever tested for HIV virus (%)
Current Health Status - Left-handed people (%)
Dermatology - People using sunscreen (%)
Diabetes - Diabetics (%)
Diabetes - Had a blood test for high blood sugar (%)
Diabetes - People taking insulin (%)
Diet Behavior & Nutrition - Diet health (%)
Diet Behavior & Nutrition - Milk product consumption (# of products/month)
Diet Behavior & Nutrition - Meals not home prepared (#/week)
Diet Behavior & Nutrition - Meals from fast food or pizza place (#/week)
Diet Behavior & Nutrition - Ready-to-eat foods (#/month)
Diet Behavior & Nutrition - Frozen meals/pizza (#/month)
Drug Use - People that ever used marijuana or hashish (%)
Drug Use - Ever used hard drugs (%)
Drug Use - Ever used any form of cocaine (%)
Drug Use - Ever used heroin (%)
Drug Use - Ever used methamphetamine (%)
Health Insurance - People covered by health insurance (%)
Kidney Conditions-Urology - Avg. # of times urinating at night
Medical Conditions - People with asthma (%)
Medical Conditions - People with anemia (%)
Medical Conditions - People with psoriasis (%)
Medical Conditions - People with overweight (%)
Medical Conditions - Elderly people having difficulties in thinking or remembering (%)
Medical Conditions - People who ever received blood transfusion (%)
Medical Conditions - People having trouble seeing even with glass/contacts (%)
Medical Conditions - People with arthritis (%)
Medical Conditions - People with gout (%)
Medical Conditions - People with congestive heart failure (%)
Medical Conditions - People with coronary heart disease (%)
Medical Conditions - People with angina pectoris (%)
Medical Conditions - People who ever had heart attack (%)
Medical Conditions - People who ever had stroke (%)
Medical Conditions - People with emphysema (%)
Medical Conditions - People with thyroid problem (%)
Medical Conditions - People with chronic bronchitis (%)
Medical Conditions - People with any liver condition (%)
Medical Conditions - People who ever had cancer or malignancy (%)
Mental Health - People who have little interest in doing things (%)
Mental Health - People feeling down, depressed, or hopeless (%)
Mental Health - People who have trouble sleeping or sleeping too much (%)
Mental Health - People feeling tired or having little energy (%)
Mental Health - People with poor appetite or overeating (%)
Mental Health - People feeling bad about themself (%)
Mental Health - People who have trouble concentrating on things (%)
Mental Health - People moving or speaking slowly or too fast (%)
Mental Health - People having thoughts they would be better off dead (%)
Oral Health - Average years since last visit a dentist
Oral Health - People embarrassed because of mouth (%)
Oral Health - People with gum disease (%)
Oral Health - General health of teeth and gums (%)
Oral Health - Average days a week using dental floss/device
Oral Health - Average days a week using mouthwash for dental problem
Oral Health - Average number of teeth
Pesticide Use - Households using pesticides to control insects (%)
Pesticide Use - Households using pesticides to kill weeds (%)
Physical Activity - People doing vigorous-intensity work activities (%)
Physical Activity - People doing moderate-intensity work activities (%)
Physical Activity - People walking or bicycling (%)
Physical Activity - People doing vigorous-intensity recreational activities (%)
Physical Activity - People doing moderate-intensity recreational activities (%)
Physical Activity - Average hours a day doing sedentary activities
Physical Activity - Average hours a day watching TV or videos
Physical Activity - Average hours a day using computer
Physical Functioning - People having limitations keeping them from working (%)
Physical Functioning - People limited in amount of work they can do (%)
Physical Functioning - People that need special equipment to walk (%)
Physical Functioning - People experiencing confusion/memory problems (%)
Physical Functioning - People requiring special healthcare equipment (%)
Prescription Medications - Average number of prescription medicines taking
Preventive Aspirin Use - Adults 40+ taking low-dose aspirin (%)
Reproductive Health - Vaginal deliveries (%)
Reproductive Health - Cesarean deliveries (%)
Reproductive Health - Deliveries resulted in a live birth (%)
Reproductive Health - Pregnancies resulted in a delivery (%)
Reproductive Health - Women breastfeeding newborns (%)
Reproductive Health - Women that had a hysterectomy (%)
Reproductive Health - Women that had both ovaries removed (%)
Reproductive Health - Women that have ever taken birth control pills (%)
Reproductive Health - Women taking birth control pills (%)
Reproductive Health - Women that have ever used Depo-Provera or injectables (%)
Reproductive Health - Women that have ever used female hormones (%)
Sexual Behavior - People 18+ that ever had sex (vaginal, anal, or oral) (%)
Sexual Behavior - Males 18+ that ever had vaginal sex with a woman (%)
Sexual Behavior - Males 18+ that ever performed oral sex on a woman (%)
Sexual Behavior - Males 18+ that ever had anal sex with a woman (%)
Sexual Behavior - Males 18+ that ever had any sex with a man (%)
Sexual Behavior - Females 18+ that ever had vaginal sex with a man (%)
Sexual Behavior - Females 18+ that ever performed oral sex on a man (%)
Sexual Behavior - Females 18+ that ever had anal sex with a man (%)
Sexual Behavior - Females 18+ that ever had any kind of sex with a woman (%)
Sexual Behavior - Average age people first had sex
Sexual Behavior - Average number of female sex partners in lifetime (males 18+)
Sexual Behavior - Average number of female vaginal sex partners in lifetime (males 18+)
Sexual Behavior - Average age people first performed oral sex on a woman (18+)
Sexual Behavior - Average number of woman performed oral sex on in lifetime (18+)
Sexual Behavior - Average number of male sex partners in lifetime (males 18+)
Sexual Behavior - Average number of male anal sex partners in lifetime (males 18+)
Sexual Behavior - Average age people first performed oral sex on a man (18+)
Sexual Behavior - Average number of male oral sex partners in lifetime (18+)
Sexual Behavior - People using protection when performing oral sex (%)
Sexual Behavior - Average number of times people have vaginal or anal sex a year
Sexual Behavior - People having sex without condom (%)
Sexual Behavior - Average number of male sex partners in lifetime (females 18+)
Sexual Behavior - Average number of male vaginal sex partners in lifetime (females 18+)
Sexual Behavior - Average number of female sex partners in lifetime (females 18+)
Sexual Behavior - Circumcised males 18+ (%)
Sleep Disorders - Average hours sleeping at night
Sleep Disorders - People that has trouble sleeping (%)
Smoking-Cigarette Use - People smoking cigarettes (%)
Taste & Smell - People 40+ having problems with smell (%)
Taste & Smell - People 40+ having problems with taste (%)
Taste & Smell - People 40+ that ever had wisdom teeth removed (%)
Taste & Smell - People 40+ that ever had tonsils teeth removed (%)
Taste & Smell - People 40+ that ever had a loss of consciousness because of a head injury (%)
Taste & Smell - People 40+ that ever had a broken nose or other serious injury to face or skull (%)
Taste & Smell - People 40+ that ever had two or more sinus infections (%)
Weight - Average height (inches)
Weight - Average weight (pounds)
Weight - Average BMI
Weight - People that are obese (%)
Weight - People that ever were obese (%)
Weight - People trying to lose weight (%)
Urban population: 8,200
Rural population: 18,241
Estimated median house/condo value in 2022: $311,181
27591:
$311,181North Carolina:
$280,600
According to our research of North Carolina and other state lists, there were 27 registered sex offenders living in 27591 zip code as of April 27, 2024 . The ratio of all residents to sex offenders in zip code 27591 is 736 to 1.The ratio of registered sex offenders to all residents in this zip code is lower than the state average.
Median resident age: This zip code:
39.2 yearsNorth Carolina median age:
39.2 years
Average household size: This zip code:
2.8 peopleNorth Carolina:
2.4 people
Averages for the 2020 tax year for zip code 27591, filed in 2021:
Average Adjusted Gross Income (AGI) in 2020: $63,884 (Individual Income Tax Returns) Here:
$63,884State:
$70,020
Salary/wage: $58,684 (reported on 84.1% of returns )Here:
$58,684State:
$58,387
(% of AGI for various income ranges: 1154.7% for AGIs below $25k , 3836.8% for AGIs $25k-50k , 7311.3% for AGIs $50k-75k , 10442.0% for AGIs $75k-100k , 20087.0% for AGIs $100k-200k , 74989.1% for AGIs over 200k ) Taxable interest for individuals: $727 (reported on 29.0% of returns )This zip code:
$727North Carolina:
$1,479
(% of AGI for various income ranges: 8.4% for AGIs below $25k , 14.0% for AGIs $25k-50k , 25.3% for AGIs $50k-75k , 30.9% for AGIs $75k-100k , 59.4% for AGIs $100k-200k , 723.6% for AGIs over 200k ) Ordinary dividends: $3,225 (reported on 13.1% of returns )(% of AGI for various income ranges: 14.3% for AGIs below $25k , 17.9% for AGIs $25k-50k , 40.1% for AGIs $50k-75k , 69.9% for AGIs $75k-100k , 150.1% for AGIs $100k-200k , 1499.1% for AGIs over 200k ) Net capital gain/loss in AGI: +$12,443 (reported on 12.2% of returns )Here:
+$12,443State:
+$23,652
(% of AGI for various income ranges: 8.3% for AGIs below $25k , 15.8% for AGIs $25k-50k , 45.7% for AGIs $50k-75k , 128.8% for AGIs $75k-100k , 293.1% for AGIs $100k-200k , 12026.4% for AGIs over 200k ) Profit/loss from business: +$9,634 (reported on 19.5% of returns )Here:
+$9,634State:
+$11,710
(% of AGI for various income ranges: 199.1% for AGIs below $25k , 222.8% for AGIs $25k-50k , 239.9% for AGIs $50k-75k , 304.0% for AGIs $75k-100k , 438.1% for AGIs $100k-200k , 1800.9% for AGIs over 200k ) Taxable individual retirement arrangement distribution: $18,924 (reported on 6.9% of returns )27591:
$18,924North Carolina:
$20,247
(% of AGI for various income ranges: 46.7% for AGIs below $25k , 60.6% for AGIs $25k-50k , 141.7% for AGIs $50k-75k , 253.4% for AGIs $75k-100k , 488.3% for AGIs $100k-200k , 3760.9% for AGIs over 200k ) Total itemized deductions: $29,503 (reported on 8.8% of returns )Here:
$29,503State:
$34,549
(% of AGI for various income ranges: 33.8% for AGIs below $25k , 110.6% for AGIs $25k-50k , 384.0% for AGIs $50k-75k , 514.6% for AGIs $75k-100k , 1071.5% for AGIs $100k-200k , 6675.5% for AGIs over 200k ) Charity contributions: $9,731 (reported on 7.2% of returns )(% of AGI for various income ranges: 4.9% for AGIs below $25k , 25.5% for AGIs $25k-50k , 78.8% for AGIs $50k-75k , 114.8% for AGIs $75k-100k , 325.4% for AGIs $100k-200k , 2094.5% for AGIs over 200k ) Taxes paid: $7,070 (reported on 8.8% of returns )(% of AGI for various income ranges: 4.1% for AGIs below $25k , 18.1% for AGIs $25k-50k , 86.7% for AGIs $50k-75k , 138.7% for AGIs $75k-100k , 316.9% for AGIs $100k-200k , 1238.2% for AGIs over 200k ) Earned income credit: $2,456 (reported on 16.4% of returns )(% of AGI for various income ranges: 115.5% for AGIs below $25k , 79.4% for AGIs $25k-50k , 1.5% for AGIs $50k-75k ) Percentage of individuals using paid preparers for their 2020 taxes: 92.2%(% for various income ranges: 91.0% for AGIs below $25k , 92.3% for AGIs $25k-50k , 91.4% for AGIs $50k-75k , 93.5% for AGIs $75k-100k , 94.4% for AGIs $100k-200k , 92.1% for AGIs over 200k )
Averages for the 2012 tax year for zip code 27591, filed in 2013:
Average Adjusted Gross Income (AGI) in 2012: $46,372 (Individual Income Tax Returns) Here:
$46,372State:
$54,937
Salary/wage: $42,156 (reported on 86.2% of returns )Here:
$42,156State:
$46,336
(% of AGI for various income ranges: 75.0% for AGIs below $25k , 83.9% for AGIs $25k-50k , 80.5% for AGIs $50k-75k , 80.3% for AGIs $75k-100k , 80.4% for AGIs $100k-200k , 55.9% for AGIs over 200k ) Taxable interest for individuals: $696 (reported on 31.9% of returns )This zip code:
$696North Carolina:
$1,298
(% of AGI for various income ranges: 0.6% for AGIs below $25k , 0.4% for AGIs $25k-50k , 0.5% for AGIs $50k-75k , 0.4% for AGIs $75k-100k , 0.5% for AGIs $100k-200k , 0.7% for AGIs over 200k ) Ordinary dividends: $2,444 (reported on 12.1% of returns )(% of AGI for various income ranges: 0.6% for AGIs below $25k , 0.3% for AGIs $25k-50k , 0.4% for AGIs $50k-75k , 0.5% for AGIs $75k-100k , 0.9% for AGIs $100k-200k , 1.5% for AGIs over 200k ) Net capital gain/loss in AGI: +$4,927 (reported on 9.8% of returns )Here:
+$4,927State:
+$12,740
(% of AGI for various income ranges: 0.2% for AGIs below $25k , 0.2% for AGIs $25k-50k , 0.3% for AGIs $50k-75k , 1.0% for AGIs $75k-100k , 1.0% for AGIs $100k-200k , 5.9% for AGIs over 200k ) Profit/loss from business: +$7,184 (reported on 17.7% of returns )Here:
+$7,184State:
+$10,311
(% of AGI for various income ranges: 9.0% for AGIs below $25k , 2.9% for AGIs $25k-50k , 0.9% for AGIs $50k-75k , 1.7% for AGIs $75k-100k , 2.6% for AGIs $100k-200k , 0.8% for AGIs over 200k ) Taxable individual retirement arrangement distribution: $11,513 (reported on 7.8% of returns )27591:
$11,513North Carolina:
$15,575
(% of AGI for various income ranges: 2.1% for AGIs below $25k , 1.5% for AGIs $25k-50k , 1.9% for AGIs $50k-75k , 2.2% for AGIs $75k-100k , 2.9% for AGIs $100k-200k ) Self-employment retirement plans: $15,100 (reported on 0.2% of returns )27591:
$15,100North Carolina:
$21,078
Total itemized deductions: $19,202 (24% of AGI, reported on 35.9% of returns )Here:
$19,202State:
$23,438
Here:
24.3% of AGIState:
21.5% of AGI
(% of AGI for various income ranges: 10.1% for AGIs below $25k , 13.5% for AGIs $25k-50k , 14.5% for AGIs $50k-75k , 17.0% for AGIs $75k-100k , 17.1% for AGIs $100k-200k , 15.0% for AGIs over 200k ) Charity contributions: $4,145 (reported on 29.5% of returns )(% of AGI for various income ranges: 1.0% for AGIs below $25k , 1.8% for AGIs $25k-50k , 2.3% for AGIs $50k-75k , 2.9% for AGIs $75k-100k , 3.4% for AGIs $100k-200k , 4.8% for AGIs over 200k ) Taxes paid: $6,236 (reported on 35.6% of returns )(% of AGI for various income ranges: 1.4% for AGIs below $25k , 3.2% for AGIs $25k-50k , 4.3% for AGIs $50k-75k , 5.8% for AGIs $75k-100k , 6.8% for AGIs $100k-200k , 6.8% for AGIs over 200k ) Earned income credit: $2,446 (reported on 22.8% of returns )(% of AGI for various income ranges: 8.2% for AGIs below $25k , 1.4% for AGIs $25k-50k ) Percentage of individuals using paid preparers for their 2012 taxes: 50.1%(% for various income ranges: 48.2% for AGIs below $25k , 49.4% for AGIs $25k-50k , 50.4% for AGIs $50k-75k , 53.4% for AGIs $75k-100k , 52.7% for AGIs $100k-200k , 80.0% for AGIs over 200k )
Averages for the 2004 tax year for zip code 27591, filed in 2005:
Average Adjusted Gross Income (AGI) in 2004: $40,581 (Individual Income Tax Returns) Here:
$40,581State:
$45,376
Salary/wage: $37,467 (reported on 88.0% of returns )Here:
$37,467State:
$39,442
(% of AGI for various income ranges: 115.9% for AGIs below $10k , 81.9% for AGIs $10k-25k , 87.0% for AGIs $25k-50k , 85.3% for AGIs $50k-75k , 86.0% for AGIs $75k-100k , 65.6% for AGIs over 100k ) Taxable interest for individuals: $1,178 (reported on 37.4% of returns )This zip code:
$1,178North Carolina:
$1,515
(% of AGI for various income ranges: 4.6% for AGIs below $10k , 1.1% for AGIs $10k-25k , 0.5% for AGIs $25k-50k , 0.7% for AGIs $50k-75k , 0.4% for AGIs $75k-100k , 2.3% for AGIs over 100k ) Taxable dividends: $1,550 (reported on 14.6% of returns )(% of AGI for various income ranges: 2.3% for AGIs below $10k , 0.4% for AGIs $10k-25k , 0.5% for AGIs $25k-50k , 0.4% for AGIs $50k-75k , 0.5% for AGIs $75k-100k , 0.8% for AGIs over 100k ) Net capital gain/loss: +$8,937 (reported on 11.8% of returns )Here:
+$8,937State:
+$11,152
(% of AGI for various income ranges: -0.9% for AGIs below $10k , -0.1% for AGIs $10k-25k , 0.4% for AGIs $25k-50k , 0.8% for AGIs $50k-75k , 1.1% for AGIs $75k-100k , 9.1% for AGIs over 100k ) Profit/loss from business: +$6,128 (reported on 16.8% of returns )Here:
+$6,128State:
+$9,490
(% of AGI for various income ranges: -2.1% for AGIs below $10k , 4.8% for AGIs $10k-25k , 2.2% for AGIs $25k-50k , 2.0% for AGIs $50k-75k , 1.8% for AGIs $75k-100k , 3.2% for AGIs over 100k ) IRA payment deduction: $2,731 (reported on 2.0% of returns )27591:
$2,731North Carolina:
$2,967
(% of AGI for various income ranges: 0.1% for AGIs $10k-25k , 0.1% for AGIs $25k-50k , 0.1% for AGIs $50k-75k , 0.1% for AGIs $75k-100k , 0.2% for AGIs over 100k ) Self-employed pension: $11,190 (reported on 0.3% of returns )Here:
$11,190North Carolina:
$14,754
Total itemized deductions: $16,282 (25% of AGI, reported on 41.4% of returns )Here:
$16,282State:
$19,464
Here:
24.8% of AGIState:
22.7% of AGI
(% of AGI for various income ranges: 14.9% for AGIs below $10k , 11.0% for AGIs $10k-25k , 16.4% for AGIs $25k-50k , 18.6% for AGIs $50k-75k , 18.9% for AGIs $75k-100k , 16.0% for AGIs over 100k ) Charity contributions deductions: $3,449 (5% of AGI, reported on 35.9% of returns )Here:
5.0% of AGIState:
4.5% of AGI
(% of AGI for various income ranges: 1.4% for AGIs below $10k , 1.5% for AGIs $10k-25k , 2.6% for AGIs $25k-50k , 3.4% for AGIs $50k-75k , 3.8% for AGIs $75k-100k , 3.5% for AGIs over 100k ) Total tax: $5,082 (reported on 71.8% of returns )(% of AGI for various income ranges: 3.6% for AGIs below $10k , 3.5% for AGIs $10k-25k , 5.8% for AGIs $25k-50k , 7.8% for AGIs $50k-75k , 9.6% for AGIs $75k-100k , 15.8% for AGIs over 100k ) Earned income credit: $1,886 (reported on 19.4% of returns )Percentage of individuals using paid preparers for their 2004 taxes: 58.7%(% for various income ranges: 53.5% for AGIs below $10k , 63.7% for AGIs $10k-25k , 57.0% for AGIs $25k-50k , 59.2% for AGIs $50k-75k , 58.5% for AGIs $75k-100k , 60.0% for AGIs over 100k )
Estimated median household income in 2022: This zip code:
$80,913North Carolina:
$67,481
Nearest zip codes: 27545 ,
27597 ,
27527 ,
27571 ,
27610 ,
27604 .
Wendell Zip Code Map
Percentage of family households: This zip code:
54.4%North Carolina:
46.1%
Percentage of households with unmarried partners: This zip code:
6.7%North Carolina:
47.9%
Likely homosexual households (counted as self-reported same-sex unmarried-partner households)
Lesbian couples: 0.2% of all households Gay men: 0.0% of all households
Household received Food Stamps/SNAP in the past 12 months: 880Household did not receive Food Stamps/SNAP in the past 12 months: 8,346
Women who had a birth in the past 12 months: 298 (223 now married , 76 unmarried) Women who did not have a birth in the past 12 months: 5,470 (3,022 now married , 2,462 unmarried)
Housing units in zip code 27591 with a mortgage: 4,949 (349
second mortgage , 11
home equity loan , 337
both second mortgage and home equity loan )
Houses without a mortgage: 82
Median monthly owner costs for units with a mortgage: $1,568
Median monthly owner costs for units without a mortgage: $480
Residents with income below the poverty level in 2022:
This zip code:
6.4%Whole state:
12.8%
Residents with income below 50% of the poverty level in 2022:
This zip code:
3.1%Whole state:
6.8%
Median number of rooms in houses and condos: Median number of rooms in apartments: Notable locations in this zip code not listed on our city pages
Click to draw/clear zip code borders Churches in zip code 27591 include: (A) , Lees Crossroad Church (B) , Bethany Church (C) , New Bethel Church (D) , Central Church (E) , Clydes Chapel (F) , Pleasant Grove Church (G) , Salem Church (H) , Tabernacle Church (I) . Display/hide their locations on the map
Cemeteries: (1) , Woodard Cemetery (2) , Pleasant Grove Cemetery (3) , Whitley Cemetery (4) , Hocutt Cemetery (5) . Display/hide their locations on the map
Reservoirs and swamps: (A) , Lake Andrew Acres (B) , Carolina Lake (C) , Wendell Lake (D) , Lake Johnson (E) , Hammonds Pond (F) , Lu-Tom Acres Lake (G) , Buffalo Creek Cypress Swamp (H) . Display/hide their locations on the map
Streams, rivers, and creeks: (A) , Hominy Creek (B) . Display/hide their locations on the map
Year house built (houses)
272 2020 or later2,607 2010 to 20191,619 2000 to 20091,037 1990 to 19991,428 1980 to 19891,076 1970 to 1979542 1960 to 1969499 1950 to 1959195 1940 to 1949519 1939 or earlier
Zip code 27591 household income distribution in 2022 148 Less than $10,000219 $10,000 to $14,999207 $15,000 to $19,999225 $20,000 to $24,999207 $25,000 to $29,999184 $30,000 to $34,999641 $35,000 to $39,999437 $40,000 to $44,999360 $45,000 to $49,999679 $50,000 to $59,9991,088 $60,000 to $74,9991,243 $75,000 to $99,9991,245 $100,000 to $124,999793 $125,000 to $149,9991,072 $150,000 to $199,999546 $200,000 or moreEstimate of home value of owner-occupied houses/condos in 2022 in zip code 27591 264 Less than $10,00064 $10,000 to $14,99955 $15,000 to $19,99913 $20,000 to $24,99916 $25,000 to $29,99925 $35,000 to $39,99928 $40,000 to $49,999114 $50,000 to $59,99990 $60,000 to $69,99921 $70,000 to $79,99945 $80,000 to $89,99972 $90,000 to $99,999165 $100,000 to $124,999363 $125,000 to $149,999208 $150,000 to $174,999427 $175,000 to $199,999794 $200,000 to $249,999861 $250,000 to $299,9991,902 $300,000 to $399,999877 $400,000 to $499,999723 $500,000 to $749,999102 $1,000,000 to $1,499,99915 $1,500,000 to $1,999,999Rent paid by renters in 2022 in zip code 27591 46 $100 to $1496 $200 to $24979 $250 to $29948 $350 to $39911 $450 to $49923 $500 to $54924 $550 to $599185 $600 to $649206 $650 to $699116 $700 to $74910 $750 to $799152 $800 to $899196 $900 to $999402 $1,000 to $1,24996 $1,250 to $1,499130 $1,500 to $1,99963 $2,000 to $2,49937 $2,500 to $2,999164 No cash rent
Median gross rent in 2022: $1,113.
Median price asked for vacant for-sale houses and condos in 2022: $999,438.
Estimated median house (or condo) value in 2022 for: White Non-Hispanic householders: $351,811Black or African American householders: $293,444American Indian or Alaska Native householders: $155,751Asian householders: $470,156Some other race householders: $295,702Two or more races householders: $346,651Hispanic or Latino householders: $318,597Estimated median house or condo value in 2022: $311,181
27591:
$311,181North Carolina:
$280,600
Lower value quartile - upper value quartile: $186,750 - $431,758
Mean price in 2022: Detached houses: $151,751Here:
$151,751State:
$375,326
Housing units in structures:
One, detached: 7,870One, attached: 62Two: 3043 or 4: 115 to 9: 2410 to 19: 1420 to 49: 6550 or more: 159Mobile homes: 1,143Unemployment : 1.5%
Means of transportation to work in zip code 27591 70.1% 9,792 Drove a car alone6.5% 902 Carpooled0.3% 42 Walked0.9% 127 Other means24.6% 3,432 Worked at homeTravel time to work (commute) in zip code 27591 135 Less than 5 minutes525 5 to 9 minutes629 10 to 14 minutes1,155 15 to 19 minutes1,404 20 to 24 minutes1,142 25 to 29 minutes2,559 30 to 34 minutes702 35 to 39 minutes623 40 to 44 minutes1,030 45 to 59 minutes700 60 to 89 minutes241 90 or more minutes
Neighborhoods in zip code 27591: Percentage of zip code residents living and working in this county: 78.2%
Household type by relationship:
Households: 26,442
Male householders: 4,556 (705 living alone ), Female householders: 4,702 (1,145 living alone )5,671 spouses (5,504 opposite-sex spouses ), 631 unmarried partners , (631 opposite-sex unmarried partners ), 8,058 children (7,309 natural , 313 adopted , 432 stepchildren ), 440 grandchildren , 175 brothers or sisters , 940 parents , 244 foster children , 512 other relatives , 352 non-relatives In group quarters: 82 (-1 institutionalized population )
Size of family households: 2,902 2-persons , 1,713 3-persons , 1,305 4-persons , 441 5-persons , 368 6-persons , 104 7-or-more-persons
Size of nonfamily households: 1,848 1-person , 398 2-persons , 172 3-persons
4,502 married couples with children. single-parent households (295 men , 664 women ).
79.9% of residents of 27591 zip code speak English at home. of residents speak Spanish at home (57% very well, 20% well, 12% not well, 11% not at all ).of residents speak other Indo-European language at home (77% very well, 9% well, 13% not well ).of residents speak Asian or Pacific Island language at home (42% very well, 58% well ).of residents speak other language at home (62% very well, 38% well ).
Foreign born population: 3,110 (11.8%)
(30.8%
of them are naturalized citizens )
This zip code:
11.8%Whole state:
8.6%
42% Honduras 18% Costa Rica 4% Dominica 3% Guatemala 3% Malaysia 3% Chile 2% Togo 10% American 7% English 5% Irish 4% German 2% African 2% European 2% Scotch-Irish
Year of entry for the foreign-born population
1,082 2010 or later 1,165 2000 to 2009 680 1990 to 1999 472 Before 1990
Facilities with environmental interests located in this zip code:
CARVER ELEMENTARY (291 LILES-DEAN RD in WENDELL, NC)
(National Center for Education Statistics) - STATE ID-362 Organizations: WAKE COUNTY SCHOOLS (SCHOOL DISTRICT)
BARNES COLLISION REPAIR CENTER (106A N MAIN ST in WENDELL, NC)
(Resource Conservation and Recovery Act (tracking hazardous waste)) Organizations: CHARLES M BARNES (CONTACT/OWNER)
Housing units lacking complete plumbing facilities: 1.0%
Housing units lacking complete kitchen facilities: 0.7%
70.8% Electricity 15.9% Utility gas 11.8% Bottled, tank, or LP gas 0.8% Fuel oil, kerosene, etc.
Population in 1990: 12,418. Population change in the 1990s: +2,921 (+23.5%).
Place of birth for U.S.-born residents:
This state: 14,867Northeast: 3,198Midwest: 1,166South: 2,720West: 1,036
56% of the 27591 zip code residents lived in the same house 5 years ago.
Out of people who lived in different houses, 60% lived in this county.
Out of people who lived in different counties, 50% lived in North Carolina.
90% of the 27591 zip code residents lived in the same house 1 year ago.
Out of people who lived in different houses, 55% moved from this county.
Out of people who lived in different houses, 21% moved from different county within same state.
Out of people who lived in different houses, 21% moved from different state.
Out of people who lived in different houses, 1% moved from abroad.
Private vs. public school enrollment:
Students in private schools in grades 1 to 8 (elementary and middle school): 274
Here:
11.0%North Carolina:
13.8%
Students in private schools in grades 9 to 12 (high school): 120
Here:
7.3%North Carolina:
11.9%
Students in private undergraduate colleges: 188
Here:
22.1%North Carolina:
19.3%
Occupation by median earnings in the past 12 months ($)
119,918 Life, physical, and social science occupations 96,893 Computer and mathematical occupations 88,003 Architecture and engineering occupations 87,489 Management occupations 76,076 Business and financial operations occupations 71,447 Fire fighting and prevention, and other protective service workers including supervisors
Companies with federal contracts located in this zip code:
BLUE SKY FARMS NC INC (249 MUDHAM RD in WENDELL, NC; small business) in 37 contracts from 2005 to 2006
Contracts for Fruits and Vegetables by Defense Logistics AgencySigned by year: 2000: $0; 2001: $0; 2002: $0; 2003: $0; 2004: $0; 2005: $62,099; 2006: $80,641.
Biggest contracts: with Defense Logistics Agency for Fruits and Vegetables. Signed on 2006-02-05. Completion date: 2006-02-05.
, same as above. Signed on 2005-09-29. Completion date: 2005-09-29.
, same as above. Signed on 2006-01-23. Completion date: 2006-01-23.
, same as above. Signed on 2005-10-07. Completion date: 2005-10-07.
SOUTHAG DISTRIBUTING INCORPORATED (2023 WENDELL BOULEVARD in WENDELL, NC; small business) employees , $888000 revenue : $9,102 in 2 contracts in 2006
$5,495 with Bureau of Prisoners/Federal Prison System for . Signed on 2006-05-11. Completion date: 2006-05-17.
, same as above. Signed on 2006-07-14. Completion date: 2006-07-30.
H P M APPAREL INC (115 E 3RD ST in WENDELL, NC; small business)
$3,999 with Navy for Clothing, Special Purpose. Signed on 2005-09-29. Completion date: 2005-11-15.
Top industries in this zip code by the number of employees in 2005:
Other Services (except Public Administration): Other Electronic and Precision Equipment Repair and Maintenance (100-249 employees: 1 establishment)Construction: Plumbing, Heating, and Air-Conditioning Contractors (20-49: 2, 10-19: 1, 5-9: 5, 1-4: 6)Management of Companies and Enterprises: Corporate, Subsidiary, and Regional Managing Offices (50-99: 1)Educational Services: Colleges, Universities, and Professional Schools (50-99: 1)Administrative and Support and Waste Management and Remediation Services: Landscaping Services (20-49: 1, 10-19: 1, 1-4: 11)
People in group quarters in 2010:
101 people in college/university student housing
10 people in group homes intended for adults
3 people in residential treatment centers for juveniles (non-correctional)
3 people in workers' group living quarters and job corps centers
People in group quarters in 2000:
67 people in other noninstitutional group quarters
Fatal accident statistics in 2014:
Fatal accident count: 3Vehicles involved in fatal accidents: 4Fatal accidents caused by drunken drivers: 1Fatalities: 3Persons involved in fatal accidents: 6Pedestrians involved in fatal accidents: 0
Fatal accident statistics in 2013:
Fatal accident count: 5Vehicles involved in fatal accidents: 9Fatal accidents caused by drunken drivers: 0Fatalities: 7Persons involved in fatal accidents: 18Pedestrians involved in fatal accidents: 1
Home Mortgage Disclosure Act Aggregated Statistics For Year 2009(Based on 2 full and 10 partial tracts) A) FHA, FSA/RHS & VA B) Conventional C) Refinancings D) Home Improvement Loans F) Non-occupant Loans on G) Loans On Manufactured Number Average Value Number Average Value Number Average Value Number Average Value Number Average Value Number Average Value
LOANS ORIGINATED 371 $152,543 232 $164,305 1,068 $169,250 30 $77,421 55 $113,940 51 $80,501 APPLICATIONS APPROVED, NOT ACCEPTED 12 $126,061 12 $146,922 74 $183,862 12 $44,860 3 $69,067 6 $86,045 APPLICATIONS DENIED 69 $152,943 51 $131,084 334 $152,667 50 $32,699 20 $79,370 29 $79,202 APPLICATIONS WITHDRAWN 39 $161,553 37 $212,145 256 $167,726 9 $67,327 13 $133,178 7 $92,360 FILES CLOSED FOR INCOMPLETENESS 9 $137,941 6 $129,493 63 $170,127 4 $26,798 2 $56,045 2 $67,600
Aggregated Statistics For Year 2008(Based on 2 full and 10 partial tracts) A) FHA, FSA/RHS & VA B) Conventional C) Refinancings D) Home Improvement Loans E) Loans on Dwellings For 5+ Families F) Non-occupant Loans on G) Loans On Manufactured Number Average Value Number Average Value Number Average Value Number Average Value Number Average Value Number Average Value Number Average Value
LOANS ORIGINATED 294 $155,389 452 $175,383 737 $154,738 59 $80,680 5 $375,166 93 $133,474 72 $87,998 APPLICATIONS APPROVED, NOT ACCEPTED 7 $183,089 37 $167,072 93 $137,873 19 $75,247 0 $0 5 $114,004 10 $88,266 APPLICATIONS DENIED 34 $167,972 64 $144,328 459 $145,489 157 $77,360 0 $0 25 $98,777 54 $77,659 APPLICATIONS WITHDRAWN 39 $164,692 52 $175,207 185 $158,344 14 $101,656 0 $0 8 $148,342 23 $92,254 FILES CLOSED FOR INCOMPLETENESS 6 $161,610 10 $165,768 33 $176,283 1 $75,060 0 $0 2 $94,435 2 $101,260
Aggregated Statistics For Year 2007(Based on 2 full and 10 partial tracts) A) FHA, FSA/RHS & VA B) Conventional C) Refinancings D) Home Improvement Loans E) Loans on Dwellings For 5+ Families F) Non-occupant Loans on G) Loans On Manufactured Number Average Value Number Average Value Number Average Value Number Average Value Number Average Value Number Average Value Number Average Value
LOANS ORIGINATED 153 $136,645 912 $144,402 684 $134,952 82 $60,575 2 $2,793,590 192 $98,349 86 $80,146 APPLICATIONS APPROVED, NOT ACCEPTED 12 $144,860 76 $153,731 125 $132,243 23 $31,227 0 $0 11 $95,506 13 $72,492 APPLICATIONS DENIED 27 $139,762 146 $117,467 695 $128,561 155 $69,164 0 $0 55 $106,053 78 $84,295 APPLICATIONS WITHDRAWN 11 $133,076 96 $143,693 266 $144,914 27 $101,489 0 $0 47 $97,102 12 $89,008 FILES CLOSED FOR INCOMPLETENESS 0 $0 30 $133,925 61 $148,713 2 $441,235 0 $0 4 $86,275 0 $0
Aggregated Statistics For Year 2006(Based on 2 full and 10 partial tracts) A) FHA, FSA/RHS & VA B) Conventional C) Refinancings D) Home Improvement Loans F) Non-occupant Loans on G) Loans On Manufactured Number Average Value Number Average Value Number Average Value Number Average Value Number Average Value Number Average Value
LOANS ORIGINATED 128 $138,258 1,257 $118,371 778 $111,913 102 $51,853 280 $92,081 66 $75,612 APPLICATIONS APPROVED, NOT ACCEPTED 7 $130,826 129 $111,316 161 $116,163 22 $33,289 40 $68,696 23 $53,391 APPLICATIONS DENIED 22 $126,797 251 $99,697 622 $120,697 172 $63,848 61 $94,600 75 $67,458 APPLICATIONS WITHDRAWN 13 $130,751 133 $116,217 268 $126,790 24 $83,542 52 $98,111 14 $78,761 FILES CLOSED FOR INCOMPLETENESS 3 $111,610 25 $110,694 81 $142,400 4 $67,310 6 $102,800 0 $0
Aggregated Statistics For Year 2005(Based on 2 full and 10 partial tracts) A) FHA, FSA/RHS & VA B) Conventional C) Refinancings D) Home Improvement Loans E) Loans on Dwellings For 5+ Families F) Non-occupant Loans on G) Loans On Manufactured Number Average Value Number Average Value Number Average Value Number Average Value Number Average Value Number Average Value Number Average Value
LOANS ORIGINATED 167 $130,740 1,061 $113,379 747 $109,387 65 $46,287 2 $133,920 188 $87,038 93 $66,992 APPLICATIONS APPROVED, NOT ACCEPTED 11 $119,386 133 $95,847 162 $107,326 16 $40,116 0 $0 14 $101,046 28 $55,256 APPLICATIONS DENIED 20 $138,070 180 $97,719 739 $117,053 175 $50,884 0 $0 54 $86,725 110 $75,191 APPLICATIONS WITHDRAWN 8 $107,118 121 $104,172 312 $123,978 45 $119,099 0 $0 34 $103,269 33 $71,565 FILES CLOSED FOR INCOMPLETENESS 8 $110,911 34 $106,676 119 $127,766 5 $50,512 0 $0 3 $84,293 9 $75,922
Aggregated Statistics For Year 2004(Based on 2 full and 10 partial tracts) A) FHA, FSA/RHS & VA B) Conventional C) Refinancings D) Home Improvement Loans E) Loans on Dwellings For 5+ Families F) Non-occupant Loans on G) Loans On Manufactured Number Average Value Number Average Value Number Average Value Number Average Value Number Average Value Number Average Value Number Average Value
LOANS ORIGINATED 181 $121,827 785 $116,167 821 $120,585 66 $51,343 2 $1,633,200 157 $88,391 93 $69,535 APPLICATIONS APPROVED, NOT ACCEPTED 10 $105,932 103 $93,708 165 $111,655 13 $26,220 0 $0 21 $77,497 48 $44,550 APPLICATIONS DENIED 42 $114,792 191 $84,161 768 $104,972 87 $40,164 0 $0 44 $72,248 154 $67,668 APPLICATIONS WITHDRAWN 16 $130,559 98 $117,187 322 $116,240 6 $96,798 0 $0 28 $99,100 24 $87,835 FILES CLOSED FOR INCOMPLETENESS 9 $118,741 19 $111,756 81 $118,684 6 $33,417 0 $0 1 $82,250 4 $81,778
Aggregated Statistics For Year 2003(Based on 2 full and 10 partial tracts) A) FHA, FSA/RHS & VA B) Conventional C) Refinancings D) Home Improvement Loans E) Loans on Dwellings For 5+ Families F) Non-occupant Loans on Number Average Value Number Average Value Number Average Value Number Average Value Number Average Value Number Average Value
LOANS ORIGINATED 183 $121,418 623 $119,571 1,828 $120,716 47 $33,152 2 $148,685 182 $86,223 APPLICATIONS APPROVED, NOT ACCEPTED 10 $112,521 76 $99,402 219 $113,820 11 $29,782 2 $148,685 16 $80,213 APPLICATIONS DENIED 31 $110,266 224 $79,367 673 $102,881 84 $26,867 0 $0 71 $106,450 APPLICATIONS WITHDRAWN 25 $116,408 77 $109,773 302 $104,317 9 $21,794 0 $0 18 $80,918 FILES CLOSED FOR INCOMPLETENESS 7 $119,023 13 $101,766 65 $113,098 4 $35,122 0 $0 1 $121,660
Aggregated Statistics For Year 2002(Based on 2 full and 8 partial tracts) A) FHA, FSA/RHS & VA B) Conventional C) Refinancings D) Home Improvement Loans E) Loans on Dwellings For 5+ Families F) Non-occupant Loans on Number Average Value Number Average Value Number Average Value Number Average Value Number Average Value Number Average Value
LOANS ORIGINATED 251 $117,714 487 $116,307 1,232 $114,634 57 $26,131 4 $185,698 102 $76,292 APPLICATIONS APPROVED, NOT ACCEPTED 7 $123,474 90 $81,878 198 $99,841 10 $34,052 0 $0 14 $78,219 APPLICATIONS DENIED 17 $120,098 212 $65,572 413 $87,231 38 $20,384 0 $0 21 $50,643 APPLICATIONS WITHDRAWN 18 $113,762 32 $115,518 220 $98,442 19 $36,811 0 $0 3 $80,710 FILES CLOSED FOR INCOMPLETENESS 12 $108,774 15 $133,835 60 $106,695 0 $0 0 $0 2 $75,365
Aggregated Statistics For Year 2001(Based on 2 full and 8 partial tracts) A) FHA, FSA/RHS & VA B) Conventional C) Refinancings D) Home Improvement Loans F) Non-occupant Loans on Number Average Value Number Average Value Number Average Value Number Average Value Number Average Value
LOANS ORIGINATED 351 $115,605 406 $101,449 1,135 $105,549 82 $32,045 89 $67,046 APPLICATIONS APPROVED, NOT ACCEPTED 7 $108,493 100 $55,380 152 $93,385 14 $21,523 10 $46,435 APPLICATIONS DENIED 30 $110,224 264 $55,625 421 $86,140 65 $20,979 21 $57,246 APPLICATIONS WITHDRAWN 24 $120,390 51 $99,756 228 $98,126 23 $16,534 7 $104,020 FILES CLOSED FOR INCOMPLETENESS 4 $127,925 10 $113,382 45 $97,743 3 $27,063 2 $32,505
Aggregated Statistics For Year 2000(Based on 2 full and 8 partial tracts) A) FHA, FSA/RHS & VA B) Conventional C) Refinancings D) Home Improvement Loans F) Non-occupant Loans on Number Average Value Number Average Value Number Average Value Number Average Value Number Average Value
LOANS ORIGINATED 318 $112,960 397 $101,595 332 $87,412 60 $17,322 38 $65,552 APPLICATIONS APPROVED, NOT ACCEPTED 29 $58,139 82 $61,099 100 $78,442 16 $22,293 5 $50,860 APPLICATIONS DENIED 62 $83,340 325 $57,787 322 $80,300 84 $18,347 9 $51,394 APPLICATIONS WITHDRAWN 18 $101,528 44 $91,327 150 $77,183 8 $25,462 1 $57,290 FILES CLOSED FOR INCOMPLETENESS 6 $125,003 10 $126,166 47 $92,507 0 $0 5 $56,186
Aggregated Statistics For Year 1999(Based on 1 full and 5 partial tracts) A) FHA, FSA/RHS & VA B) Conventional C) Refinancings D) Home Improvement Loans F) Non-occupant Loans on Number Average Value Number Average Value Number Average Value Number Average Value Number Average Value
LOANS ORIGINATED 193 $106,942 249 $96,366 311 $85,458 38 $21,560 34 $58,761 APPLICATIONS APPROVED, NOT ACCEPTED 2 $107,240 59 $64,140 96 $71,348 11 $19,219 7 $49,881 APPLICATIONS DENIED 19 $112,581 210 $55,701 216 $74,828 38 $17,081 17 $67,810 APPLICATIONS WITHDRAWN 11 $115,325 34 $90,523 109 $76,933 5 $39,086 5 $59,278 FILES CLOSED FOR INCOMPLETENESS 6 $104,445 19 $82,578 30 $88,170 0 $0 0 $0
Private Mortgage Insurance Companies Aggregated Statistics For Year 2009(Based on 2 full and 10 partial tracts) A) Conventional B) Refinancings C) Non-occupant Loans on Number Average Value Number Average Value Number Average Value
LOANS ORIGINATED 36 $187,716 44 $202,329 4 $116,100 APPLICATIONS APPROVED, NOT ACCEPTED 13 $244,985 18 $196,327 0 $0 APPLICATIONS DENIED 6 $179,490 11 $274,115 0 $0 APPLICATIONS WITHDRAWN 1 $134,600 6 $237,153 0 $0 FILES CLOSED FOR INCOMPLETENESS 0 $0 0 $0 0 $0
Aggregated Statistics For Year 2008(Based on 2 full and 10 partial tracts) A) Conventional B) Refinancings C) Non-occupant Loans on D) Loans On Manufactured Number Average Value Number Average Value Number Average Value Number Average Value
LOANS ORIGINATED 162 $195,290 72 $190,341 23 $141,412 2 $84,900 APPLICATIONS APPROVED, NOT ACCEPTED 47 $185,975 38 $212,552 5 $117,486 0 $0 APPLICATIONS DENIED 17 $150,551 4 $148,185 11 $132,089 0 $0 APPLICATIONS WITHDRAWN 7 $192,543 4 $256,752 2 $119,705 0 $0 FILES CLOSED FOR INCOMPLETENESS 2 $271,830 0 $0 0 $0 0 $0
Aggregated Statistics For Year 2007(Based on 2 full and 10 partial tracts) A) Conventional B) Refinancings C) Non-occupant Loans on D) Loans On Manufactured Number Average Value Number Average Value Number Average Value Number Average Value
LOANS ORIGINATED 282 $161,736 92 $183,957 28 $113,146 1 $106,770 APPLICATIONS APPROVED, NOT ACCEPTED 27 $180,195 26 $174,478 2 $133,520 0 $0 APPLICATIONS DENIED 3 $130,180 3 $136,450 2 $60,430 2 $60,430 APPLICATIONS WITHDRAWN 3 $254,230 6 $204,062 0 $0 0 $0 FILES CLOSED FOR INCOMPLETENESS 2 $219,365 0 $0 0 $0 0 $0
Aggregated Statistics For Year 2006(Based on 2 full and 10 partial tracts) A) Conventional B) Refinancings C) Non-occupant Loans on D) Loans On Manufactured Number Average Value Number Average Value Number Average Value Number Average Value
LOANS ORIGINATED 166 $154,162 67 $140,976 35 $113,931 3 $84,397 APPLICATIONS APPROVED, NOT ACCEPTED 10 $150,822 6 $190,212 1 $123,790 0 $0 APPLICATIONS DENIED 3 $163,613 0 $0 1 $187,480 0 $0 APPLICATIONS WITHDRAWN 5 $203,044 5 $185,284 0 $0 0 $0 FILES CLOSED FOR INCOMPLETENESS 1 $92,630 0 $0 0 $0 0 $0
Aggregated Statistics For Year 2005(Based on 2 full and 10 partial tracts) A) Conventional B) Refinancings C) Non-occupant Loans on D) Loans On Manufactured Number Average Value Number Average Value Number Average Value Number Average Value
LOANS ORIGINATED 113 $137,828 69 $147,173 11 $98,108 3 $60,410 APPLICATIONS APPROVED, NOT ACCEPTED 16 $146,637 14 $150,941 4 $108,955 0 $0 APPLICATIONS DENIED 0 $0 0 $0 0 $0 0 $0 APPLICATIONS WITHDRAWN 6 $188,220 2 $142,170 1 $109,210 0 $0 FILES CLOSED FOR INCOMPLETENESS 1 $115,430 0 $0 0 $0 0 $0
Aggregated Statistics For Year 2004(Based on 2 full and 10 partial tracts) A) Conventional B) Refinancings C) Non-occupant Loans on D) Loans On Manufactured Number Average Value Number Average Value Number Average Value Number Average Value
LOANS ORIGINATED 111 $134,563 64 $131,273 19 $88,229 3 $68,857 APPLICATIONS APPROVED, NOT ACCEPTED 17 $130,898 26 $118,990 8 $105,070 1 $132,200 APPLICATIONS DENIED 4 $76,228 2 $103,405 0 $0 0 $0 APPLICATIONS WITHDRAWN 4 $128,230 7 $122,251 3 $138,553 0 $0 FILES CLOSED FOR INCOMPLETENESS 4 $72,942 1 $135,850 0 $0 2 $78,910
Aggregated Statistics For Year 2003(Based on 2 full and 10 partial tracts) A) Conventional B) Refinancings C) Non-occupant Loans on Number Average Value Number Average Value Number Average Value
LOANS ORIGINATED 148 $128,214 250 $135,450 32 $93,203 APPLICATIONS APPROVED, NOT ACCEPTED 19 $124,018 54 $133,989 7 $77,629 APPLICATIONS DENIED 6 $106,388 9 $122,594 0 $0 APPLICATIONS WITHDRAWN 3 $190,710 19 $151,846 1 $88,070 FILES CLOSED FOR INCOMPLETENESS 0 $0 2 $94,370 0 $0
Aggregated Statistics For Year 2002(Based on 2 full and 8 partial tracts) A) Conventional B) Refinancings C) Non-occupant Loans on Number Average Value Number Average Value Number Average Value
LOANS ORIGINATED 144 $128,088 186 $123,096 21 $85,870 APPLICATIONS APPROVED, NOT ACCEPTED 26 $123,294 40 $119,480 0 $0 APPLICATIONS DENIED 1 $151,450 3 $202,177 0 $0 APPLICATIONS WITHDRAWN 7 $126,673 22 $153,831 2 $63,685 FILES CLOSED FOR INCOMPLETENESS 0 $0 5 $145,214 0 $0
Aggregated Statistics For Year 2001(Based on 2 full and 8 partial tracts) A) Conventional B) Refinancings C) Non-occupant Loans on Number Average Value Number Average Value Number Average Value
LOANS ORIGINATED 124 $139,095 160 $123,636 6 $99,607 APPLICATIONS APPROVED, NOT ACCEPTED 10 $184,980 23 $136,493 1 $75,390 APPLICATIONS DENIED 5 $140,128 11 $137,820 0 $0 APPLICATIONS WITHDRAWN 4 $154,785 3 $122,070 0 $0 FILES CLOSED FOR INCOMPLETENESS 1 $72,060 1 $76,440 0 $0
Aggregated Statistics For Year 2000(Based on 2 full and 8 partial tracts) A) Conventional B) Refinancings C) Non-occupant Loans on Number Average Value Number Average Value Number Average Value
LOANS ORIGINATED 126 $133,295 28 $103,636 5 $75,172 APPLICATIONS APPROVED, NOT ACCEPTED 12 $127,680 8 $100,175 0 $0 APPLICATIONS DENIED 3 $180,540 5 $133,276 0 $0 APPLICATIONS WITHDRAWN 1 $143,450 1 $151,210 0 $0 FILES CLOSED FOR INCOMPLETENESS 0 $0 0 $0 0 $0
Aggregated Statistics For Year 1999(Based on 1 full and 5 partial tracts) A) Conventional B) Refinancings C) Non-occupant Loans on Number Average Value Number Average Value Number Average Value
LOANS ORIGINATED 62 $127,950 37 $111,554 4 $91,195 APPLICATIONS APPROVED, NOT ACCEPTED 7 $137,967 11 $101,326 2 $71,265 APPLICATIONS DENIED 5 $106,730 4 $120,958 1 $79,400 APPLICATIONS WITHDRAWN 2 $167,350 2 $131,075 0 $0 FILES CLOSED FOR INCOMPLETENESS 1 $60,650 1 $55,730 0 $0
2002 - 2018 National Fire Incident Reporting System (NFIRS) incidents See full 2006 National Fire Incident Reporting System statistics for zip code 27591, North Carolina
Most common first names in zip code 27591 among deceased individuals Name Count Lived (average)
James 102 68.1 years William 73 69.6 years Mary 63 76.0 years John 53 72.7 years Annie 36 80.2 years Willie 35 67.6 years Robert 34 69.3 years George 28 70.3 years Charles 26 69.9 years Joseph 25 67.3 years
Most common last names in zip code 27591 among deceased individuals Last name Count Lived (average)
Perry 55 73.7 years Richardson 52 71.3 years Johnson 38 72.8 years Jones 36 72.7 years Smith 32 71.5 years Harris 30 71.6 years Whitley 28 71.3 years Hocutt 26 76.0 years Price 25 75.2 years Strickland 24 75.8 years
Businesses in zip code 27591
Name Count Name Count
Chevrolet 1 Ford 1 Domino's Pizza 1 McDonald's 1 FedEx 1
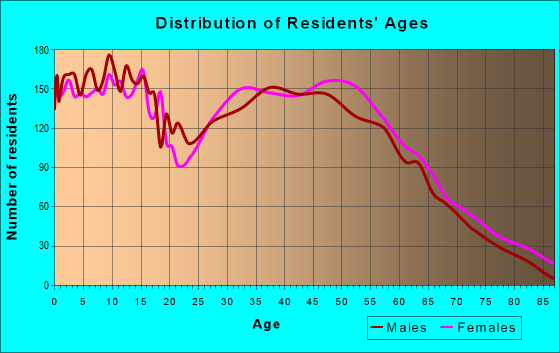
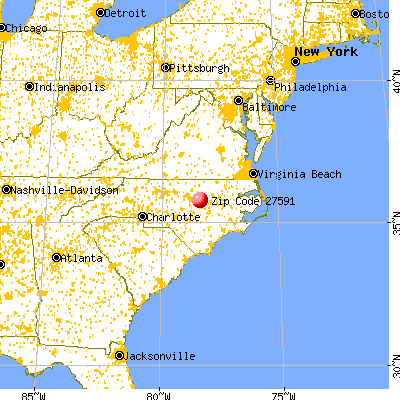


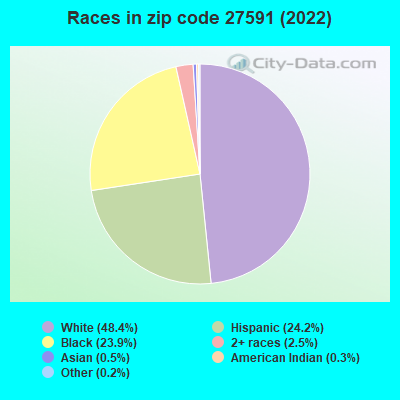


 Nearest zip codes: 27545, 27597, 27527, 27571, 27610, 27604.
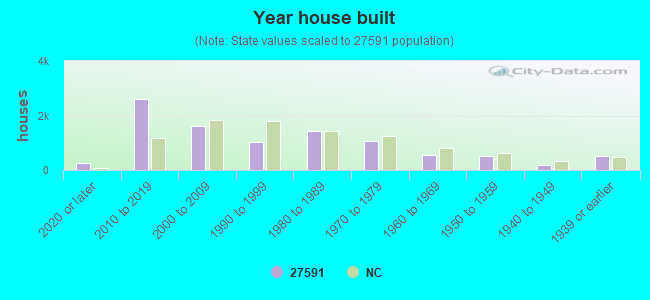

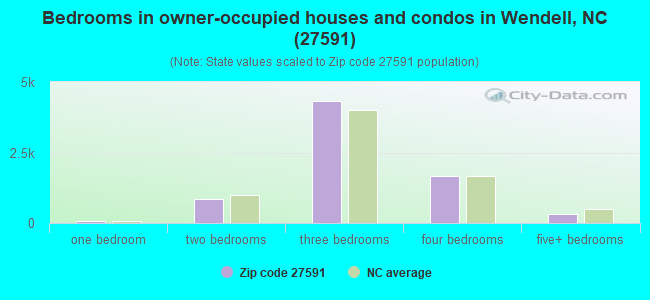
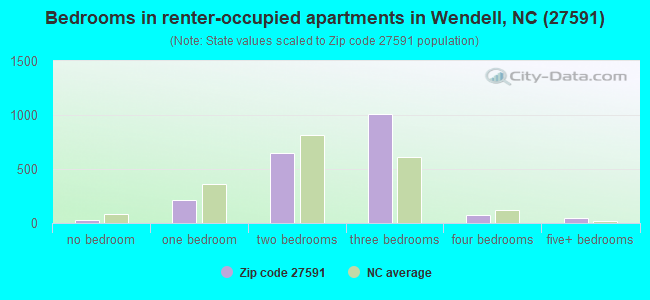
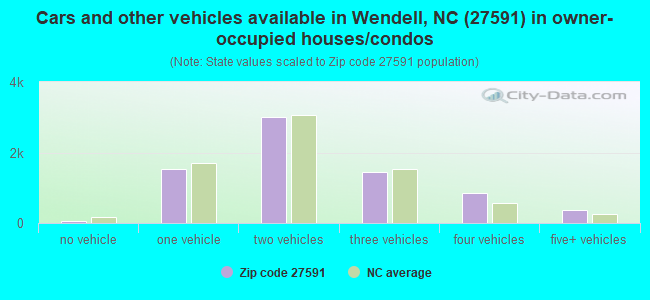
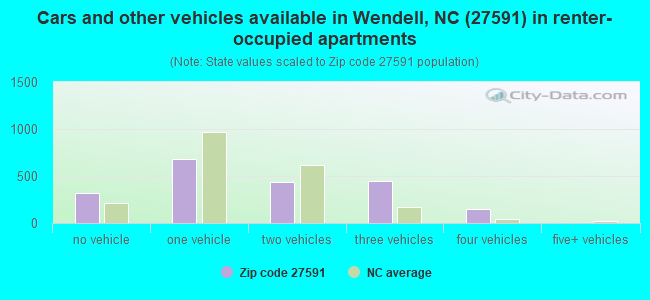


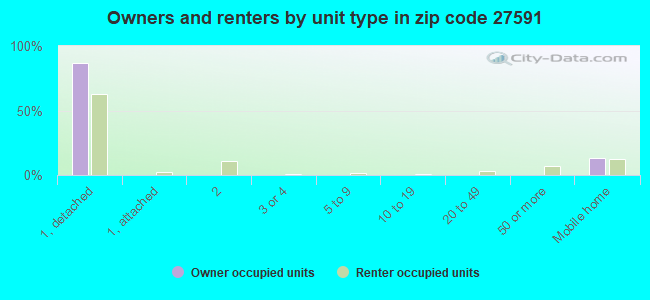
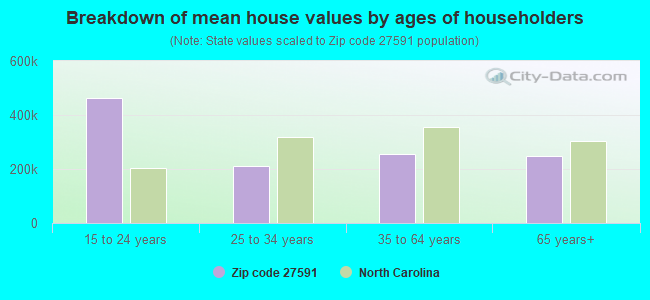


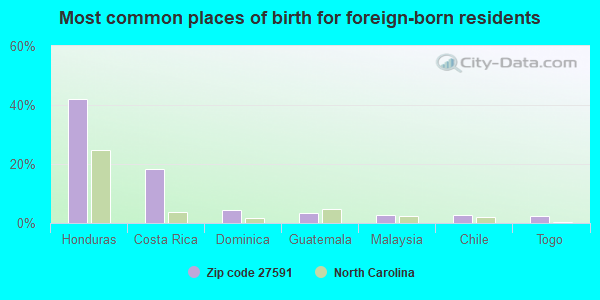
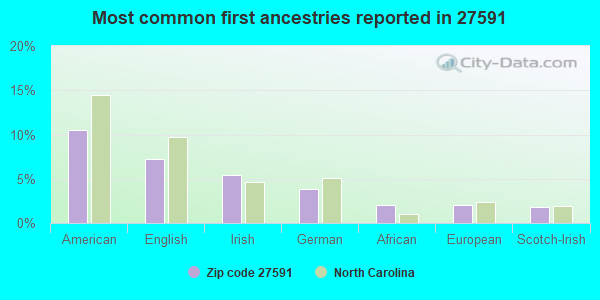
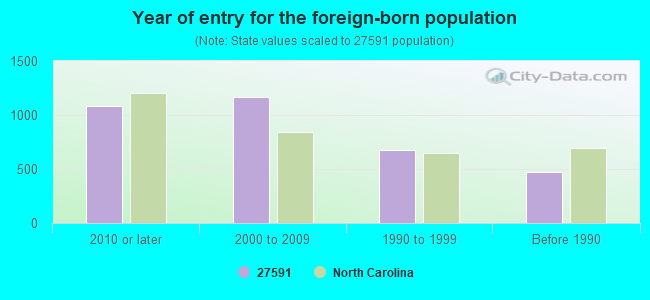
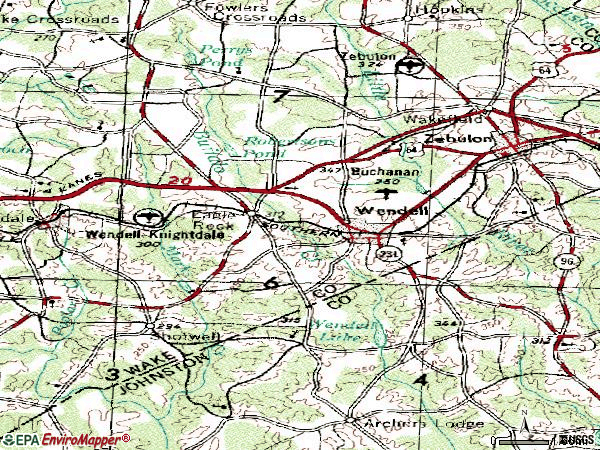

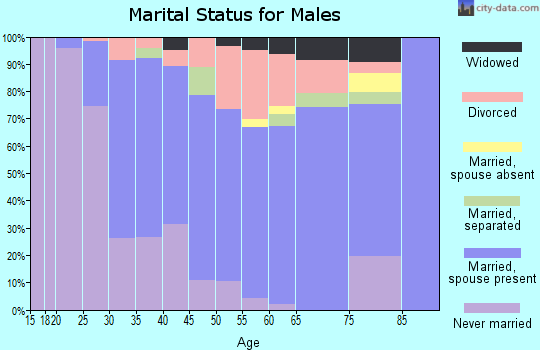
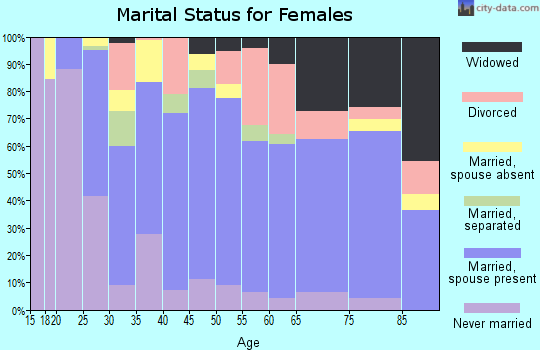
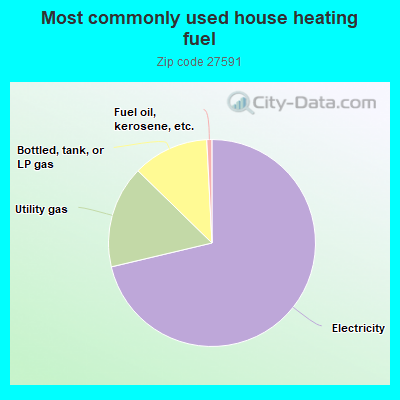
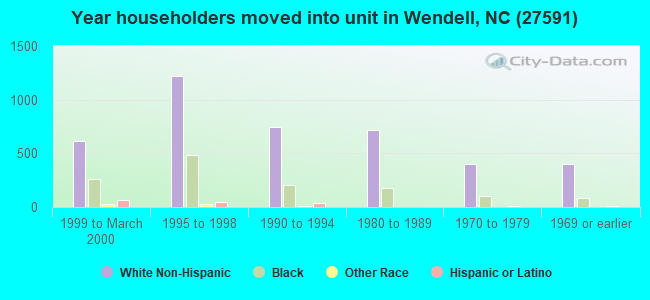
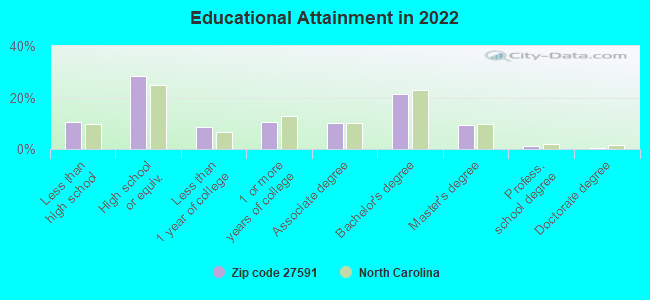
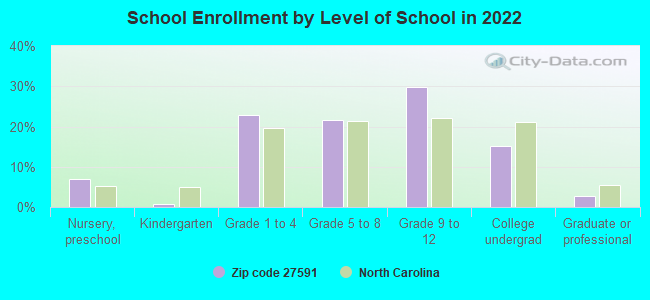
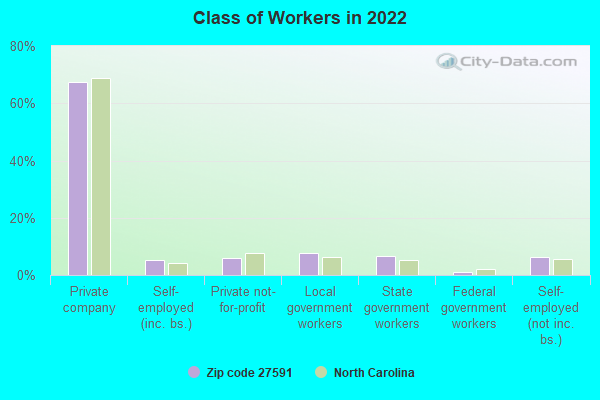
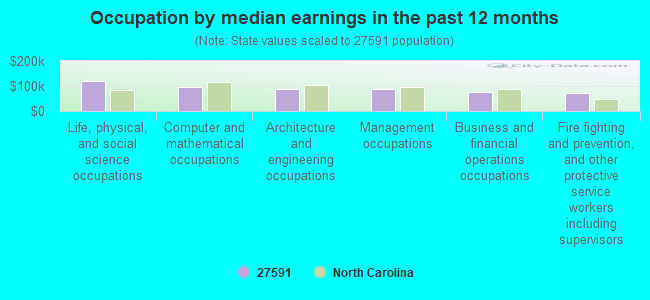
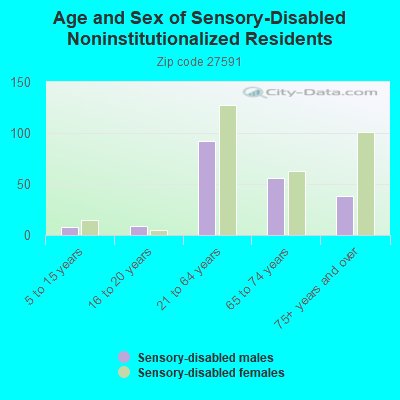
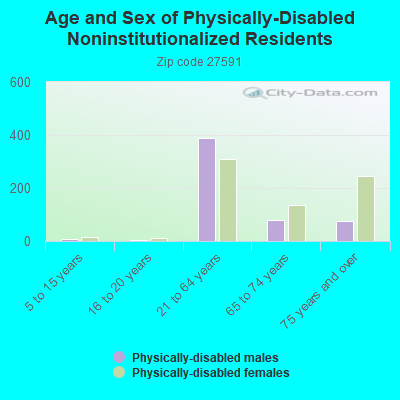
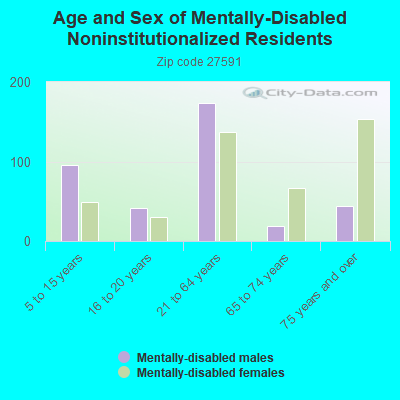
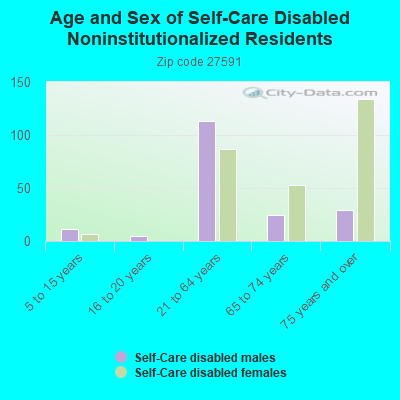
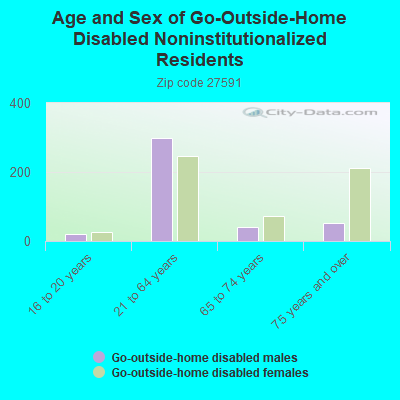
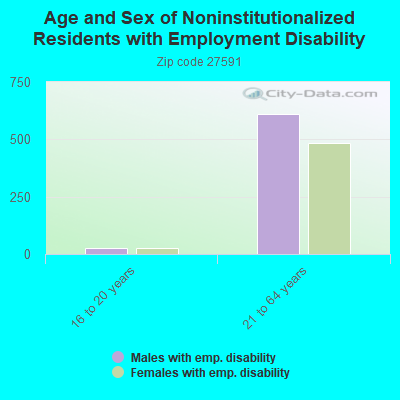
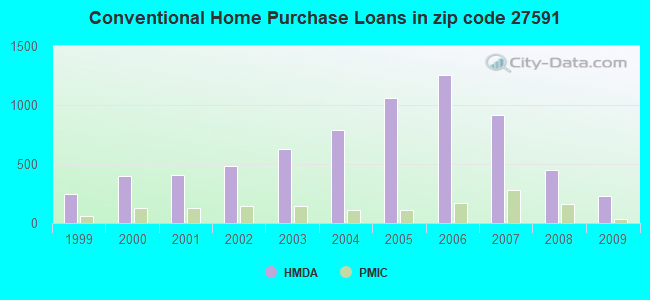
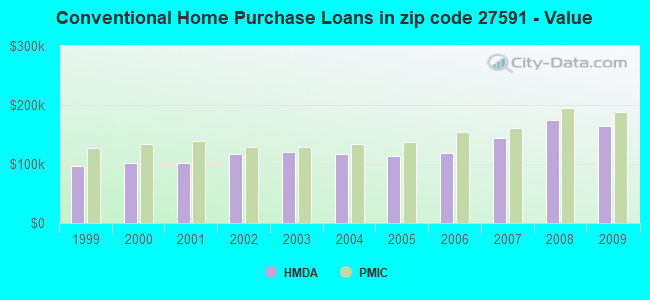
 According to the data from the years 2002 - 2018 the average number of fire incidents per year is 111. The highest number of fire incidents - 157 took place in 2002, and the least - 14 in 2007. The data has a decreasing trend.
 When looking into fire subcategories, the most reports belonged to: Structure Fires (44.0%), and Outside Fires (36.8%).