Estimated zip code population in 2022: 34,343
Zip code population in 2010: 31,516
Zip code population in 2000: 11,045
Houses and condos: 15,192
Renter-occupied apartments: 3,864
% of renters here:
28%State:
33%
March 2022 cost of living index in zip code 27614: 95.2
(less than average, U.S. average is 100)
Land area: 27.1
sq. mi.
Water area: 2.3
sq. mi.
Population density: 1,268 people per square mile (low).
OSM Map
General Map
Google Map
MSN Map
OSM Map
General Map
Google Map
MSN Map
OSM Map
General Map
Google Map
MSN Map
OSM Map
General Map
Google Map
MSN Map
Please wait while loading the map...
Real estate property taxes paid for housing units in 2022:
This zip code:
0.7% ($3,739)North Carolina:
0.6% ($1,769)
Median real estate property taxes paid for housing units with mortgages in 2022: $3,693 (0.7%)
Median real estate property taxes paid for housing units with no mortgage in 2022: $3,810 (0.6%)
Profiles of local businesses
Business Search - 14 Million verified businesses
Males: 16,134 Females: 18,212
For population 25 years and over in 27614:
High school or higher: 97.8%Bachelor's degree or higher: 65.5%Graduate or professional degree: 24.9%Unemployed: 2.9%Mean travel time to work (commute): 27.6 minutes
For population 15 years and over in 27614:
Never married: 25.4%Now married: 59.7%Separated: 1.0%Widowed: 3.9%Divorced: 10.0%
Zip code 27614 compared to state average:
Median household income above state average. Median house value above state average. Black race population percentage below state average. Hispanic race population percentage below state average. Median age above state average. Length of stay since moving in above state average. Number of rooms per house above state average. House age significantly below state average. Percentage of population with a bachelor's degree or higher above state average. 25,915 75.5% White 3,798 11.1% Black 1,882 5.5% Hispanic or Latino 1,483 4.3% Two or more races 1,252 3.6% Asian 11 0.03% American Indian
Data:
Median household income ($)
Median household income (% change since 2000)
Household income diversity
Ratio of average income to average house value (%)
Ratio of average income to average rent
Median household income ($) - White
Median household income ($) - Black or African American
Median household income ($) - Asian
Median household income ($) - Hispanic or Latino
Median household income ($) - American Indian and Alaska Native
Median household income ($) - Multirace
Median household income ($) - Other Race
Median household income for houses/condos with a mortgage ($)
Median household income for apartments without a mortgage ($)
Races - White alone (%)
Races - White alone (% change since 2000)
Races - Black alone (%)
Races - Black alone (% change since 2000)
Races - American Indian alone (%)
Races - American Indian alone (% change since 2000)
Races - Asian alone (%)
Races - Asian alone (% change since 2000)
Races - Hispanic (%)
Races - Hispanic (% change since 2000)
Races - Native Hawaiian and Other Pacific Islander alone (%)
Races - Native Hawaiian and Other Pacific Islander alone (% change since 2000)
Races - Two or more races (%)
Races - Two or more races (% change since 2000)
Races - Other race alone (%)
Races - Other race alone (% change since 2000)
Racial diversity
Unemployment (%)
Unemployment (% change since 2000)
Unemployment (%) - White
Unemployment (%) - Black or African American
Unemployment (%) - Asian
Unemployment (%) - Hispanic or Latino
Unemployment (%) - American Indian and Alaska Native
Unemployment (%) - Multirace
Unemployment (%) - Other Race
Population density (people per square mile)
Population - Males (%)
Population - Females (%)
Population - Males (%) - White
Population - Males (%) - Black or African American
Population - Males (%) - Asian
Population - Males (%) - Hispanic or Latino
Population - Males (%) - American Indian and Alaska Native
Population - Males (%) - Multirace
Population - Males (%) - Other Race
Population - Females (%) - White
Population - Females (%) - Black or African American
Population - Females (%) - Asian
Population - Females (%) - Hispanic or Latino
Population - Females (%) - American Indian and Alaska Native
Population - Females (%) - Multirace
Population - Females (%) - Other Race
Coronavirus confirmed cases (Apr 27, 2024)
Deaths caused by coronavirus (Apr 27, 2024)
Coronavirus confirmed cases (per 100k population) (Apr 27, 2024)
Deaths caused by coronavirus (per 100k population) (Apr 27, 2024)
Daily increase in number of cases (Apr 27, 2024)
Weekly increase in number of cases (Apr 27, 2024)
Cases doubled (in days) (Apr 27, 2024)
Hospitalized patients (Apr 18, 2022)
Negative test results (Apr 18, 2022)
Total test results (Apr 18, 2022)
COVID Vaccine doses distributed (per 100k population) (Sep 19, 2023)
COVID Vaccine doses administered (per 100k population) (Sep 19, 2023)
COVID Vaccine doses distributed (Sep 19, 2023)
COVID Vaccine doses administered (Sep 19, 2023)
Likely homosexual households (%)
Likely homosexual households (% change since 2000)
Likely homosexual households - Lesbian couples (%)
Likely homosexual households - Lesbian couples (% change since 2000)
Likely homosexual households - Gay men (%)
Likely homosexual households - Gay men (% change since 2000)
Cost of living index
Median gross rent ($)
Median contract rent ($)
Median monthly housing costs ($)
Median house or condo value ($)
Median house or condo value ($ change since 2000)
Mean house or condo value by units in structure - 1, detached ($)
Mean house or condo value by units in structure - 1, attached ($)
Mean house or condo value by units in structure - 2 ($)
Mean house or condo value by units in structure by units in structure - 3 or 4 ($)
Mean house or condo value by units in structure - 5 or more ($)
Mean house or condo value by units in structure - Boat, RV, van, etc. ($)
Mean house or condo value by units in structure - Mobile home ($)
Median house or condo value ($) - White
Median house or condo value ($) - Black or African American
Median house or condo value ($) - Asian
Median house or condo value ($) - Hispanic or Latino
Median house or condo value ($) - American Indian and Alaska Native
Median house or condo value ($) - Multirace
Median house or condo value ($) - Other Race
Median resident age
Resident age diversity
Median resident age - Males
Median resident age - Females
Median resident age - White
Median resident age - Black or African American
Median resident age - Asian
Median resident age - Hispanic or Latino
Median resident age - American Indian and Alaska Native
Median resident age - Multirace
Median resident age - Other Race
Median resident age - Males - White
Median resident age - Males - Black or African American
Median resident age - Males - Asian
Median resident age - Males - Hispanic or Latino
Median resident age - Males - American Indian and Alaska Native
Median resident age - Males - Multirace
Median resident age - Males - Other Race
Median resident age - Females - White
Median resident age - Females - Black or African American
Median resident age - Females - Asian
Median resident age - Females - Hispanic or Latino
Median resident age - Females - American Indian and Alaska Native
Median resident age - Females - Multirace
Median resident age - Females - Other Race
Commute - mean travel time to work (minutes)
Travel time to work - Less than 5 minutes (%)
Travel time to work - Less than 5 minutes (% change since 2000)
Travel time to work - 5 to 9 minutes (%)
Travel time to work - 5 to 9 minutes (% change since 2000)
Travel time to work - 10 to 19 minutes (%)
Travel time to work - 10 to 19 minutes (% change since 2000)
Travel time to work - 20 to 29 minutes (%)
Travel time to work - 20 to 29 minutes (% change since 2000)
Travel time to work - 30 to 39 minutes (%)
Travel time to work - 30 to 39 minutes (% change since 2000)
Travel time to work - 40 to 59 minutes (%)
Travel time to work - 40 to 59 minutes (% change since 2000)
Travel time to work - 60 to 89 minutes (%)
Travel time to work - 60 to 89 minutes (% change since 2000)
Travel time to work - 90 or more minutes (%)
Travel time to work - 90 or more minutes (% change since 2000)
Marital status - Never married (%)
Marital status - Now married (%)
Marital status - Separated (%)
Marital status - Widowed (%)
Marital status - Divorced (%)
Median family income ($)
Median family income (% change since 2000)
Median non-family income ($)
Median non-family income (% change since 2000)
Median per capita income ($)
Median per capita income (% change since 2000)
Median family income ($) - White
Median family income ($) - Black or African American
Median family income ($) - Asian
Median family income ($) - Hispanic or Latino
Median family income ($) - American Indian and Alaska Native
Median family income ($) - Multirace
Median family income ($) - Other Race
Median year house/condo built
Median year apartment built
Year house built - Built 2005 or later (%)
Year house built - Built 2000 to 2004 (%)
Year house built - Built 1990 to 1999 (%)
Year house built - Built 1980 to 1989 (%)
Year house built - Built 1970 to 1979 (%)
Year house built - Built 1960 to 1969 (%)
Year house built - Built 1950 to 1959 (%)
Year house built - Built 1940 to 1949 (%)
Year house built - Built 1939 or earlier (%)
Average household size
Household density (households per square mile)
Average household size - White
Average household size - Black or African American
Average household size - Asian
Average household size - Hispanic or Latino
Average household size - American Indian and Alaska Native
Average household size - Multirace
Average household size - Other Race
Occupied housing units (%)
Vacant housing units (%)
Owner occupied housing units (%)
Renter occupied housing units (%)
Vacancy status - For rent (%)
Vacancy status - For sale only (%)
Vacancy status - Rented or sold, not occupied (%)
Vacancy status - For seasonal, recreational, or occasional use (%)
Vacancy status - For migrant workers (%)
Vacancy status - Other vacant (%)
Residents with income below the poverty level (%)
Residents with income below 50% of the poverty level (%)
Children below poverty level (%)
Poor families by family type - Married-couple family (%)
Poor families by family type - Male, no wife present (%)
Poor families by family type - Female, no husband present (%)
Poverty status for native-born residents (%)
Poverty status for foreign-born residents (%)
Poverty among high school graduates not in families (%)
Poverty among people who did not graduate high school not in families (%)
Residents with income below the poverty level (%) - White
Residents with income below the poverty level (%) - Black or African American
Residents with income below the poverty level (%) - Asian
Residents with income below the poverty level (%) - Hispanic or Latino
Residents with income below the poverty level (%) - American Indian and Alaska Native
Residents with income below the poverty level (%) - Multirace
Residents with income below the poverty level (%) - Other Race
Air pollution - Air Quality Index (AQI)
Air pollution - CO
Air pollution - NO2
Air pollution - SO2
Air pollution - Ozone
Air pollution - PM10
Air pollution - PM25
Air pollution - Pb
Crime - Murders per 100,000 population
Crime - Rapes per 100,000 population
Crime - Robberies per 100,000 population
Crime - Assaults per 100,000 population
Crime - Burglaries per 100,000 population
Crime - Thefts per 100,000 population
Crime - Auto thefts per 100,000 population
Crime - Arson per 100,000 population
Crime - City-data.com crime index
Crime - Violent crime index
Crime - Property crime index
Crime - Murders per 100,000 population (5 year average)
Crime - Rapes per 100,000 population (5 year average)
Crime - Robberies per 100,000 population (5 year average)
Crime - Assaults per 100,000 population (5 year average)
Crime - Burglaries per 100,000 population (5 year average)
Crime - Thefts per 100,000 population (5 year average)
Crime - Auto thefts per 100,000 population (5 year average)
Crime - Arson per 100,000 population (5 year average)
Crime - City-data.com crime index (5 year average)
Crime - Violent crime index (5 year average)
Crime - Property crime index (5 year average)
1996 Presidential Elections Results (%) - Democratic Party (Clinton)
1996 Presidential Elections Results (%) - Republican Party (Dole)
1996 Presidential Elections Results (%) - Other
2000 Presidential Elections Results (%) - Democratic Party (Gore)
2000 Presidential Elections Results (%) - Republican Party (Bush)
2000 Presidential Elections Results (%) - Other
2004 Presidential Elections Results (%) - Democratic Party (Kerry)
2004 Presidential Elections Results (%) - Republican Party (Bush)
2004 Presidential Elections Results (%) - Other
2008 Presidential Elections Results (%) - Democratic Party (Obama)
2008 Presidential Elections Results (%) - Republican Party (McCain)
2008 Presidential Elections Results (%) - Other
2012 Presidential Elections Results (%) - Democratic Party (Obama)
2012 Presidential Elections Results (%) - Republican Party (Romney)
2012 Presidential Elections Results (%) - Other
2016 Presidential Elections Results (%) - Democratic Party (Clinton)
2016 Presidential Elections Results (%) - Republican Party (Trump)
2016 Presidential Elections Results (%) - Other
2020 Presidential Elections Results (%) - Democratic Party (Biden)
2020 Presidential Elections Results (%) - Republican Party (Trump)
2020 Presidential Elections Results (%) - Other
Ancestries Reported - Arab (%)
Ancestries Reported - Czech (%)
Ancestries Reported - Danish (%)
Ancestries Reported - Dutch (%)
Ancestries Reported - English (%)
Ancestries Reported - French (%)
Ancestries Reported - French Canadian (%)
Ancestries Reported - German (%)
Ancestries Reported - Greek (%)
Ancestries Reported - Hungarian (%)
Ancestries Reported - Irish (%)
Ancestries Reported - Italian (%)
Ancestries Reported - Lithuanian (%)
Ancestries Reported - Norwegian (%)
Ancestries Reported - Polish (%)
Ancestries Reported - Portuguese (%)
Ancestries Reported - Russian (%)
Ancestries Reported - Scotch-Irish (%)
Ancestries Reported - Scottish (%)
Ancestries Reported - Slovak (%)
Ancestries Reported - Subsaharan African (%)
Ancestries Reported - Swedish (%)
Ancestries Reported - Swiss (%)
Ancestries Reported - Ukrainian (%)
Ancestries Reported - United States (%)
Ancestries Reported - Welsh (%)
Ancestries Reported - West Indian (%)
Ancestries Reported - Other (%)
Educational Attainment - No schooling completed (%)
Educational Attainment - Less than high school (%)
Educational Attainment - High school or equivalent (%)
Educational Attainment - Less than 1 year of college (%)
Educational Attainment - 1 or more years of college (%)
Educational Attainment - Associate degree (%)
Educational Attainment - Bachelor's degree (%)
Educational Attainment - Master's degree (%)
Educational Attainment - Professional school degree (%)
Educational Attainment - Doctorate degree (%)
School Enrollment - Nursery, preschool (%)
School Enrollment - Kindergarten (%)
School Enrollment - Grade 1 to 4 (%)
School Enrollment - Grade 5 to 8 (%)
School Enrollment - Grade 9 to 12 (%)
School Enrollment - College undergrad (%)
School Enrollment - Graduate or professional (%)
School Enrollment - Not enrolled in school (%)
School enrollment - Public schools (%)
School enrollment - Private schools (%)
School enrollment - Not enrolled (%)
Median number of rooms in houses and condos
Median number of rooms in apartments
Housing units lacking complete plumbing facilities (%)
Housing units lacking complete kitchen facilities (%)
Density of houses
Urban houses (%)
Rural houses (%)
Households with people 60 years and over (%)
Households with people 65 years and over (%)
Households with people 75 years and over (%)
Households with one or more nonrelatives (%)
Households with no nonrelatives (%)
Population in households (%)
Family households (%)
Nonfamily households (%)
Population in families (%)
Family households with own children (%)
Median number of bedrooms in owner occupied houses
Mean number of bedrooms in owner occupied houses
Median number of bedrooms in renter occupied houses
Mean number of bedrooms in renter occupied houses
Median number of vehichles in owner occupied houses
Mean number of vehichles in owner occupied houses
Median number of vehichles in renter occupied houses
Mean number of vehichles in renter occupied houses
Mortgage status - with mortgage (%)
Mortgage status - with second mortgage (%)
Mortgage status - with home equity loan (%)
Mortgage status - with both second mortgage and home equity loan (%)
Mortgage status - without a mortgage (%)
Average family size
Average family size - White
Average family size - Black or African American
Average family size - Asian
Average family size - Hispanic or Latino
Average family size - American Indian and Alaska Native
Average family size - Multirace
Average family size - Other Race
Geographical mobility - Same house 1 year ago (%)
Geographical mobility - Moved within same county (%)
Geographical mobility - Moved from different county within same state (%)
Geographical mobility - Moved from different state (%)
Geographical mobility - Moved from abroad (%)
Place of birth - Born in state of residence (%)
Place of birth - Born in other state (%)
Place of birth - Native, outside of US (%)
Place of birth - Foreign born (%)
Housing units in structures - 1, detached (%)
Housing units in structures - 1, attached (%)
Housing units in structures - 2 (%)
Housing units in structures - 3 or 4 (%)
Housing units in structures - 5 to 9 (%)
Housing units in structures - 10 to 19 (%)
Housing units in structures - 20 to 49 (%)
Housing units in structures - 50 or more (%)
Housing units in structures - Mobile home (%)
Housing units in structures - Boat, RV, van, etc. (%)
House/condo owner moved in on average (years ago)
Renter moved in on average (years ago)
Year householder moved into unit - Moved in 1999 to March 2000 (%)
Year householder moved into unit - Moved in 1995 to 1998 (%)
Year householder moved into unit - Moved in 1990 to 1994 (%)
Year householder moved into unit - Moved in 1980 to 1989 (%)
Year householder moved into unit - Moved in 1970 to 1979 (%)
Year householder moved into unit - Moved in 1969 or earlier (%)
Means of transportation to work - Drove car alone (%)
Means of transportation to work - Carpooled (%)
Means of transportation to work - Public transportation (%)
Means of transportation to work - Bus or trolley bus (%)
Means of transportation to work - Streetcar or trolley car (%)
Means of transportation to work - Subway or elevated (%)
Means of transportation to work - Railroad (%)
Means of transportation to work - Ferryboat (%)
Means of transportation to work - Taxicab (%)
Means of transportation to work - Motorcycle (%)
Means of transportation to work - Bicycle (%)
Means of transportation to work - Walked (%)
Means of transportation to work - Other means (%)
Working at home (%)
Industry diversity
Most Common Industries - Agriculture, forestry, fishing and hunting, and mining (%)
Most Common Industries - Agriculture, forestry, fishing and hunting (%)
Most Common Industries - Mining, quarrying, and oil and gas extraction (%)
Most Common Industries - Construction (%)
Most Common Industries - Manufacturing (%)
Most Common Industries - Wholesale trade (%)
Most Common Industries - Retail trade (%)
Most Common Industries - Transportation and warehousing, and utilities (%)
Most Common Industries - Transportation and warehousing (%)
Most Common Industries - Utilities (%)
Most Common Industries - Information (%)
Most Common Industries - Finance and insurance, and real estate and rental and leasing (%)
Most Common Industries - Finance and insurance (%)
Most Common Industries - Real estate and rental and leasing (%)
Most Common Industries - Professional, scientific, and management, and administrative and waste management services (%)
Most Common Industries - Professional, scientific, and technical services (%)
Most Common Industries - Management of companies and enterprises (%)
Most Common Industries - Administrative and support and waste management services (%)
Most Common Industries - Educational services, and health care and social assistance (%)
Most Common Industries - Educational services (%)
Most Common Industries - Health care and social assistance (%)
Most Common Industries - Arts, entertainment, and recreation, and accommodation and food services (%)
Most Common Industries - Arts, entertainment, and recreation (%)
Most Common Industries - Accommodation and food services (%)
Most Common Industries - Other services, except public administration (%)
Most Common Industries - Public administration (%)
Occupation diversity
Most Common Occupations - Management, business, science, and arts occupations (%)
Most Common Occupations - Management, business, and financial occupations (%)
Most Common Occupations - Management occupations (%)
Most Common Occupations - Business and financial operations occupations (%)
Most Common Occupations - Computer, engineering, and science occupations (%)
Most Common Occupations - Computer and mathematical occupations (%)
Most Common Occupations - Architecture and engineering occupations (%)
Most Common Occupations - Life, physical, and social science occupations (%)
Most Common Occupations - Education, legal, community service, arts, and media occupations (%)
Most Common Occupations - Community and social service occupations (%)
Most Common Occupations - Legal occupations (%)
Most Common Occupations - Education, training, and library occupations (%)
Most Common Occupations - Arts, design, entertainment, sports, and media occupations (%)
Most Common Occupations - Healthcare practitioners and technical occupations (%)
Most Common Occupations - Health diagnosing and treating practitioners and other technical occupations (%)
Most Common Occupations - Health technologists and technicians (%)
Most Common Occupations - Service occupations (%)
Most Common Occupations - Healthcare support occupations (%)
Most Common Occupations - Protective service occupations (%)
Most Common Occupations - Fire fighting and prevention, and other protective service workers including supervisors (%)
Most Common Occupations - Law enforcement workers including supervisors (%)
Most Common Occupations - Food preparation and serving related occupations (%)
Most Common Occupations - Building and grounds cleaning and maintenance occupations (%)
Most Common Occupations - Personal care and service occupations (%)
Most Common Occupations - Sales and office occupations (%)
Most Common Occupations - Sales and related occupations (%)
Most Common Occupations - Office and administrative support occupations (%)
Most Common Occupations - Natural resources, construction, and maintenance occupations (%)
Most Common Occupations - Farming, fishing, and forestry occupations (%)
Most Common Occupations - Construction and extraction occupations (%)
Most Common Occupations - Installation, maintenance, and repair occupations (%)
Most Common Occupations - Production, transportation, and material moving occupations (%)
Most Common Occupations - Production occupations (%)
Most Common Occupations - Transportation occupations (%)
Most Common Occupations - Material moving occupations (%)
People in Group quarters - Institutionalized population (%)
People in Group quarters - Correctional institutions (%)
People in Group quarters - Federal prisons and detention centers (%)
People in Group quarters - Halfway houses (%)
People in Group quarters - Local jails and other confinement facilities (including police lockups) (%)
People in Group quarters - Military disciplinary barracks (%)
People in Group quarters - State prisons (%)
People in Group quarters - Other types of correctional institutions (%)
People in Group quarters - Nursing homes (%)
People in Group quarters - Hospitals/wards, hospices, and schools for the handicapped (%)
People in Group quarters - Hospitals/wards and hospices for chronically ill (%)
People in Group quarters - Hospices or homes for chronically ill (%)
People in Group quarters - Military hospitals or wards for chronically ill (%)
People in Group quarters - Other hospitals or wards for chronically ill (%)
People in Group quarters - Hospitals or wards for drug/alcohol abuse (%)
People in Group quarters - Mental (Psychiatric) hospitals or wards (%)
People in Group quarters - Schools, hospitals, or wards for the mentally retarded (%)
People in Group quarters - Schools, hospitals, or wards for the physically handicapped (%)
People in Group quarters - Institutions for the deaf (%)
People in Group quarters - Institutions for the blind (%)
People in Group quarters - Orthopedic wards and institutions for the physically handicapped (%)
People in Group quarters - Wards in general hospitals for patients who have no usual home elsewhere (%)
People in Group quarters - Wards in military hospitals for patients who have no usual home elsewhere (%)
People in Group quarters - Juvenile institutions (%)
People in Group quarters - Long-term care (%)
People in Group quarters - Homes for abused, dependent, and neglected children (%)
People in Group quarters - Residential treatment centers for emotionally disturbed children (%)
People in Group quarters - Training schools for juvenile delinquents (%)
People in Group quarters - Short-term care, detention or diagnostic centers for delinquent children (%)
People in Group quarters - Type of juvenile institution unknown (%)
People in Group quarters - Noninstitutionalized population (%)
People in Group quarters - College dormitories (includes college quarters off campus) (%)
People in Group quarters - Military quarters (%)
People in Group quarters - On base (%)
People in Group quarters - Barracks, unaccompanied personnel housing (UPH), (Enlisted/Officer), ;and similar group living quarters for military personnel (%)
People in Group quarters - Transient quarters for temporary residents (%)
People in Group quarters - Military ships (%)
People in Group quarters - Group homes (%)
People in Group quarters - Homes or halfway houses for drug/alcohol abuse (%)
People in Group quarters - Homes for the mentally ill (%)
People in Group quarters - Homes for the mentally retarded (%)
People in Group quarters - Homes for the physically handicapped (%)
People in Group quarters - Other group homes (%)
People in Group quarters - Religious group quarters (%)
People in Group quarters - Dormitories (%)
People in Group quarters - Agriculture workers' dormitories on farms (%)
People in Group quarters - Job Corps and vocational training facilities (%)
People in Group quarters - Other workers' dormitories (%)
People in Group quarters - Crews of maritime vessels (%)
People in Group quarters - Other nonhousehold living situations (%)
People in Group quarters - Other noninstitutional group quarters (%)
Residents speaking English at home (%)
Residents speaking English at home - Born in the United States (%)
Residents speaking English at home - Native, born elsewhere (%)
Residents speaking English at home - Foreign born (%)
Residents speaking Spanish at home (%)
Residents speaking Spanish at home - Born in the United States (%)
Residents speaking Spanish at home - Native, born elsewhere (%)
Residents speaking Spanish at home - Foreign born (%)
Residents speaking other language at home (%)
Residents speaking other language at home - Born in the United States (%)
Residents speaking other language at home - Native, born elsewhere (%)
Residents speaking other language at home - Foreign born (%)
Class of Workers - Employee of private company (%)
Class of Workers - Self-employed in own incorporated business (%)
Class of Workers - Private not-for-profit wage and salary workers (%)
Class of Workers - Local government workers (%)
Class of Workers - State government workers (%)
Class of Workers - Federal government workers (%)
Class of Workers - Self-employed workers in own not incorporated business and Unpaid family workers (%)
House heating fuel used in houses and condos - Utility gas (%)
House heating fuel used in houses and condos - Bottled, tank, or LP gas (%)
House heating fuel used in houses and condos - Electricity (%)
House heating fuel used in houses and condos - Fuel oil, kerosene, etc. (%)
House heating fuel used in houses and condos - Coal or coke (%)
House heating fuel used in houses and condos - Wood (%)
House heating fuel used in houses and condos - Solar energy (%)
House heating fuel used in houses and condos - Other fuel (%)
House heating fuel used in houses and condos - No fuel used (%)
House heating fuel used in apartments - Utility gas (%)
House heating fuel used in apartments - Bottled, tank, or LP gas (%)
House heating fuel used in apartments - Electricity (%)
House heating fuel used in apartments - Fuel oil, kerosene, etc. (%)
House heating fuel used in apartments - Coal or coke (%)
House heating fuel used in apartments - Wood (%)
House heating fuel used in apartments - Solar energy (%)
House heating fuel used in apartments - Other fuel (%)
House heating fuel used in apartments - No fuel used (%)
Armed forces status - In Armed Forces (%)
Armed forces status - Civilian (%)
Armed forces status - Civilian - Veteran (%)
Armed forces status - Civilian - Nonveteran (%)
Fatal accidents locations in years 2005-2021
Fatal accidents locations in 2005
Fatal accidents locations in 2006
Fatal accidents locations in 2007
Fatal accidents locations in 2008
Fatal accidents locations in 2009
Fatal accidents locations in 2010
Fatal accidents locations in 2011
Fatal accidents locations in 2012
Fatal accidents locations in 2013
Fatal accidents locations in 2014
Fatal accidents locations in 2015
Fatal accidents locations in 2016
Fatal accidents locations in 2017
Fatal accidents locations in 2018
Fatal accidents locations in 2019
Fatal accidents locations in 2020
Fatal accidents locations in 2021
Alcohol use - People drinking some alcohol every month (%)
Alcohol use - People not drinking at all (%)
Alcohol use - Average days/month drinking alcohol
Alcohol use - Average drinks/week
Alcohol use - Average days/year people drink much
Audiometry - Average condition of hearing (%)
Audiometry - People that can hear a whisper from across a quiet room (%)
Audiometry - People that can hear normal voice from across a quiet room (%)
Audiometry - Ears ringing, roaring, buzzing (%)
Audiometry - Had a job exposure to loud noise (%)
Audiometry - Had off-work exposure to loud noise (%)
Blood Pressure & Cholesterol - Has high blood pressure (%)
Blood Pressure & Cholesterol - Checking blood pressure at home (%)
Blood Pressure & Cholesterol - Frequently checking blood cholesterol (%)
Blood Pressure & Cholesterol - Has high cholesterol level (%)
Consumer Behavior - Money monthly spent on food at supermarket/grocery store
Consumer Behavior - Money monthly spent on food at other stores
Consumer Behavior - Money monthly spent on eating out
Consumer Behavior - Money monthly spent on carryout/delivered foods
Consumer Behavior - Income spent on food at supermarket/grocery store (%)
Consumer Behavior - Income spent on food at other stores (%)
Consumer Behavior - Income spent on eating out (%)
Consumer Behavior - Income spent on carryout/delivered foods (%)
Current Health Status - General health condition (%)
Current Health Status - Blood donors (%)
Current Health Status - Has blood ever tested for HIV virus (%)
Current Health Status - Left-handed people (%)
Dermatology - People using sunscreen (%)
Diabetes - Diabetics (%)
Diabetes - Had a blood test for high blood sugar (%)
Diabetes - People taking insulin (%)
Diet Behavior & Nutrition - Diet health (%)
Diet Behavior & Nutrition - Milk product consumption (# of products/month)
Diet Behavior & Nutrition - Meals not home prepared (#/week)
Diet Behavior & Nutrition - Meals from fast food or pizza place (#/week)
Diet Behavior & Nutrition - Ready-to-eat foods (#/month)
Diet Behavior & Nutrition - Frozen meals/pizza (#/month)
Drug Use - People that ever used marijuana or hashish (%)
Drug Use - Ever used hard drugs (%)
Drug Use - Ever used any form of cocaine (%)
Drug Use - Ever used heroin (%)
Drug Use - Ever used methamphetamine (%)
Health Insurance - People covered by health insurance (%)
Kidney Conditions-Urology - Avg. # of times urinating at night
Medical Conditions - People with asthma (%)
Medical Conditions - People with anemia (%)
Medical Conditions - People with psoriasis (%)
Medical Conditions - People with overweight (%)
Medical Conditions - Elderly people having difficulties in thinking or remembering (%)
Medical Conditions - People who ever received blood transfusion (%)
Medical Conditions - People having trouble seeing even with glass/contacts (%)
Medical Conditions - People with arthritis (%)
Medical Conditions - People with gout (%)
Medical Conditions - People with congestive heart failure (%)
Medical Conditions - People with coronary heart disease (%)
Medical Conditions - People with angina pectoris (%)
Medical Conditions - People who ever had heart attack (%)
Medical Conditions - People who ever had stroke (%)
Medical Conditions - People with emphysema (%)
Medical Conditions - People with thyroid problem (%)
Medical Conditions - People with chronic bronchitis (%)
Medical Conditions - People with any liver condition (%)
Medical Conditions - People who ever had cancer or malignancy (%)
Mental Health - People who have little interest in doing things (%)
Mental Health - People feeling down, depressed, or hopeless (%)
Mental Health - People who have trouble sleeping or sleeping too much (%)
Mental Health - People feeling tired or having little energy (%)
Mental Health - People with poor appetite or overeating (%)
Mental Health - People feeling bad about themself (%)
Mental Health - People who have trouble concentrating on things (%)
Mental Health - People moving or speaking slowly or too fast (%)
Mental Health - People having thoughts they would be better off dead (%)
Oral Health - Average years since last visit a dentist
Oral Health - People embarrassed because of mouth (%)
Oral Health - People with gum disease (%)
Oral Health - General health of teeth and gums (%)
Oral Health - Average days a week using dental floss/device
Oral Health - Average days a week using mouthwash for dental problem
Oral Health - Average number of teeth
Pesticide Use - Households using pesticides to control insects (%)
Pesticide Use - Households using pesticides to kill weeds (%)
Physical Activity - People doing vigorous-intensity work activities (%)
Physical Activity - People doing moderate-intensity work activities (%)
Physical Activity - People walking or bicycling (%)
Physical Activity - People doing vigorous-intensity recreational activities (%)
Physical Activity - People doing moderate-intensity recreational activities (%)
Physical Activity - Average hours a day doing sedentary activities
Physical Activity - Average hours a day watching TV or videos
Physical Activity - Average hours a day using computer
Physical Functioning - People having limitations keeping them from working (%)
Physical Functioning - People limited in amount of work they can do (%)
Physical Functioning - People that need special equipment to walk (%)
Physical Functioning - People experiencing confusion/memory problems (%)
Physical Functioning - People requiring special healthcare equipment (%)
Prescription Medications - Average number of prescription medicines taking
Preventive Aspirin Use - Adults 40+ taking low-dose aspirin (%)
Reproductive Health - Vaginal deliveries (%)
Reproductive Health - Cesarean deliveries (%)
Reproductive Health - Deliveries resulted in a live birth (%)
Reproductive Health - Pregnancies resulted in a delivery (%)
Reproductive Health - Women breastfeeding newborns (%)
Reproductive Health - Women that had a hysterectomy (%)
Reproductive Health - Women that had both ovaries removed (%)
Reproductive Health - Women that have ever taken birth control pills (%)
Reproductive Health - Women taking birth control pills (%)
Reproductive Health - Women that have ever used Depo-Provera or injectables (%)
Reproductive Health - Women that have ever used female hormones (%)
Sexual Behavior - People 18+ that ever had sex (vaginal, anal, or oral) (%)
Sexual Behavior - Males 18+ that ever had vaginal sex with a woman (%)
Sexual Behavior - Males 18+ that ever performed oral sex on a woman (%)
Sexual Behavior - Males 18+ that ever had anal sex with a woman (%)
Sexual Behavior - Males 18+ that ever had any sex with a man (%)
Sexual Behavior - Females 18+ that ever had vaginal sex with a man (%)
Sexual Behavior - Females 18+ that ever performed oral sex on a man (%)
Sexual Behavior - Females 18+ that ever had anal sex with a man (%)
Sexual Behavior - Females 18+ that ever had any kind of sex with a woman (%)
Sexual Behavior - Average age people first had sex
Sexual Behavior - Average number of female sex partners in lifetime (males 18+)
Sexual Behavior - Average number of female vaginal sex partners in lifetime (males 18+)
Sexual Behavior - Average age people first performed oral sex on a woman (18+)
Sexual Behavior - Average number of woman performed oral sex on in lifetime (18+)
Sexual Behavior - Average number of male sex partners in lifetime (males 18+)
Sexual Behavior - Average number of male anal sex partners in lifetime (males 18+)
Sexual Behavior - Average age people first performed oral sex on a man (18+)
Sexual Behavior - Average number of male oral sex partners in lifetime (18+)
Sexual Behavior - People using protection when performing oral sex (%)
Sexual Behavior - Average number of times people have vaginal or anal sex a year
Sexual Behavior - People having sex without condom (%)
Sexual Behavior - Average number of male sex partners in lifetime (females 18+)
Sexual Behavior - Average number of male vaginal sex partners in lifetime (females 18+)
Sexual Behavior - Average number of female sex partners in lifetime (females 18+)
Sexual Behavior - Circumcised males 18+ (%)
Sleep Disorders - Average hours sleeping at night
Sleep Disorders - People that has trouble sleeping (%)
Smoking-Cigarette Use - People smoking cigarettes (%)
Taste & Smell - People 40+ having problems with smell (%)
Taste & Smell - People 40+ having problems with taste (%)
Taste & Smell - People 40+ that ever had wisdom teeth removed (%)
Taste & Smell - People 40+ that ever had tonsils teeth removed (%)
Taste & Smell - People 40+ that ever had a loss of consciousness because of a head injury (%)
Taste & Smell - People 40+ that ever had a broken nose or other serious injury to face or skull (%)
Taste & Smell - People 40+ that ever had two or more sinus infections (%)
Weight - Average height (inches)
Weight - Average weight (pounds)
Weight - Average BMI
Weight - People that are obese (%)
Weight - People that ever were obese (%)
Weight - People trying to lose weight (%)
Urban population: 26,230
Rural population: 8,112
Estimated median house/condo value in 2022: $564,306
27614:
$564,306North Carolina:
$280,600
According to our research of North Carolina and other state lists, there were 6 registered sex offenders living in 27614 zip code as of April 27, 2024 . The ratio of all residents to sex offenders in zip code 27614 is 5,578 to 1.The ratio of registered sex offenders to all residents in this zip code is much lower than the state average.
Median resident age: This zip code:
43.9 yearsNorth Carolina median age:
39.2 years
Average household size: This zip code:
2.5 peopleNorth Carolina:
2.4 people
Averages for the 2020 tax year for zip code 27614, filed in 2021:
Average Adjusted Gross Income (AGI) in 2020: $158,964 (Individual Income Tax Returns) Here:
$158,964State:
$70,020
Salary/wage: $121,537 (reported on 80.2% of returns )Here:
$121,537State:
$58,387
(% of AGI for various income ranges: 1129.2% for AGIs below $25k , 3715.2% for AGIs $25k-50k , 6600.2% for AGIs $50k-75k , 9428.4% for AGIs $75k-100k , 19495.5% for AGIs $100k-200k , 107062.6% for AGIs over 200k ) Taxable interest for individuals: $2,877 (reported on 49.3% of returns )This zip code:
$2,877North Carolina:
$1,479
(% of AGI for various income ranges: 24.7% for AGIs below $25k , 50.6% for AGIs $25k-50k , 80.9% for AGIs $50k-75k , 136.2% for AGIs $75k-100k , 183.5% for AGIs $100k-200k , 1770.4% for AGIs over 200k ) Ordinary dividends: $10,905 (reported on 38.8% of returns )(% of AGI for various income ranges: 69.1% for AGIs below $25k , 105.7% for AGIs $25k-50k , 226.9% for AGIs $50k-75k , 446.1% for AGIs $75k-100k , 597.6% for AGIs $100k-200k , 5258.7% for AGIs over 200k ) Net capital gain/loss in AGI: +$55,230 (reported on 36.3% of returns )Here:
+$55,230State:
+$23,652
(% of AGI for various income ranges: 29.0% for AGIs below $25k , 136.2% for AGIs $25k-50k , 164.5% for AGIs $50k-75k , 357.9% for AGIs $75k-100k , 828.8% for AGIs $100k-200k , 33258.3% for AGIs over 200k ) Profit/loss from business: +$23,868 (reported on 19.6% of returns )Here:
+$23,868State:
+$11,710
(% of AGI for various income ranges: 143.2% for AGIs below $25k , 153.9% for AGIs $25k-50k , 304.6% for AGIs $50k-75k , 508.9% for AGIs $75k-100k , 716.6% for AGIs $100k-200k , 5388.6% for AGIs over 200k ) Taxable individual retirement arrangement distribution: $27,811 (reported on 12.5% of returns )27614:
$27,811North Carolina:
$20,247
(% of AGI for various income ranges: 69.9% for AGIs below $25k , 166.5% for AGIs $25k-50k , 379.3% for AGIs $50k-75k , 683.6% for AGIs $75k-100k , 1066.2% for AGIs $100k-200k , 2446.3% for AGIs over 200k ) Self-employed (Keogh) retirement plans: $31,141 (reported on 2.0% of returns )27614:
$31,141North Carolina:
$26,749
(% of AGI for various income ranges: 40.5% for AGIs $50k-75k , 53.7% for AGIs $100k-200k , 950.3% for AGIs over 200k ) Total itemized deductions: $41,455 (reported on 21.7% of returns )Here:
$41,455State:
$34,549
(% of AGI for various income ranges: 96.6% for AGIs below $25k , 215.8% for AGIs $25k-50k , 584.5% for AGIs $50k-75k , 1108.3% for AGIs $75k-100k , 1734.5% for AGIs $100k-200k , 10102.1% for AGIs over 200k ) Charity contributions: $17,366 (reported on 18.8% of returns )Here:
$17,366State:
$13,360
(% of AGI for various income ranges: 5.0% for AGIs below $25k , 26.7% for AGIs $25k-50k , 91.8% for AGIs $50k-75k , 200.0% for AGIs $75k-100k , 413.9% for AGIs $100k-200k , 4634.9% for AGIs over 200k ) Taxes paid: $8,810 (reported on 21.6% of returns )(% of AGI for various income ranges: 15.3% for AGIs below $25k , 38.7% for AGIs $25k-50k , 126.1% for AGIs $50k-75k , 270.4% for AGIs $75k-100k , 508.2% for AGIs $100k-200k , 1850.8% for AGIs over 200k ) Earned income credit: $2,061 (reported on 7.3% of returns )(% of AGI for various income ranges: 57.9% for AGIs below $25k , 54.8% for AGIs $25k-50k ) Percentage of individuals using paid preparers for their 2020 taxes: 92.6%(% for various income ranges: 91.1% for AGIs below $25k , 92.1% for AGIs $25k-50k , 91.9% for AGIs $50k-75k , 93.1% for AGIs $75k-100k , 93.1% for AGIs $100k-200k , 94.6% for AGIs over 200k )
Averages for the 2012 tax year for zip code 27614, filed in 2013:
Average Adjusted Gross Income (AGI) in 2012: $127,774 (Individual Income Tax Returns) Here:
$127,774State:
$54,937
Salary/wage: $103,651 (reported on 84.1% of returns )Here:
$103,651State:
$46,336
(% of AGI for various income ranges: 73.7% for AGIs below $25k , 74.8% for AGIs $25k-50k , 70.3% for AGIs $50k-75k , 73.3% for AGIs $75k-100k , 80.2% for AGIs $100k-200k , 61.1% for AGIs over 200k ) Taxable interest for individuals: $1,871 (reported on 54.2% of returns )This zip code:
$1,871North Carolina:
$1,298
(% of AGI for various income ranges: 2.4% for AGIs below $25k , 0.9% for AGIs $25k-50k , 0.9% for AGIs $50k-75k , 0.8% for AGIs $75k-100k , 0.5% for AGIs $100k-200k , 0.8% for AGIs over 200k ) Ordinary dividends: $8,680 (reported on 39.6% of returns )(% of AGI for various income ranges: 4.5% for AGIs below $25k , 2.2% for AGIs $25k-50k , 2.3% for AGIs $50k-75k , 2.1% for AGIs $75k-100k , 1.7% for AGIs $100k-200k , 3.2% for AGIs over 200k ) Net capital gain/loss in AGI: +$22,164 (reported on 34.8% of returns )Here:
+$22,164State:
+$12,740
(% of AGI for various income ranges: 0.9% for AGIs $25k-50k , 1.3% for AGIs $50k-75k , 0.9% for AGIs $75k-100k , 1.4% for AGIs $100k-200k , 9.9% for AGIs over 200k ) Profit/loss from business: +$20,647 (reported on 18.6% of returns )Here:
+$20,647State:
+$10,311
(% of AGI for various income ranges: 5.2% for AGIs below $25k , 5.0% for AGIs $25k-50k , 3.4% for AGIs $50k-75k , 2.7% for AGIs $75k-100k , 2.8% for AGIs $100k-200k , 2.9% for AGIs over 200k ) Taxable individual retirement arrangement distribution: $21,924 (reported on 13.1% of returns )27614:
$21,924North Carolina:
$15,575
(% of AGI for various income ranges: 5.6% for AGIs below $25k , 3.7% for AGIs $25k-50k , 3.8% for AGIs $50k-75k , 3.7% for AGIs $75k-100k , 2.8% for AGIs $100k-200k , 1.4% for AGIs over 200k ) Self-employment retirement plans: $22,057 (reported on 1.9% of returns )27614:
$22,057North Carolina:
$21,078
(% of AGI for various income ranges: 0.2% for AGIs $50k-75k , 0.2% for AGIs $100k-200k , 0.5% for AGIs over 200k ) Total itemized deductions: $35,379 (18% of AGI, reported on 60.1% of returns )Here:
$35,379State:
$23,438
Here:
18.3% of AGIState:
21.5% of AGI
(% of AGI for various income ranges: 21.3% for AGIs below $25k , 17.4% for AGIs $25k-50k , 20.5% for AGIs $50k-75k , 19.9% for AGIs $75k-100k , 19.2% for AGIs $100k-200k , 14.5% for AGIs over 200k ) Charity contributions: $5,291 (reported on 53.6% of returns )(% of AGI for various income ranges: 1.6% for AGIs below $25k , 1.8% for AGIs $25k-50k , 2.5% for AGIs $50k-75k , 2.4% for AGIs $75k-100k , 2.4% for AGIs $100k-200k , 2.1% for AGIs over 200k ) Taxes paid: $16,056 (reported on 60.0% of returns )27614:
$16,056State:
$8,823
(% of AGI for various income ranges: 4.1% for AGIs below $25k , 4.4% for AGIs $25k-50k , 5.9% for AGIs $50k-75k , 7.2% for AGIs $75k-100k , 8.2% for AGIs $100k-200k , 7.8% for AGIs over 200k ) Earned income credit: $1,898 (reported on 7.2% of returns )(% of AGI for various income ranges: 3.6% for AGIs below $25k , 0.8% for AGIs $25k-50k ) Percentage of individuals using paid preparers for their 2012 taxes: 48.8%(% for various income ranges: 41.1% for AGIs below $25k , 41.5% for AGIs $25k-50k , 48.2% for AGIs $50k-75k , 49.6% for AGIs $75k-100k , 50.0% for AGIs $100k-200k , 67.4% for AGIs over 200k )
Averages for the 2004 tax year for zip code 27614, filed in 2005:
Average Adjusted Gross Income (AGI) in 2004: $104,658 (Individual Income Tax Returns) Here:
$104,658State:
$45,376
Salary/wage: $90,896 (reported on 86.2% of returns )Here:
$90,896State:
$39,442
(% of AGI for various income ranges: 74.0% for AGIs $10k-25k , 80.6% for AGIs $25k-50k , 79.4% for AGIs $50k-75k , 80.7% for AGIs $75k-100k , 72.2% for AGIs over 100k ) Taxable interest for individuals: $2,189 (reported on 65.5% of returns )This zip code:
$2,189North Carolina:
$1,515
(% of AGI for various income ranges: 3.5% for AGIs $10k-25k , 1.3% for AGIs $25k-50k , 1.1% for AGIs $50k-75k , 1.1% for AGIs $75k-100k , 1.3% for AGIs over 100k ) Taxable dividends: $4,225 (reported on 47.2% of returns )(% of AGI for various income ranges: 4.0% for AGIs $10k-25k , 2.1% for AGIs $25k-50k , 1.5% for AGIs $50k-75k , 1.5% for AGIs $75k-100k , 1.8% for AGIs over 100k ) Net capital gain/loss: +$17,480 (reported on 41.1% of returns )Here:
+$17,480State:
+$11,152
(% of AGI for various income ranges: 0.7% for AGIs $10k-25k , 0.7% for AGIs $25k-50k , 1.0% for AGIs $50k-75k , 0.9% for AGIs $75k-100k , 8.8% for AGIs over 100k ) Profit/loss from business: +$20,773 (reported on 18.5% of returns )Here:
+$20,773State:
+$9,490
(% of AGI for various income ranges: 5.3% for AGIs $10k-25k , 3.7% for AGIs $25k-50k , 3.6% for AGIs $50k-75k , 3.9% for AGIs $75k-100k , 3.5% for AGIs over 100k ) IRA payment deduction: $3,377 (reported on 3.6% of returns )27614:
$3,377North Carolina:
$2,967
(% of AGI for various income ranges: 0.2% for AGIs $10k-25k , 0.4% for AGIs $25k-50k , 0.2% for AGIs $50k-75k , 0.2% for AGIs $75k-100k , 0.1% for AGIs over 100k ) Self-employed pension: $15,759 (reported on 2.4% of returns )Here:
$15,759North Carolina:
$14,754
(% of AGI for various income ranges: 0.1% for AGIs $25k-50k , 0.2% for AGIs $50k-75k , 0.3% for AGIs $75k-100k , 0.4% for AGIs over 100k ) Total itemized deductions: $29,834 (20% of AGI, reported on 64.6% of returns )Here:
$29,834State:
$19,464
Here:
19.8% of AGIState:
22.7% of AGI
(% of AGI for various income ranges: 21.7% for AGIs $10k-25k , 22.4% for AGIs $25k-50k , 22.8% for AGIs $50k-75k , 22.7% for AGIs $75k-100k , 16.9% for AGIs over 100k ) Charity contributions deductions: $4,877 (3% of AGI, reported on 59.7% of returns )Here:
3.1% of AGIState:
4.5% of AGI
(% of AGI for various income ranges: 2.2% for AGIs $10k-25k , 2.3% for AGIs $25k-50k , 2.8% for AGIs $50k-75k , 2.6% for AGIs $75k-100k , 2.8% for AGIs over 100k ) Total tax: $20,563 (reported on 84.5% of returns )27614:
$20,563State:
$7,257
(% of AGI for various income ranges: 4.9% for AGIs $10k-25k , 7.3% for AGIs $25k-50k , 9.0% for AGIs $50k-75k , 9.7% for AGIs $75k-100k , 19.0% for AGIs over 100k ) Earned income credit: $1,411 (reported on 4.2% of returns )Percentage of individuals using paid preparers for their 2004 taxes: 51.6%(% for various income ranges: 44.1% for AGIs below $10k , 49.9% for AGIs $10k-25k , 49.8% for AGIs $25k-50k , 51.3% for AGIs $50k-75k , 46.9% for AGIs $75k-100k , 58.4% for AGIs over 100k )
Estimated median household income in 2022: This zip code:
$128,187North Carolina:
$67,481
Nearest zip codes: 27615 ,
27587 ,
27613 ,
27609 ,
27616 ,
27612 .
Wake Forest Zip Code Map
Percentage of family households: This zip code:
48.9%North Carolina:
46.1%
Percentage of households with unmarried partners: This zip code:
3.9%North Carolina:
47.9%
Likely homosexual households (counted as self-reported same-sex unmarried-partner households)
Lesbian couples: 0.3% of all households Gay men: 0.0% of all households
Household received Food Stamps/SNAP in the past 12 months: 721Household did not receive Food Stamps/SNAP in the past 12 months: 12,927
Women who had a birth in the past 12 months: 512 (458 now married , 62 unmarried) Women who did not have a birth in the past 12 months: 7,400 (3,541 now married , 3,866 unmarried)
Housing units in zip code 27614 with a mortgage: 7,507 (1,227
second mortgage , 11
home equity loan , 1,243
both second mortgage and home equity loan )
Houses without a mortgage: 102
Median monthly owner costs for units with a mortgage: $2,213
Median monthly owner costs for units without a mortgage: $715
Residents with income below the poverty level in 2022:
This zip code:
7.4%Whole state:
12.8%
Residents with income below 50% of the poverty level in 2022:
This zip code:
4.1%Whole state:
6.8%
Median number of rooms in houses and condos: Median number of rooms in apartments: Notable locations in this zip code not listed on our city pages
Click to draw/clear zip code borders Notable location: (A) . Display/hide its location on the map
Churches in zip code 27614 include: (A) , Olde Mount Vernon Church (B) , Bayleaf Church (C) , Mount Pleasant Church (D) , Mount Vernon Church (E) , Pleasant Union Church (F) . Display/hide their locations on the map
Reservoirs: (A) , Wakefield Pond Number Two (B) , Noname (C) , Ragsdale Pond (D) . Display/hide their locations on the map
Creeks: (A) , New Light Creek (B) , Lower Barton Creek (C) , Honeycutt Creek (D) . Display/hide their locations on the map
Year house built (houses)
61 2020 or later2,239 2010 to 20198,455 2000 to 20092,458 1990 to 19991,217 1980 to 1989611 1970 to 1979198 1960 to 196957 1950 to 19590 1940 to 194948 1939 or earlier
Zip code 27614 household income distribution in 2022 623 Less than $10,000233 $10,000 to $14,999380 $15,000 to $19,999245 $20,000 to $24,999238 $25,000 to $29,999194 $30,000 to $34,999550 $35,000 to $39,999319 $40,000 to $44,999173 $45,000 to $49,999501 $50,000 to $59,999722 $60,000 to $74,9991,397 $75,000 to $99,9991,237 $100,000 to $124,999961 $125,000 to $149,9992,437 $150,000 to $199,9993,722 $200,000 or moreEstimate of home value of owner-occupied houses/condos in 2022 in zip code 27614 73 Less than $10,0009 $10,000 to $14,99921 $50,000 to $59,99930 $100,000 to $124,99933 $125,000 to $149,999139 $150,000 to $174,999135 $175,000 to $199,999531 $200,000 to $249,999661 $250,000 to $299,9992,018 $300,000 to $399,9992,348 $400,000 to $499,9994,249 $500,000 to $749,999891 $750,000 to $999,999703 $1,000,000 to $1,499,999266 $1,500,000 to $1,999,999153 $2,000,000 or moreRent paid by renters in 2022 in zip code 27614 10 $100 to $14915 $150 to $1999 $200 to $24928 $300 to $34968 $400 to $44963 $450 to $49910 $500 to $54917 $600 to $64964 $700 to $74978 $750 to $799262 $800 to $8999 $900 to $999583 $1,000 to $1,2491,290 $1,250 to $1,4991,084 $1,500 to $1,999212 $2,000 to $2,49956 $2,500 to $2,999160 $3,500 or more240 No cash rent
Median gross rent in 2022: $1,476.
Median price asked for vacant for-sale houses and condos in 2022: $537,488.
Estimated median house (or condo) value in 2022 for: White Non-Hispanic householders: $567,751Black or African American householders: $524,577American Indian or Alaska Native householders: $172,291Asian householders: $665,451Native Hawaiian and other Pacific Islander householders: $912,132Some other race householders: $329,381Two or more races householders: $709,436Hispanic or Latino householders: $591,264Estimated median house or condo value in 2022: $564,306
27614:
$564,306North Carolina:
$280,600
Lower value quartile - upper value quartile: $397,712 - $775,600
Mean price in 2022: Detached houses: $689,865Here:
$689,865State:
$375,326
Townhouses or other attached units: $322,894Here:
$322,894State:
$317,935
In 5-or-more-unit structures: $200,557Here:
$200,557State:
$329,290
Mobile homes: $367,950Here:
$367,950State:
$124,933
Housing units in structures:
One, detached: 9,006One, attached: 2,2343 or 4: 1305 to 9: 58010 to 19: 1,10820 to 49: 1,28650 or more: 1,006Mobile homes: 124Unemployment : 2.9%
Means of transportation to work in zip code 27614 58.7% 10,209 Drove a car alone8.4% 1,455 Carpooled0.2% 30 Walked1.6% 278 Other means37.6% 6,529 Worked at homeTravel time to work (commute) in zip code 27614 114 Less than 5 minutes543 5 to 9 minutes1,080 10 to 14 minutes1,681 15 to 19 minutes1,842 20 to 24 minutes1,017 25 to 29 minutes2,494 30 to 34 minutes844 35 to 39 minutes625 40 to 44 minutes1,265 45 to 59 minutes275 60 to 89 minutes147 90 or more minutes
Neighborhoods in zip code 27614: Percentage of zip code residents living and working in this county: 84.5%
Household type by relationship:
Households: 34,343
Male householders: 6,503 (1,023 living alone ), Female householders: 7,256 (2,404 living alone )8,257 spouses (8,049 opposite-sex spouses ), 766 unmarried partners , (712 opposite-sex unmarried partners ), 9,578 children (9,267 natural , 176 adopted , 131 stepchildren ), 288 grandchildren , 218 brothers or sisters , 345 parents , 0 foster children , 494 other relatives , 698 non-relatives In group quarters: 47 (-1 institutionalized population )
Size of family households: 4,071 2-persons , 2,135 3-persons , 2,360 4-persons , 516 5-persons , 205 6-persons , 109 7-or-more-persons
Size of nonfamily households: 3,422 1-person , 792 2-persons , 99 3-persons , 13 5-persons
6,442 married couples with children. single-parent households (273 men , 858 women ).
92.1% of residents of 27614 zip code speak English at home. of residents speak Spanish at home (77% very well, 16% well, 6% not well, 2% not at all ).of residents speak other Indo-European language at home (86% very well, 8% well, 7% not well ).of residents speak Asian or Pacific Island language at home (90% very well, 5% well, 5% not well ).of residents speak other language at home (90% very well, 10% well ).
Foreign born population: 2,804 (8.2%)
(73.3%
of them are naturalized citizens )
This zip code:
8.2%Whole state:
8.6%
14% Bhutan 10% India 9% Uruguay 6% Cuba 5% Uganda 5% Sweden 4% Liberia 19% English 8% Irish 8% American 7% German 5% European 5% Italian 2% Nigerian
Year of entry for the foreign-born population
694 2010 or later 834 2000 to 2009 493 1990 to 1999 1,068 Before 1990
There are
208 Medical Specialists in Zip Code 27614 .
Facilities with environmental interests located in this zip code:
CITY OF RALEIGH FALLS LAKE PUMP STATION (2 POSSUM TRACK ROAD in RALEIGH, NC)
AIR MINOR (AIRS/AFS) STATE MASTER (North Carolina facility info) - AIR PROGRAM, UNDERGROUND STORAGE TANK PROGRAM CRITERIA AND HAZARDOUS AIR POLLUTANT INVENTORY (Inventory of air pollution sources) Business SIC classification: SEWERAGE SYSTEMS; NONCLASSIFIABLE ESTABLISHMENTS
BRASSFIELD ELEMENTARY (2001 BRASSFIELD RD in RALEIGH, NC)
(National Center for Education Statistics) - STATE ID-334 Organizations: WAKE COUNTY SCHOOLS (SCHOOL DISTRICT)
BAYLEAF BAPTIST CHURCH WATER SYS (12200 BAYLEAF CHURCH RD in RALEIGH, NC)
(Integrated Compliance Information System) - ICIS-04-1999-0442, FORMAL ENFORCEMENT ACTION
Housing units lacking complete plumbing facilities: 0.1%
Housing units lacking complete kitchen facilities: 0.5%
49.1% Utility gas 47.2% Electricity 3.2% Bottled, tank, or LP gas
Population in 1990: 7,200. Population change in the 1990s: +3,845 (+53.4%).
Place of birth for U.S.-born residents:
This state: 12,717Northeast: 7,748Midwest: 4,252South: 5,493West: 1,255
46% of the 27614 zip code residents lived in the same house 5 years ago.
Out of people who lived in different houses, 54% lived in this county.
Out of people who lived in different counties, 50% lived in North Carolina.
90% of the 27614 zip code residents lived in the same house 1 year ago.
Out of people who lived in different houses, 54% moved from this county.
Out of people who lived in different houses, 26% moved from different county within same state.
Out of people who lived in different houses, 16% moved from different state.
Out of people who lived in different houses, 1% moved from abroad.
Private vs. public school enrollment:
Students in private schools in grades 1 to 8 (elementary and middle school): 862
Here:
23.9%North Carolina:
13.8%
Students in private schools in grades 9 to 12 (high school): 417
Here:
17.9%North Carolina:
11.9%
Students in private undergraduate colleges: 43
Here:
3.9%North Carolina:
19.3%
Occupation by median earnings in the past 12 months ($)
149,116 Management occupations 135,937 Health diagnosing and treating practitioners and other technical occupations 106,691 Computer and mathematical occupations 100,582 Sales and related occupations 99,657 Architecture and engineering occupations 92,808 Life, physical, and social science occupations
Companies with federal contracts located in this zip code (RALEIGH, NC):
HARRY L HURD ASSOC , INC (2605 CHARENSON PL; small business) in 6 contracts from 1999 to 2004
Contracts for Other Research and Development -- Basic Research (R&D), Other Defense -- Basic Research (R&D) by Army, NavySigned by year: 2000: $56,823; 2001: $0; 2002: $71,864; 2003: $74,634; 2004: $77,404; 2005: $0; 2006: $0.
Biggest contracts: with Army for Other Research and Development -- Basic Research (R&D). Signed on 2004-03-12. Completion date: 2002-12-07.
, same as above. Signed on 2003-01-29. Completion date: 2002-12-07.
, same as above. Signed on 2002-03-08. Completion date: 2002-12-07.
, same as above. Signed on 2000-12-20. Completion date: 2003-12-31.
INTEGRATED COMPLEX SYSTEMS COR (15720 WICKERSHIRE CT; small business) in 3 contracts from 1999 to 2002
$179,365 with Navy for Miscellaneous Electrical and Electronic Components. Taking place in VA. Signed on 1999-12-29. Completion date: 2000-06-29.
with Navy for Systems Engineering Services. Taking place in CA. Signed on 2002-06-28. Completion date: 2002-07-03.
, same as above. Signed on 2002-10-01. Completion date: 2002-07-03.
VICTORIA I UKWU LLC (8521 SIXFOUR RD STE 106; small business) employees , $0 revenue . 8A Firm, Small Disadvantaged Business: $50,000 in 3 contracts from 1999 to 2002
$35,000 with National Institutes of Health for Logistics Support Services. Signed on 1999-10-15. Completion date: 2000-09-15.
with EPA for Logistics Support Services. Signed on 2002-08-15. Completion date: 2003-09-15.
, same as above. Signed on 2002-08-15. Completion date: 2003-09-15.
TRINKETS ADVERTISING SPECIALTI (818 MOUNT VERNON CHURCH RD; small business) in 4 contracts from 2004 to 2005
$10,123 with Army for Bottles and Jars. Signed on 2004-07-07. Completion date: 2004-07-15.
with Army for Arts/Graphics Services. Signed on 2005-03-04. Completion date: 2005-04-01.
with Army for Games, Toys and Wheeled Goods. Taking place in CA. Signed on 2005-09-03. Completion date: 2005-09-15.
with Army for Books and Pamphlets. Taking place in CA. Signed on 2004-09-28. Completion date: 2004-10-15.
HANNAN ASSOCIATES (1405 COOL SPRING RD; small business)
$4,491 with Army for Office Furniture. Taking place in WI. Signed on 2004-09-16. Completion date: 2004-10-29.
Top industries in this zip code by the number of employees in 2005:
Accommodation and Food Services: Limited-Service Restaurants (100-249 employees: 2 establishments, 20-49 employees: 6 establishments, 10-19 employees: 2 establishments, 5-9 employees: 1 establishment)Arts, Entertainment, and Recreation: Fitness and Recreational Sports Centers (250-499: 1, 20-49: 1, 1-4: 2)Health Care and Social Assistance: Child Day Care Services (100-249: 1, 20-49: 1, 10-19: 1, 1-4: 3)Accommodation and Food Services: Full-Service Restaurants (50-99: 1, 20-49: 2, 10-19: 2, 5-9: 1, 1-4: 1)Health Care and Social Assistance: Freestanding Ambulatory Surgical and Emergency Centers (100-249: 1)Other Services (except Public Administration): Beauty Salons (20-49: 1, 10-19: 3, 5-9: 2, 1-4: 1)Health Care and Social Assistance: Offices of Dentists (20-49: 1, 10-19: 1, 5-9: 4, 1-4: 5)Health Care and Social Assistance: Offices of Physicians (except Mental Health Specialists) (10-19: 1, 5-9: 6, 1-4: 10)
People in group quarters in 2010:
26 people in nursing facilities/skilled-nursing facilities
6 people in group homes intended for adults
Fatal accident statistics in 2014:
Fatal accident count: 1Vehicles involved in fatal accidents: 2Fatal accidents caused by drunken drivers: 0Fatalities: 1Persons involved in fatal accidents: 5Pedestrians involved in fatal accidents: 0
Fatal accident statistics in 2012:
Fatal accident count: 1Vehicles involved in fatal accidents: 2Fatal accidents caused by drunken drivers: 0Fatalities: 1Persons involved in fatal accidents: 2Pedestrians involved in fatal accidents: 0
Home Mortgage Disclosure Act Aggregated Statistics For Year 2009(Based on 6 partial tracts) A) FHA, FSA/RHS & VA B) Conventional C) Refinancings D) Home Improvement Loans F) Non-occupant Loans on G) Loans On Manufactured Number Average Value Number Average Value Number Average Value Number Average Value Number Average Value Number Average Value
LOANS ORIGINATED 184 $170,673 399 $305,712 2,040 $268,161 45 $157,523 80 $260,179 5 $93,376 APPLICATIONS APPROVED, NOT ACCEPTED 10 $174,538 20 $369,628 148 $285,419 4 $126,115 5 $592,016 1 $766,060 APPLICATIONS DENIED 20 $151,532 39 $270,287 392 $324,988 25 $58,194 21 $258,663 4 $43,215 APPLICATIONS WITHDRAWN 20 $170,398 50 $306,994 282 $254,953 11 $134,971 8 $183,338 0 $0 FILES CLOSED FOR INCOMPLETENESS 5 $177,862 7 $245,819 81 $257,342 3 $58,440 1 $81,040 0 $0
Aggregated Statistics For Year 2008(Based on 6 partial tracts) A) FHA, FSA/RHS & VA B) Conventional C) Refinancings D) Home Improvement Loans E) Loans on Dwellings For 5+ Families F) Non-occupant Loans on G) Loans On Manufactured Number Average Value Number Average Value Number Average Value Number Average Value Number Average Value Number Average Value Number Average Value
LOANS ORIGINATED 151 $164,361 595 $296,202 963 $263,006 50 $143,374 1 $874,640 95 $215,803 1 $162,860 APPLICATIONS APPROVED, NOT ACCEPTED 9 $151,634 54 $375,324 124 $252,634 7 $82,997 0 $0 9 $142,407 0 $0 APPLICATIONS DENIED 25 $158,725 55 $252,605 350 $242,217 65 $158,238 0 $0 23 $148,937 6 $34,958 APPLICATIONS WITHDRAWN 14 $176,535 99 $259,111 204 $274,437 19 $201,916 0 $0 13 $199,490 0 $0 FILES CLOSED FOR INCOMPLETENESS 5 $209,652 5 $265,618 41 $275,950 4 $414,798 0 $0 1 $108,060 0 $0
Aggregated Statistics For Year 2007(Based on 6 partial tracts) A) FHA, FSA/RHS & VA B) Conventional C) Refinancings D) Home Improvement Loans E) Loans on Dwellings For 5+ Families F) Non-occupant Loans on G) Loans On Manufactured Number Average Value Number Average Value Number Average Value Number Average Value Number Average Value Number Average Value Number Average Value
LOANS ORIGINATED 56 $166,997 1,251 $249,428 774 $259,380 73 $100,982 1 $867,400 190 $165,843 2 $90,355 APPLICATIONS APPROVED, NOT ACCEPTED 4 $145,872 128 $290,525 169 $200,876 24 $84,977 0 $0 16 $176,028 1 $59,970 APPLICATIONS DENIED 7 $142,214 161 $271,260 444 $228,492 66 $94,712 0 $0 32 $264,101 4 $29,985 APPLICATIONS WITHDRAWN 7 $178,904 142 $224,759 215 $250,928 16 $122,586 0 $0 26 $185,941 3 $81,977 FILES CLOSED FOR INCOMPLETENESS 1 $212,330 24 $273,399 65 $317,896 2 $246,710 0 $0 5 $113,038 0 $0
Aggregated Statistics For Year 2006(Based on 6 partial tracts) A) FHA, FSA/RHS & VA B) Conventional C) Refinancings D) Home Improvement Loans E) Loans on Dwellings For 5+ Families F) Non-occupant Loans on G) Loans On Manufactured Number Average Value Number Average Value Number Average Value Number Average Value Number Average Value Number Average Value Number Average Value
LOANS ORIGINATED 71 $164,478 1,835 $219,900 836 $222,237 100 $238,112 2 $6,252,245 269 $212,569 7 $85,520 APPLICATIONS APPROVED, NOT ACCEPTED 3 $169,630 182 $214,925 172 $184,931 17 $70,831 0 $0 33 $144,758 6 $82,422 APPLICATIONS DENIED 5 $150,572 187 $336,858 382 $197,784 88 $84,918 0 $0 26 $223,072 8 $77,422 APPLICATIONS WITHDRAWN 7 $125,270 217 $246,015 180 $202,748 15 $132,497 0 $0 32 $162,743 1 $320,220 FILES CLOSED FOR INCOMPLETENESS 0 $0 37 $225,288 80 $209,951 2 $36,715 0 $0 7 $126,329 0 $0
Aggregated Statistics For Year 2005(Based on 6 partial tracts) A) FHA, FSA/RHS & VA B) Conventional C) Refinancings D) Home Improvement Loans F) Non-occupant Loans on G) Loans On Manufactured Number Average Value Number Average Value Number Average Value Number Average Value Number Average Value Number Average Value
LOANS ORIGINATED 79 $154,274 1,836 $212,439 994 $232,125 62 $128,488 205 $153,850 6 $206,927 APPLICATIONS APPROVED, NOT ACCEPTED 3 $103,160 130 $184,575 119 $173,140 20 $77,234 16 $108,242 3 $52,290 APPLICATIONS DENIED 12 $154,181 169 $164,661 400 $210,923 59 $70,622 27 $101,927 21 $89,781 APPLICATIONS WITHDRAWN 11 $166,508 212 $199,250 198 $206,136 24 $109,989 26 $140,986 6 $74,508 FILES CLOSED FOR INCOMPLETENESS 2 $133,310 40 $229,622 125 $228,526 4 $71,112 9 $196,963 0 $0
Aggregated Statistics For Year 2004(Based on 6 partial tracts) A) FHA, FSA/RHS & VA B) Conventional C) Refinancings D) Home Improvement Loans F) Non-occupant Loans on G) Loans On Manufactured Number Average Value Number Average Value Number Average Value Number Average Value Number Average Value Number Average Value
LOANS ORIGINATED 125 $141,495 1,586 $205,811 1,027 $233,994 57 $75,398 155 $159,075 4 $62,648 APPLICATIONS APPROVED, NOT ACCEPTED 8 $145,675 120 $259,280 112 $185,499 14 $45,420 14 $256,978 4 $124,965 APPLICATIONS DENIED 30 $129,872 127 $215,390 327 $187,286 59 $61,775 18 $141,023 12 $64,174 APPLICATIONS WITHDRAWN 19 $152,842 189 $187,719 251 $231,995 9 $121,379 18 $216,043 0 $0 FILES CLOSED FOR INCOMPLETENESS 7 $150,387 20 $250,421 69 $218,229 1 $36,470 4 $281,370 0 $0
Aggregated Statistics For Year 2003(Based on 6 partial tracts) A) FHA, FSA/RHS & VA B) Conventional C) Refinancings D) Home Improvement Loans F) Non-occupant Loans on Number Average Value Number Average Value Number Average Value Number Average Value Number Average Value
LOANS ORIGINATED 151 $137,888 1,156 $212,834 2,986 $228,193 35 $55,603 94 $140,201 APPLICATIONS APPROVED, NOT ACCEPTED 6 $137,093 101 $248,885 240 $211,784 9 $34,339 14 $86,232 APPLICATIONS DENIED 28 $135,362 93 $181,009 390 $226,524 24 $32,918 9 $109,873 APPLICATIONS WITHDRAWN 22 $142,758 138 $209,585 300 $207,633 8 $18,402 11 $152,358 FILES CLOSED FOR INCOMPLETENESS 4 $148,602 13 $239,007 64 $223,941 3 $49,533 2 $107,380
Aggregated Statistics For Year 2002(Based on 4 partial tracts) A) FHA, FSA/RHS & VA B) Conventional C) Refinancings D) Home Improvement Loans F) Non-occupant Loans on Number Average Value Number Average Value Number Average Value Number Average Value Number Average Value
LOANS ORIGINATED 16 $156,524 522 $268,021 1,553 $256,629 18 $56,202 43 $163,313 APPLICATIONS APPROVED, NOT ACCEPTED 5 $133,368 61 $262,185 97 $322,454 5 $81,552 2 $127,880 APPLICATIONS DENIED 6 $121,173 46 $239,911 137 $253,172 13 $70,094 1 $344,640 APPLICATIONS WITHDRAWN 2 $149,620 46 $219,360 137 $275,019 8 $49,651 4 $385,668 FILES CLOSED FOR INCOMPLETENESS 0 $0 7 $218,171 24 $270,031 0 $0 1 $44,760
Aggregated Statistics For Year 2001(Based on 4 partial tracts) A) FHA, FSA/RHS & VA B) Conventional C) Refinancings D) Home Improvement Loans E) Loans on Dwellings For 5+ Families F) Non-occupant Loans on Number Average Value Number Average Value Number Average Value Number Average Value Number Average Value Number Average Value
LOANS ORIGINATED 22 $144,355 545 $266,695 963 $260,270 35 $66,667 1 $1,023,040 26 $227,037 APPLICATIONS APPROVED, NOT ACCEPTED 3 $118,867 39 $269,776 49 $205,899 4 $51,755 0 $0 1 $180,960 APPLICATIONS DENIED 1 $101,030 36 $153,544 96 $224,397 17 $64,298 0 $0 5 $136,250 APPLICATIONS WITHDRAWN 4 $130,395 37 $282,286 103 $247,558 9 $42,069 0 $0 6 $153,852 FILES CLOSED FOR INCOMPLETENESS 0 $0 11 $328,946 25 $224,471 0 $0 0 $0 1 $101,340
Aggregated Statistics For Year 2000(Based on 4 partial tracts) A) FHA, FSA/RHS & VA B) Conventional C) Refinancings D) Home Improvement Loans F) Non-occupant Loans on Number Average Value Number Average Value Number Average Value Number Average Value Number Average Value
LOANS ORIGINATED 10 $130,160 647 $246,755 179 $225,511 33 $39,125 14 $137,936 APPLICATIONS APPROVED, NOT ACCEPTED 1 $18,540 36 $191,858 23 $198,204 9 $51,969 2 $405,020 APPLICATIONS DENIED 1 $196,940 73 $157,774 54 $177,074 9 $66,399 7 $176,633 APPLICATIONS WITHDRAWN 5 $115,992 53 $317,112 44 $164,744 7 $62,784 4 $184,700 FILES CLOSED FOR INCOMPLETENESS 0 $0 10 $271,153 19 $206,431 1 $35,170 5 $178,136
Aggregated Statistics For Year 1999(Based on 3 partial tracts) A) FHA, FSA/RHS & VA B) Conventional C) Refinancings D) Home Improvement Loans F) Non-occupant Loans on Number Average Value Number Average Value Number Average Value Number Average Value Number Average Value
LOANS ORIGINATED 60 $130,241 521 $210,791 312 $179,506 30 $32,670 16 $118,346 APPLICATIONS APPROVED, NOT ACCEPTED 1 $95,040 38 $190,786 53 $135,519 9 $31,766 2 $86,740 APPLICATIONS DENIED 4 $101,345 58 $125,719 90 $128,932 18 $26,341 6 $93,752 APPLICATIONS WITHDRAWN 7 $134,679 44 $188,171 62 $141,004 6 $57,428 2 $97,890 FILES CLOSED FOR INCOMPLETENESS 1 $142,780 13 $225,846 26 $163,355 1 $13,870 1 $85,920
Detailed HMDA statistics for the following Tracts:
0538.01
,
0538.02 ,
0540.09
Private Mortgage Insurance Companies Aggregated Statistics For Year 2009(Based on 6 partial tracts) A) Conventional B) Refinancings C) Non-occupant Loans on Number Average Value Number Average Value Number Average Value
LOANS ORIGINATED 56 $273,122 55 $253,243 2 $91,170 APPLICATIONS APPROVED, NOT ACCEPTED 24 $329,630 13 $277,347 0 $0 APPLICATIONS DENIED 4 $224,075 12 $245,852 0 $0 APPLICATIONS WITHDRAWN 1 $359,980 5 $285,384 0 $0 FILES CLOSED FOR INCOMPLETENESS 1 $212,280 1 $273,100 0 $0
Aggregated Statistics For Year 2008(Based on 6 partial tracts) A) Conventional B) Refinancings C) Non-occupant Loans on D) Loans On Manufactured Number Average Value Number Average Value Number Average Value Number Average Value
LOANS ORIGINATED 125 $235,092 86 $252,942 10 $208,367 0 $0 APPLICATIONS APPROVED, NOT ACCEPTED 36 $245,206 18 $243,411 1 $97,250 0 $0 APPLICATIONS DENIED 2 $125,610 9 $268,273 1 $186,390 0 $0 APPLICATIONS WITHDRAWN 6 $354,433 3 $263,593 1 $265,000 1 $147,490 FILES CLOSED FOR INCOMPLETENESS 2 $153,570 1 $138,580 2 $159,650 0 $0
Aggregated Statistics For Year 2007(Based on 6 partial tracts) A) Conventional B) Refinancings C) Non-occupant Loans on Number Average Value Number Average Value Number Average Value
LOANS ORIGINATED 235 $206,084 74 $229,394 28 $175,249 APPLICATIONS APPROVED, NOT ACCEPTED 23 $239,344 17 $253,589 3 $155,057 APPLICATIONS DENIED 6 $842,742 1 $99,680 2 $242,735 APPLICATIONS WITHDRAWN 9 $259,117 3 $301,343 1 $141,150 FILES CLOSED FOR INCOMPLETENESS 4 $447,282 0 $0 0 $0
Aggregated Statistics For Year 2006(Based on 6 partial tracts) A) Conventional B) Refinancings C) Non-occupant Loans on Number Average Value Number Average Value Number Average Value
LOANS ORIGINATED 134 $195,433 30 $211,157 19 $126,382 APPLICATIONS APPROVED, NOT ACCEPTED 10 $262,831 14 $205,780 1 $350,770 APPLICATIONS DENIED 1 $66,450 2 $154,785 0 $0 APPLICATIONS WITHDRAWN 4 $283,322 8 $203,466 1 $187,200 FILES CLOSED FOR INCOMPLETENESS 0 $0 1 $319,700 0 $0
Aggregated Statistics For Year 2005(Based on 6 partial tracts) A) Conventional B) Refinancings C) Non-occupant Loans on Number Average Value Number Average Value Number Average Value
LOANS ORIGINATED 119 $204,705 44 $217,859 18 $149,654 APPLICATIONS APPROVED, NOT ACCEPTED 14 $281,616 10 $223,287 3 $203,530 APPLICATIONS DENIED 2 $134,120 0 $0 2 $74,150 APPLICATIONS WITHDRAWN 8 $248,390 2 $214,755 2 $135,335 FILES CLOSED FOR INCOMPLETENESS 1 $127,230 0 $0 0 $0
Aggregated Statistics For Year 2004(Based on 6 partial tracts) A) Conventional B) Refinancings C) Non-occupant Loans on D) Loans On Manufactured Number Average Value Number Average Value Number Average Value Number Average Value
LOANS ORIGINATED 96 $186,879 59 $181,747 19 $139,544 2 $97,895 APPLICATIONS APPROVED, NOT ACCEPTED 20 $212,457 16 $181,891 3 $132,367 0 $0 APPLICATIONS DENIED 3 $141,040 0 $0 2 $111,430 0 $0 APPLICATIONS WITHDRAWN 9 $242,247 6 $201,328 3 $347,510 0 $0 FILES CLOSED FOR INCOMPLETENESS 3 $195,173 2 $107,380 0 $0 0 $0
Aggregated Statistics For Year 2003(Based on 6 partial tracts) A) Conventional B) Refinancings C) Non-occupant Loans on Number Average Value Number Average Value Number Average Value
LOANS ORIGINATED 133 $182,585 178 $193,676 13 $129,482 APPLICATIONS APPROVED, NOT ACCEPTED 15 $190,565 45 $214,122 0 $0 APPLICATIONS DENIED 1 $81,840 4 $165,475 0 $0 APPLICATIONS WITHDRAWN 6 $148,568 7 $224,389 1 $125,470 FILES CLOSED FOR INCOMPLETENESS 0 $0 0 $0 0 $0
Aggregated Statistics For Year 2002(Based on 4 partial tracts) A) Conventional B) Refinancings C) Non-occupant Loans on Number Average Value Number Average Value Number Average Value
LOANS ORIGINATED 53 $211,458 37 $267,681 1 $226,990 APPLICATIONS APPROVED, NOT ACCEPTED 10 $277,507 18 $233,288 0 $0 APPLICATIONS DENIED 2 $354,560 0 $0 0 $0 APPLICATIONS WITHDRAWN 2 $355,265 5 $245,578 0 $0 FILES CLOSED FOR INCOMPLETENESS 2 $294,115 1 $705,740 0 $0
Aggregated Statistics For Year 2001(Based on 4 partial tracts) A) Conventional B) Refinancings C) Non-occupant Loans on Number Average Value Number Average Value Number Average Value
LOANS ORIGINATED 58 $243,828 34 $221,625 1 $97,720 APPLICATIONS APPROVED, NOT ACCEPTED 5 $309,242 7 $292,151 0 $0 APPLICATIONS DENIED 0 $0 1 $242,970 0 $0 APPLICATIONS WITHDRAWN 1 $277,500 0 $0 0 $0 FILES CLOSED FOR INCOMPLETENESS 2 $195,945 0 $0 0 $0
Aggregated Statistics For Year 2000(Based on 4 partial tracts) A) Conventional B) Refinancings Number Average Value Number Average Value
LOANS ORIGINATED 62 $237,890 9 $240,774 APPLICATIONS APPROVED, NOT ACCEPTED 12 $307,827 1 $224,430 APPLICATIONS DENIED 3 $196,930 3 $388,827 APPLICATIONS WITHDRAWN 2 $252,140 0 $0 FILES CLOSED FOR INCOMPLETENESS 2 $126,860 0 $0
Aggregated Statistics For Year 1999(Based on 3 partial tracts) A) Conventional B) Refinancings C) Non-occupant Loans on Number Average Value Number Average Value Number Average Value
LOANS ORIGINATED 128 $192,701 25 $162,562 3 $153,353 APPLICATIONS APPROVED, NOT ACCEPTED 13 $237,355 5 $165,868 0 $0 APPLICATIONS DENIED 5 $263,730 2 $170,220 0 $0 APPLICATIONS WITHDRAWN 2 $218,385 1 $120,250 0 $0 FILES CLOSED FOR INCOMPLETENESS 1 $158,320 2 $192,120 0 $0
Detailed PMIC statistics for the following Tracts:
0538.01
,
0538.02 ,
0540.09
2002 - 2018 National Fire Incident Reporting System (NFIRS) incidents See full 2006 National Fire Incident Reporting System statistics for zip code 27614, North Carolina
Most common first names in zip code 27614 among deceased individuals Name Count Lived (average)
John 27 76.2 years James 21 72.3 years Mary 19 78.1 years William 18 81.7 years George 17 75.2 years Charles 14 77.8 years Robert 13 72.6 years Elizabeth 13 83.3 years Ruth 13 86.9 years Mildred 12 87.2 years
Most common last names in zip code 27614 among deceased individuals Last name Count Lived (average)
Bailey 13 78.0 years Scott 10 66.2 years Johnson 10 71.1 years Smith 9 81.2 years Jones 8 77.6 years Harris 7 69.7 years Miller 6 85.5 years Ray 6 72.0 years Williams 5 76.0 years Baker 5 87.2 years
Businesses in zip code 27614
Name Count Name Count
AT&T 1 Jones New York 3 Ace Hardware 1 Kroger 1 Advance Auto Parts 1 Nike 3 Blockbuster 1 Starbucks 1 CVS 1 Subway 1 Domino's Pizza 1 U-Haul 1 Dunkin Donuts 1 UPS 3 FedEx 2 Walgreens 1 GNC 1 YMCA 1 Holiday Inn 1

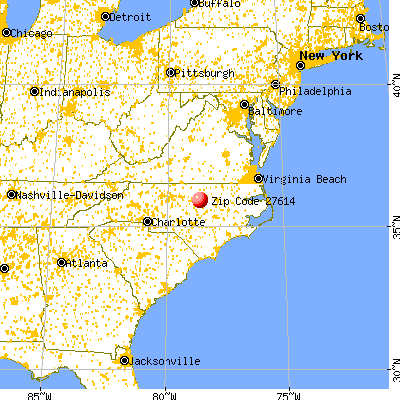


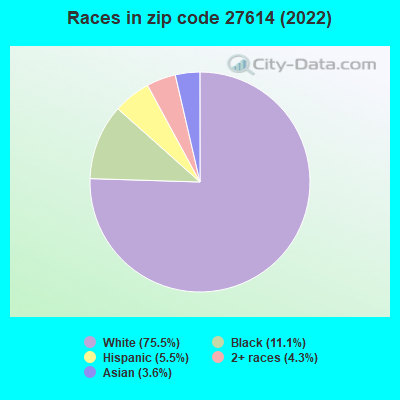


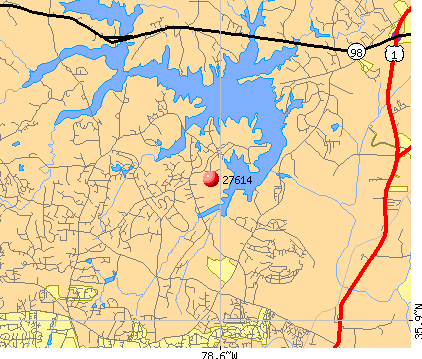 Nearest zip codes: 27615, 27587, 27613, 27609, 27616, 27612.
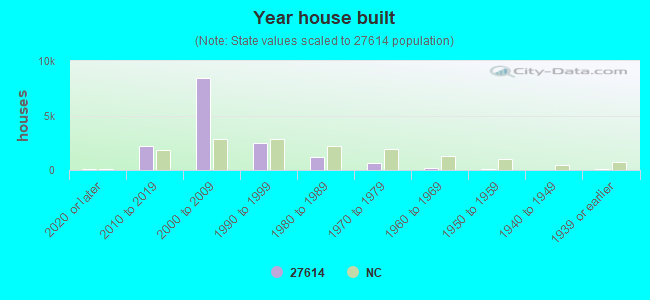

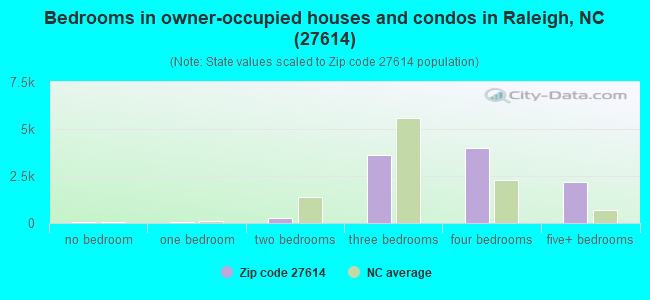
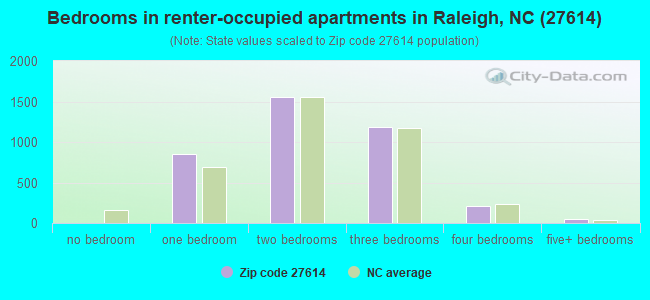
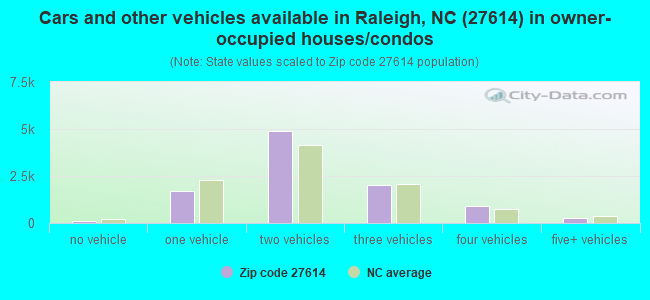
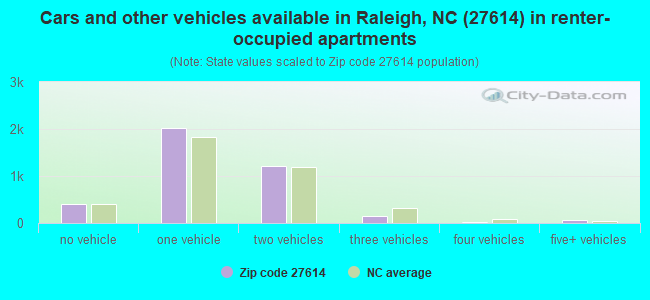


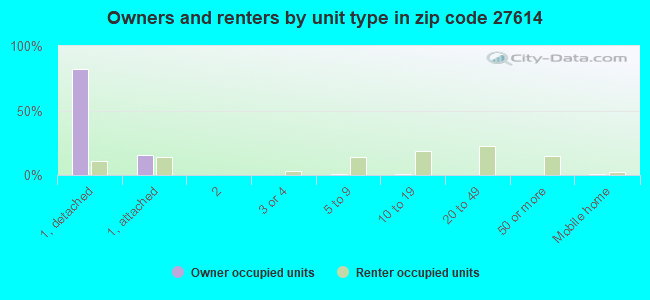
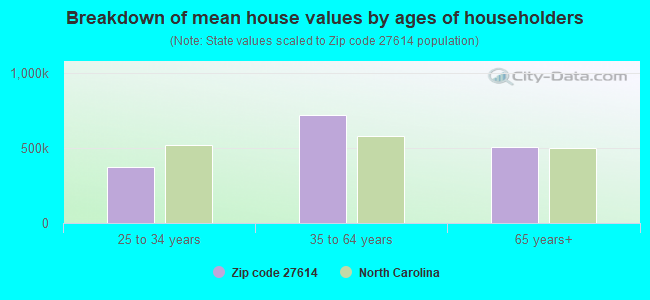


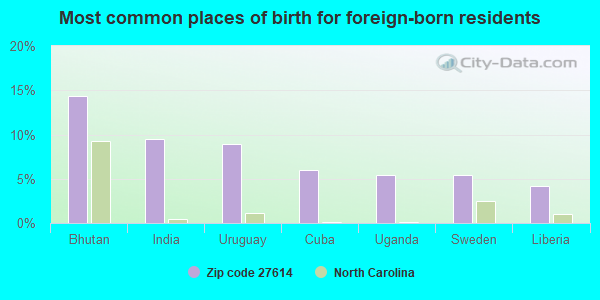
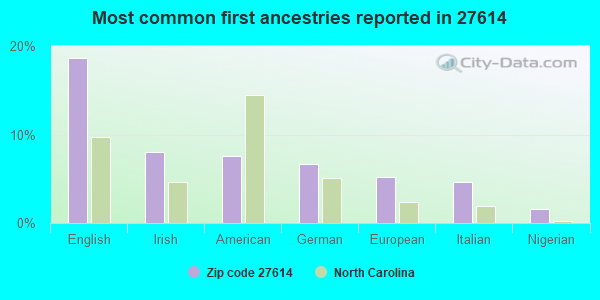
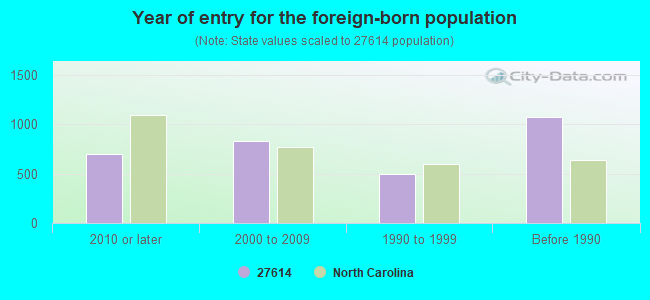


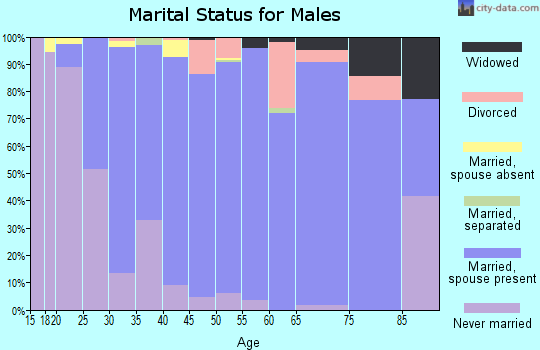
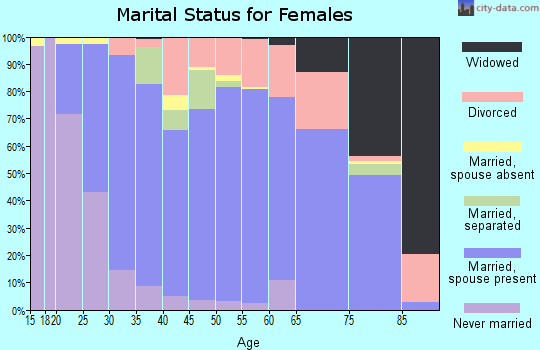
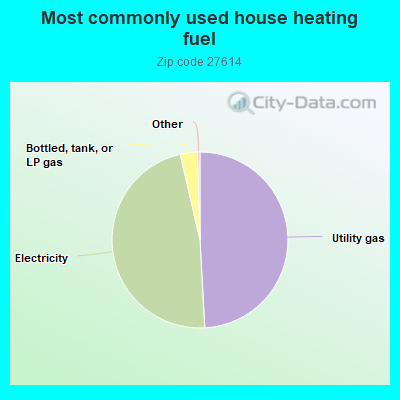
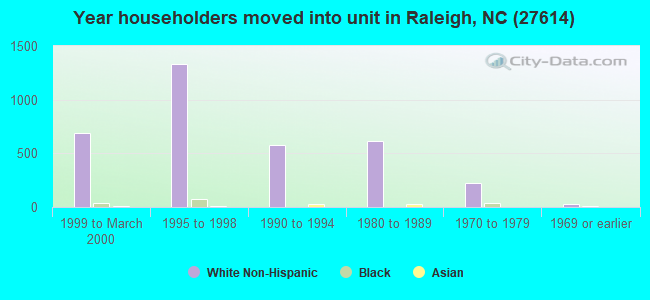
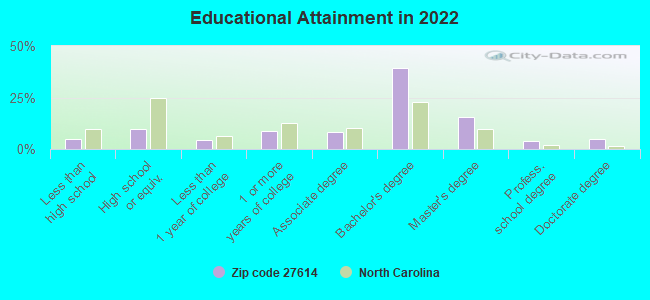
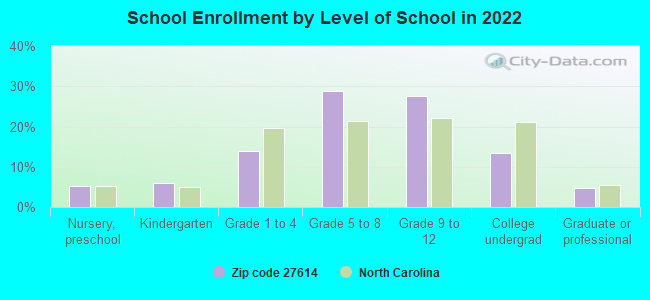
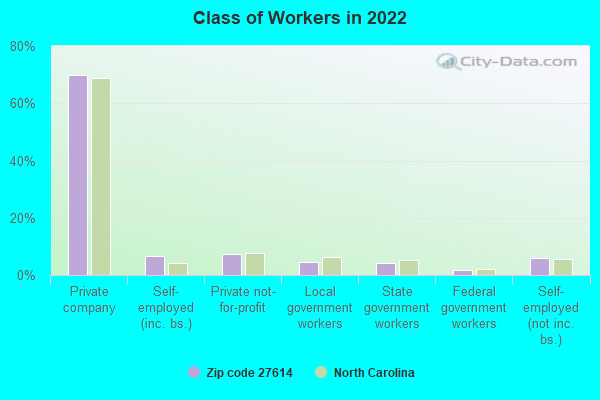
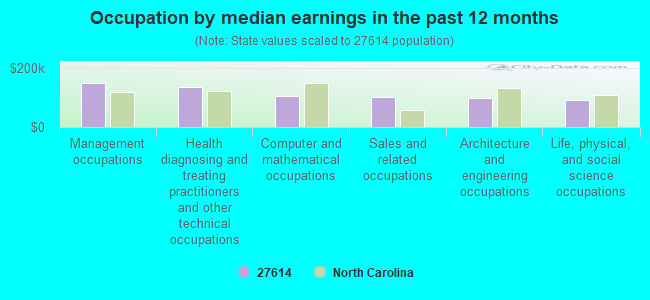
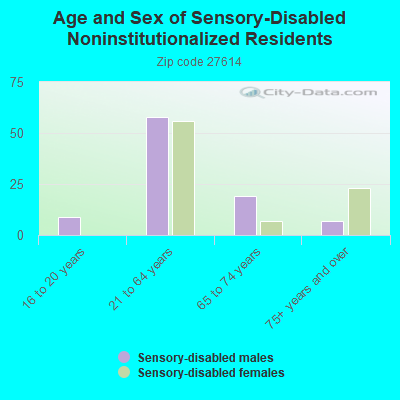
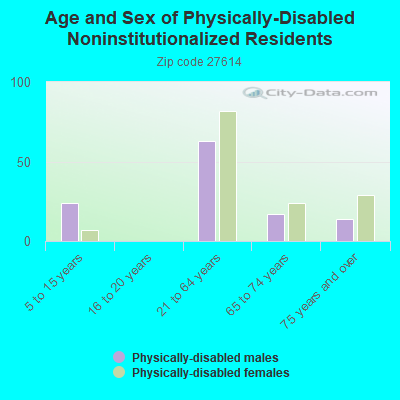
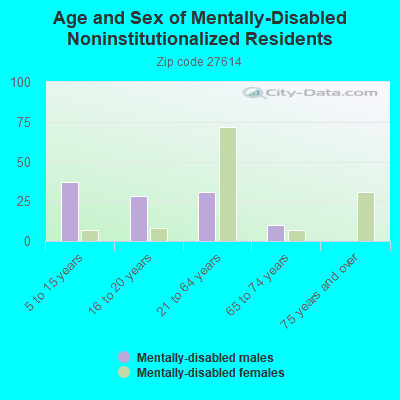
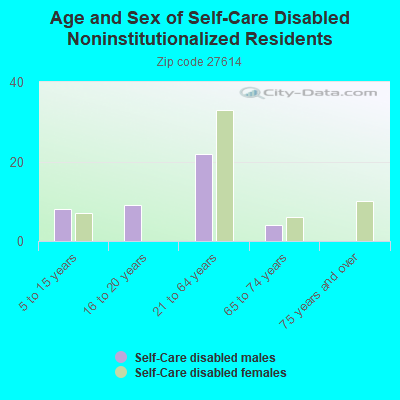
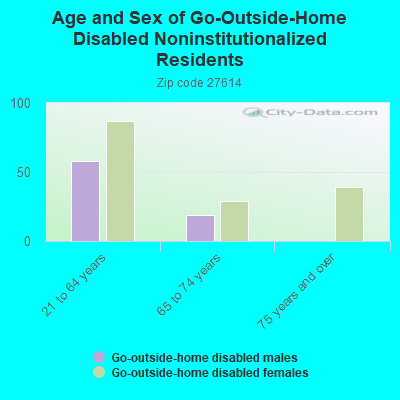
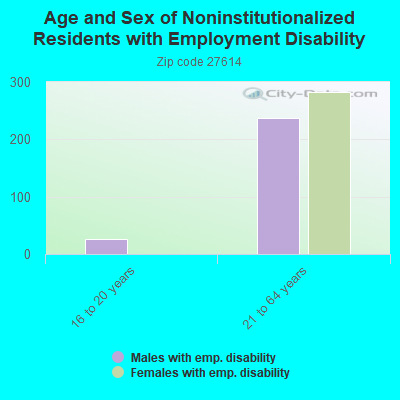
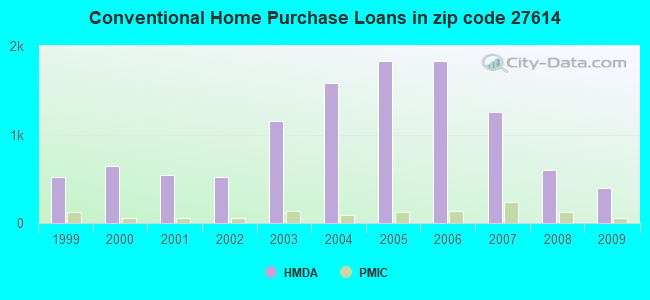
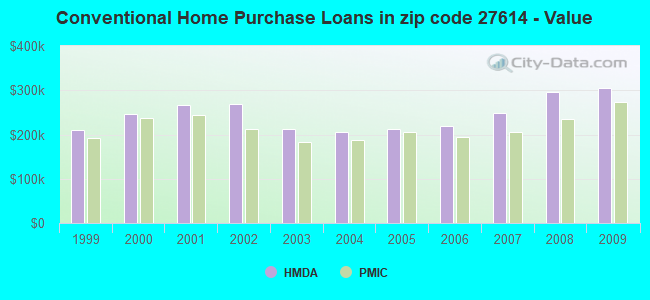
 According to the data from the years 2002 - 2018 the average number of fires per year is 40. The highest number of fires - 76 took place in 2011, and the least - 9 in 2017. The data has a declining trend.
 When looking into fire subcategories, the most incidents belonged to: Outside Fires (46.3%), and Structure Fires (33.5%).