Estimated zip code population in 2022: 58,857 Zip code population in 2010: 42,294 Zip code population in 2000: 21,974
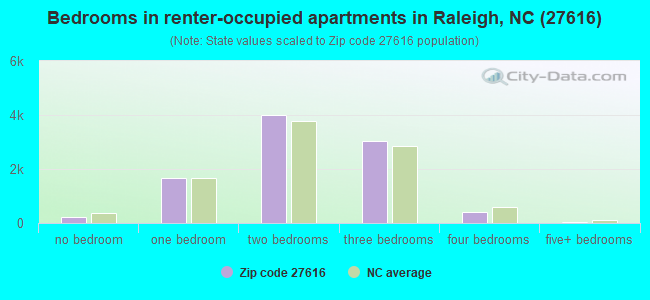
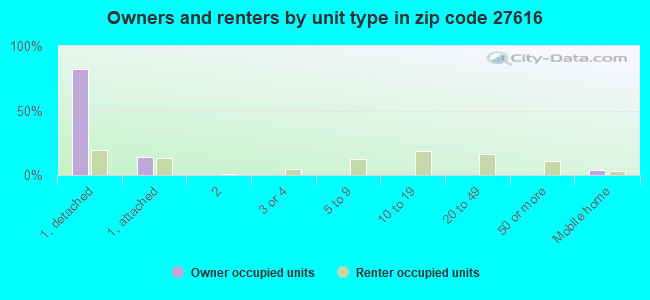
Houses and condos: 23,429 Renter-occupied apartments: 9,352
% of renters here:
42%
State:
33%
March 2022 cost of living index in zip code 27616: 95.1 (less than average, U.S. average is 100)
Land area: 22.2 sq. mi. Water area: 0.1 sq. mi.
Population density: 2,649 people per square mile
(average).
OSM Map
General Map
Google Map
MSN Map
OSM Map
General Map
Google Map
MSN Map
OSM Map
General Map
Google Map
MSN Map
OSM Map
General Map
Google Map
MSN Map
Please wait while loading the map...
Real estate property taxes paid for housing units in 2022:
This zip code:
0.7% ($2,370)
North Carolina:
0.6% ($1,769)
Median real estate property taxes paid for housing units with mortgages in 2022: $2,407 (0.7%) Median real estate property taxes paid for housing units with no mortgage in 2022: $2,122 (0.7%)
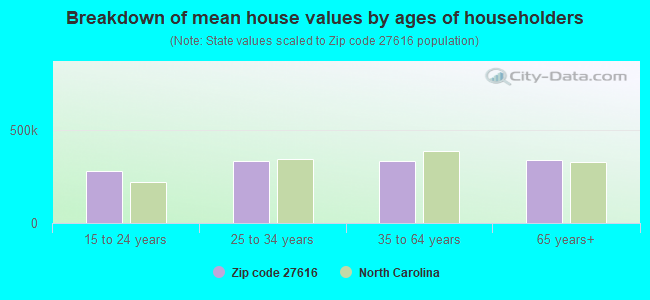
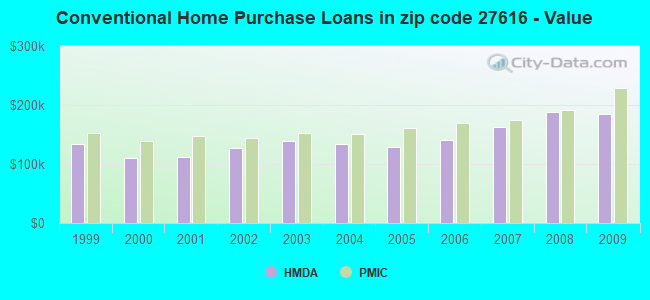
Estimated median house/condo value in 2022: $340,328
27616:
$340,328
North Carolina:
$280,600
According to our research of North Carolina and other state lists, there were 29 registered sex offenders living in 27616 zip code as of April 26, 2024. The ratio of all residents to sex offenders in zip code 27616 is 1,763 to 1. The ratio of registered sex offenders to all residents in this zip code is much lower than the state average.
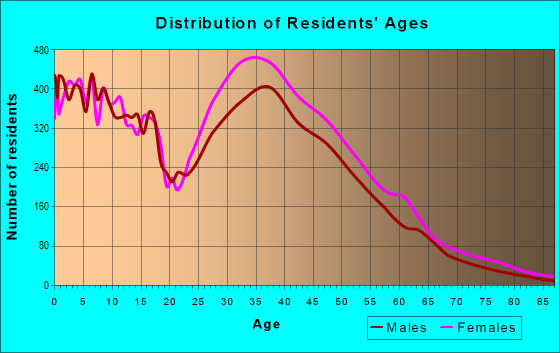
Median resident age:
This zip code:
35.2 years
North Carolina median age:
39.2 years
Average household size:
This zip code:
2.6 people
North Carolina:
2.4 people
Averages for the 2020 tax year for zip code 27616, filed in 2021:
Average Adjusted Gross Income (AGI) in 2020: $56,890 (Individual Income Tax Returns)
Here:
$56,890
State:
$70,020
Salary/wage: $53,117 (reported on 85.6% of returns)
Here:
$53,117
State:
$58,387
(% of AGI for various income ranges: 1178.0% for AGIs below $25k, 3896.7% for AGIs $25k-50k, 7360.9% for AGIs $50k-75k, 11297.0% for AGIs $75k-100k, 20002.2% for AGIs $100k-200k, 73068.3% for AGIs over 200k)
Taxable interest for individuals: $487 (reported on 21.6% of returns)
This zip code:
$487
North Carolina:
$1,479
(% of AGI for various income ranges: 4.9% for AGIs below $25k, 8.0% for AGIs $25k-50k, 13.6% for AGIs $50k-75k, 22.6% for AGIs $75k-100k, 39.6% for AGIs $100k-200k, 288.9% for AGIs over 200k)
Ordinary dividends: $2,207 (reported on 10.8% of returns)
Here:
$2,207
State:
$7,888
(% of AGI for various income ranges: 7.0% for AGIs below $25k, 11.0% for AGIs $25k-50k, 25.2% for AGIs $50k-75k, 43.9% for AGIs $75k-100k, 107.1% for AGIs $100k-200k, 1007.2% for AGIs over 200k)
Net capital gain/loss in AGI: +$6,598 (reported on 10.4% of returns)
Here:
+$6,598
State:
+$23,652
(% of AGI for various income ranges: 4.6% for AGIs below $25k, 13.6% for AGIs $25k-50k, 37.9% for AGIs $50k-75k, 98.9% for AGIs $75k-100k, 248.2% for AGIs $100k-200k, 5760.6% for AGIs over 200k)
Profit/loss from business: +$7,521 (reported on 23.2% of returns)
Here:
+$7,521
State:
+$11,710
(% of AGI for various income ranges: 204.9% for AGIs below $25k, 229.6% for AGIs $25k-50k, 260.9% for AGIs $50k-75k, 220.6% for AGIs $75k-100k, 313.7% for AGIs $100k-200k, 1430.6% for AGIs over 200k)
Taxable individual retirement arrangement distribution: $15,746 (reported on 4.2% of returns)
27616:
$15,746
North Carolina:
$20,247
(% of AGI for various income ranges: 21.3% for AGIs below $25k, 37.5% for AGIs $25k-50k, 91.7% for AGIs $50k-75k, 164.7% for AGIs $75k-100k, 342.5% for AGIs $100k-200k, 1301.7% for AGIs over 200k)
Self-employed (Keogh) retirement plans: $10,400 (reported on 0.1% of returns)
27616:
$10,400
North Carolina:
$26,749
(% of AGI for various income ranges: 15.1% for AGIs $100k-200k)
Total itemized deductions: $25,107 (reported on 8.4% of returns)
Here:
$25,107
State:
$34,549
(% of AGI for various income ranges: 29.2% for AGIs below $25k, 102.1% for AGIs $25k-50k, 346.6% for AGIs $50k-75k, 615.6% for AGIs $75k-100k, 1111.3% for AGIs $100k-200k, 4106.1% for AGIs over 200k)
Charity contributions: $8,524 (reported on 6.7% of returns)
Here:
$8,524
State:
$13,360
(% of AGI for various income ranges: 3.2% for AGIs below $25k, 23.6% for AGIs $25k-50k, 79.1% for AGIs $50k-75k, 141.5% for AGIs $75k-100k, 324.3% for AGIs $100k-200k, 1630.0% for AGIs over 200k)
Taxes paid: $6,789 (reported on 8.4% of returns)
27616:
$6,789
State:
$7,586
(% of AGI for various income ranges: 4.2% for AGIs below $25k, 19.1% for AGIs $25k-50k, 80.3% for AGIs $50k-75k, 181.4% for AGIs $75k-100k, 346.4% for AGIs $100k-200k, 1105.6% for AGIs over 200k)
Earned income credit: $2,357 (reported on 20.5% of returns)
Here:
$2,357
State:
$2,337
(% of AGI for various income ranges: 119.1% for AGIs below $25k, 85.6% for AGIs $25k-50k, 1.1% for AGIs $50k-75k)
Percentage of individuals using paid preparers for their 2020 taxes: 92.5%
Here:
92%
State:
93%
(% for various income ranges: 91.4% for AGIs below $25k, 93.2% for AGIs $25k-50k, 92.4% for AGIs $50k-75k, 92.0% for AGIs $75k-100k, 93.6% for AGIs $100k-200k, 94.9% for AGIs over 200k)
Averages for the 2012 tax year for zip code 27616, filed in 2013:
Average Adjusted Gross Income (AGI) in 2012: $46,289 (Individual Income Tax Returns)
Here:
$46,289
State:
$54,937
Salary/wage: $44,517 (reported on 89.4% of returns)
Here:
$44,517
State:
$46,336
(% of AGI for various income ranges: 79.1% for AGIs below $25k, 88.8% for AGIs $25k-50k, 88.3% for AGIs $50k-75k, 88.8% for AGIs $75k-100k, 86.4% for AGIs $100k-200k, 67.6% for AGIs over 200k)
Taxable interest for individuals: $438 (reported on 26.8% of returns)
This zip code:
$438
North Carolina:
$1,298
(% of AGI for various income ranges: 0.4% for AGIs below $25k, 0.2% for AGIs $25k-50k, 0.3% for AGIs $50k-75k, 0.2% for AGIs $75k-100k, 0.2% for AGIs $100k-200k, 0.4% for AGIs over 200k)
Ordinary dividends: $2,077 (reported on 10.2% of returns)
Here:
$2,077
State:
$6,213
(% of AGI for various income ranges: 0.5% for AGIs below $25k, 0.3% for AGIs $25k-50k, 0.3% for AGIs $50k-75k, 0.3% for AGIs $75k-100k, 0.4% for AGIs $100k-200k, 2.7% for AGIs over 200k)
Net capital gain/loss in AGI: +$1,913 (reported on 7.6% of returns)
Here:
+$1,913
State:
+$12,740
(% of AGI for various income ranges: 0.1% for AGIs $50k-75k, 0.3% for AGIs $75k-100k, 0.5% for AGIs $100k-200k, 2.6% for AGIs over 200k)
Profit/loss from business: +$7,519 (reported on 18.8% of returns)
Here:
+$7,519
State:
+$10,311
(% of AGI for various income ranges: 12.6% for AGIs below $25k, 2.6% for AGIs $25k-50k, 1.9% for AGIs $50k-75k, 1.8% for AGIs $75k-100k, 1.6% for AGIs $100k-200k, 1.1% for AGIs over 200k)
Taxable individual retirement arrangement distribution: $12,731 (reported on 5.0% of returns)
27616:
$12,731
North Carolina:
$15,575
(% of AGI for various income ranges: 1.3% for AGIs below $25k, 1.0% for AGIs $25k-50k, 1.2% for AGIs $50k-75k, 1.4% for AGIs $75k-100k, 2.1% for AGIs $100k-200k)
Self-employment retirement plans: $15,533 (reported on 0.1% of returns)
27616:
$15,533
North Carolina:
$21,078
Total itemized deductions: $21,516 (29% of AGI, reported on 40.1% of returns)
Here:
$21,516
State:
$23,438
Here:
28.7% of AGI
State:
21.5% of AGI
(% of AGI for various income ranges: 8.9% for AGIs below $25k, 14.4% for AGIs $25k-50k, 21.7% for AGIs $50k-75k, 18.1% for AGIs $75k-100k, 25.3% for AGIs $100k-200k, 14.1% for AGIs over 200k)
Charity contributions: $3,280 (reported on 32.2% of returns)
Here:
$3,280
State:
$4,687
(% of AGI for various income ranges: 0.9% for AGIs below $25k, 1.8% for AGIs $25k-50k, 2.4% for AGIs $50k-75k, 2.7% for AGIs $75k-100k, 2.7% for AGIs $100k-200k, 3.0% for AGIs over 200k)
Taxes paid: $6,151 (reported on 39.9% of returns)
27616:
$6,151
State:
$8,823
(% of AGI for various income ranges: 1.6% for AGIs below $25k, 3.5% for AGIs $25k-50k, 5.4% for AGIs $50k-75k, 6.4% for AGIs $75k-100k, 7.3% for AGIs $100k-200k, 7.1% for AGIs over 200k)
Earned income credit: $2,479 (reported on 23.4% of returns)
Here:
$2,479
State:
$2,376
(% of AGI for various income ranges: 9.2% for AGIs below $25k, 1.3% for AGIs $25k-50k)
Percentage of individuals using paid preparers for their 2012 taxes: 45.2%
Here:
45%
State:
53%
(% for various income ranges: 48.2% for AGIs below $25k, 43.7% for AGIs $25k-50k, 44.1% for AGIs $50k-75k, 40.5% for AGIs $75k-100k, 42.7% for AGIs $100k-200k, 66.7% for AGIs over 200k)
Averages for the 2004 tax year for zip code 27616, filed in 2005:
Average Adjusted Gross Income (AGI) in 2004: $43,442 (Individual Income Tax Returns)
Here:
$43,442
State:
$45,376
Salary/wage: $41,367 (reported on 92.0% of returns)
Here:
$41,367
State:
$39,442
(% of AGI for various income ranges: 94.7% for AGIs below $10k, 88.3% for AGIs $10k-25k, 92.3% for AGIs $25k-50k, 91.9% for AGIs $50k-75k, 92.7% for AGIs $75k-100k, 73.1% for AGIs over 100k)
Taxable interest for individuals: $551 (reported on 33.8% of returns)
This zip code:
$551
North Carolina:
$1,515
(% of AGI for various income ranges: 1.3% for AGIs below $10k, 0.6% for AGIs $10k-25k, 0.4% for AGIs $25k-50k, 0.4% for AGIs $50k-75k, 0.2% for AGIs $75k-100k, 0.6% for AGIs over 100k)
Taxable dividends: $977 (reported on 14.5% of returns)
Here:
$977
State:
$4,016
(% of AGI for various income ranges: 1.0% for AGIs below $10k, 0.4% for AGIs $10k-25k, 0.2% for AGIs $25k-50k, 0.2% for AGIs $50k-75k, 0.3% for AGIs $75k-100k, 0.5% for AGIs over 100k)
Net capital gain/loss: +$4,165 (reported on 11.7% of returns)
Here:
+$4,165
State:
+$11,152
(% of AGI for various income ranges: -0.6% for AGIs below $10k, -0.2% for AGIs $10k-25k, 0.1% for AGIs $25k-50k, 0.3% for AGIs $50k-75k, 0.4% for AGIs $75k-100k, 4.3% for AGIs over 100k)
Profit/loss from business: +$5,729 (reported on 16.9% of returns)
Here:
+$5,729
State:
+$9,490
(% of AGI for various income ranges: 7.8% for AGIs below $10k, 4.9% for AGIs $10k-25k, 2.2% for AGIs $25k-50k, 1.1% for AGIs $50k-75k, 1.6% for AGIs $75k-100k, 2.4% for AGIs over 100k)
IRA payment deduction: $2,323 (reported on 1.7% of returns)
27616:
$2,323
North Carolina:
$2,967
(% of AGI for various income ranges: 0.1% for AGIs $10k-25k, 0.1% for AGIs $25k-50k, 0.1% for AGIs $50k-75k, 0.1% for AGIs $75k-100k, 0.1% for AGIs over 100k)
Self-employed pension: $10,500 (reported on 0.3% of returns)
Here:
$10,500
North Carolina:
$14,754
Total itemized deductions: $16,809 (26% of AGI, reported on 48.8% of returns)
Here:
$16,809
State:
$19,464
Here:
25.5% of AGI
State:
22.7% of AGI
(% of AGI for various income ranges: 9.6% for AGIs below $10k, 12.0% for AGIs $10k-25k, 19.7% for AGIs $25k-50k, 21.4% for AGIs $50k-75k, 21.1% for AGIs $75k-100k, 17.1% for AGIs over 100k)
Charity contributions deductions: $2,868 (4% of AGI, reported on 42.2% of returns)
Here:
$2,868
State:
$4,035
Here:
4.2% of AGI
State:
4.5% of AGI
(% of AGI for various income ranges: 0.8% for AGIs below $10k, 1.4% for AGIs $10k-25k, 2.7% for AGIs $25k-50k, 2.9% for AGIs $50k-75k, 3.0% for AGIs $75k-100k, 3.3% for AGIs over 100k)
Total tax: $5,480 (reported on 72.9% of returns)
27616:
$5,480
State:
$7,257
(% of AGI for various income ranges: 3.1% for AGIs below $10k, 3.5% for AGIs $10k-25k, 6.1% for AGIs $25k-50k, 8.2% for AGIs $50k-75k, 9.5% for AGIs $75k-100k, 16.2% for AGIs over 100k)
Earned income credit: $1,935 (reported on 19.1% of returns)
Here:
$1,935
State:
$1,851
Percentage of individuals using paid preparers for their 2004 taxes: 48.9%
Here:
49%
State:
62%
(% for various income ranges: 45.6% for AGIs below $10k, 56.8% for AGIs $10k-25k, 48.7% for AGIs $25k-50k, 44.7% for AGIs $50k-75k, 42.2% for AGIs $75k-100k, 49.8% for AGIs over 100k)
Likely homosexual households (counted as self-reported same-sex unmarried-partner households)
Lesbian couples: 0.0% of all households
Gay men: 0.2% of all households
Household received Food Stamps/SNAP in the past 12 months: 2,081 Household did not receive Food Stamps/SNAP in the past 12 months: 20,324
Women who had a birth in the past 12 months: 401 (375 now married, 34 unmarried) Women who did not have a birth in the past 12 months: 16,817 (7,252 now married, 9,564 unmarried)
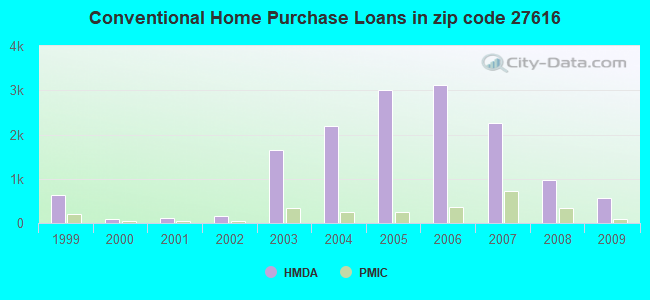
Housing units in zip code 27616 with a mortgage: 10,178 (550 second mortgage, 9 home equity loan, 476 both second mortgage and home equity loan) Houses without a mortgage: 124
Median monthly owner costs for units with a mortgage: $1,528 Median monthly owner costs for units without a mortgage: $513
Residents with income below the poverty level in 2022:
This zip code:
10.0%
Whole state:
12.8%
Residents with income below 50% of the poverty level in 2022:
This zip code:
6.1%
Whole state:
6.8%
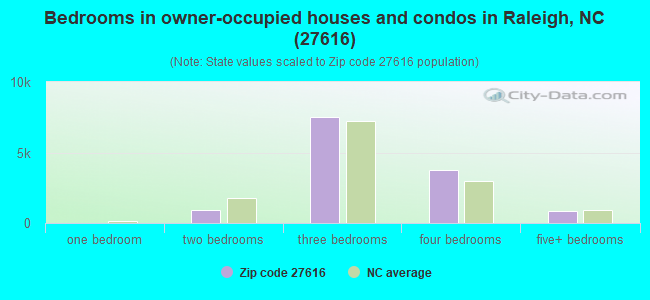
Median number of rooms in houses and condos:
Here:
6.3
State:
6.4
Median number of rooms in apartments:
Here:
4.3
State:
4.4
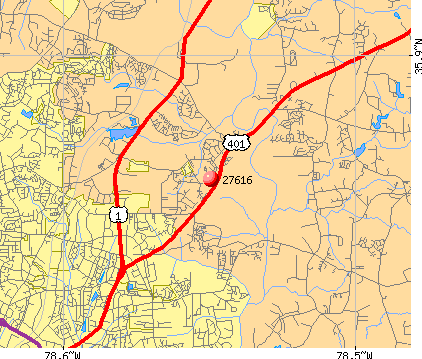
Notable locations in this zip code not listed on our city pages
Notable locations in zip code 27616: Raleigh Fire Station Number 27 (A), Raleigh Fire Station Number 19 (B), Raleigh Christian Life Center (C). Display/hide their locations on the map
Churches in zip code 27616 include: Wake Cross Roads Baptist Church (A), River Oaks Community Church (B), Redeemed Christian Church of God (C), Raleigh North Christian Center (D), New Fire Worship Center (E), Neuse Baptist Church (F), Living Faith Apostolic Ministries (G), Lifepointe Christian Church (H), Higher Call Christian Church (I). Display/hide their locations on the map
8,128 married couples with children.
4,141 single-parent households (323 men, 3,818 women).
71.1% of residents of 27616 zip code speak English at home.
14.6% of residents speak Spanish at home (58% very well, 20% well, 17% not well, 5% not at all).
4.4% of residents speak other Indo-European language at home (57% very well, 27% well, 12% not well, 4% not at all).
5.4% of residents speak Asian or Pacific Island language at home (55% very well, 26% well, 12% not well, 8% not at all).
5.0% of residents speak other language at home (66% very well, 24% well, 5% not well, 5% not at all).
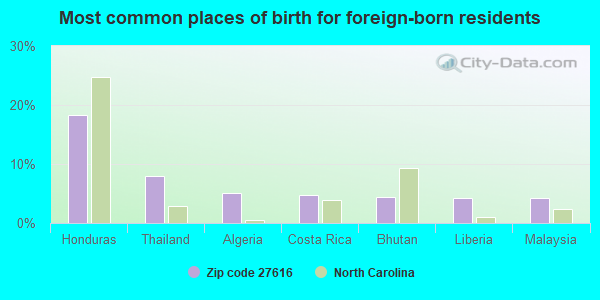
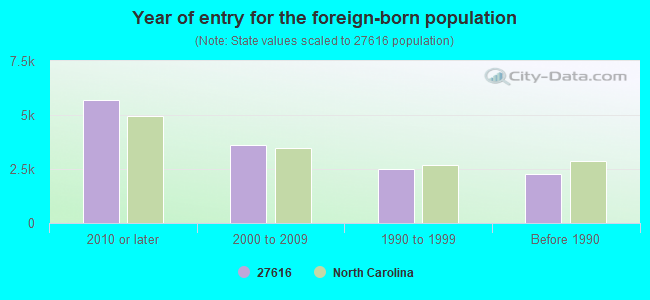
Foreign born population: 12,561 (21.3%) (49.1% of them are naturalized citizens)
Facilities with environmental interests located in this zip code:
CARDINAL HEALTH (8900 CAPITAL BLVD. in RALEIGH, NC)
AIR MINOR (AIRS/AFS) STATE MASTER (North Carolina facility info) - AIR PROGRAM STATE MASTER (North Carolina facility info) - -115DA4YG00V62W84DX0G87K5EM, WASTEWATER FACILITY, -10225, HAZARDOUS WASTE PROGRAM, -8483, National Pollutant Discharge Elimination System NON-MAJOR (Tracking pollutant discharge elimination systems) - permit National Pollutant Discharge Elimination System NON-MAJOR (Tracking pollutant discharge elimination systems) - permit Small Quantity Generators, between 100 kg and 1000 kg of hazardous waste/month (Resource Conservation and Recovery Act (tracking hazardous waste)) Conditionally Exempt Small Quantity Generators, less than 100 kg/month of hazardous waste (Resource Conservation and Recovery Act (tracking hazardous waste)) - notification Business SIC classification: PHARMACEUTICAL PREPARATIONS; BIOLOGICAL PRODUCTS, EXCEPT DIAGNOSTIC SUBSTANCES; SURGICAL AND MEDICAL INSTRUMENTS AND APPARATUS; NONCLASSIFIABLE ESTABLISHMENTS Business NAICS classification: PHARMACEUTICAL PREPARATION MANUFACTURING. Organizations: CARDINAL HEALTH 410 (CONTACT/OPERATOR)
, MALLINCKRODT VETERINARY HOLDIN (CONTACT/OWNER)
Alternative names: CARDINAL HEALTH 410, CARDINAL HEALTH PHARMACEUTICAL TECHNOLOGIES AND SERVICE, CARDINAL HEALTH PHARMACEUTICAL TECHNOLOG, CARDINAL HEALTH TECHNOLGIES, MALLINCKRODT VETERINARY INC, MALLINCKRODT VETERINARY HOLDIN, SCHERING PLOUGH ANIMAL HEALTH
AIR MINOR (AIRS/AFS) STATE MASTER (North Carolina facility info) - AIR PROGRAM, HAZARDOUS WASTE PROGRAM Small Quantity Generators, between 100 kg and 1000 kg of hazardous waste/month (Resource Conservation and Recovery Act (tracking hazardous waste)) - notification Business SIC classification: DRYCLEANING PLANTS, EXCEPT RUG CLEANING; NONCLASSIFIABLE ESTABLISHMENTS Organizations: TOM HILKER/BOB HILKER (CONTACT/OWNER)
CLOSURE MEDICAL CORPORATION (5250 GREEN'S DAIRY RD. in RALEIGH, NC)
HAZARDOUS WASTE BIENNIAL REPORTER (Resource Conservation and Recovery Act (tracking hazardous waste)) Large Quantity Generators, more that 1000 kg of hazardous waste/month (Resource Conservation and Recovery Act (tracking hazardous waste)) - notification Organizations: HIGHWOODS REALTY LIMITED PARTNERSHIP (CONTACT/OWNER)
CLOSURE MEDICAL CORPORATION (5265 CAPITAL BLVD in RALEIGH, NC)
(Resource Conservation and Recovery Act (tracking hazardous waste)) Organizations: TRI-POINT MEDICAL L P (CONTACT/OWNER)
CLOSURE MEDICAL CORPORATION (3212 SPRING FOREST RD in RALEIGH, NC)
(Resource Conservation and Recovery Act (tracking hazardous waste))
CAPITAL FORD TRUCK MAINTENANCE SHOP (4211 CAPITAL BLVD in RALEIGH, NC)
Conditionally Exempt Small Quantity Generators, less than 100 kg/month of hazardous waste (Resource Conservation and Recovery Act (tracking hazardous waste)) Organizations: TIMOTHY MICHAEL (CONTACT/OWNER)
Alternative names: CAPITAL FORD TRUCK SHOP
Housing units lacking complete plumbing facilities: 0.4% Housing units lacking complete kitchen facilities: 0.2%
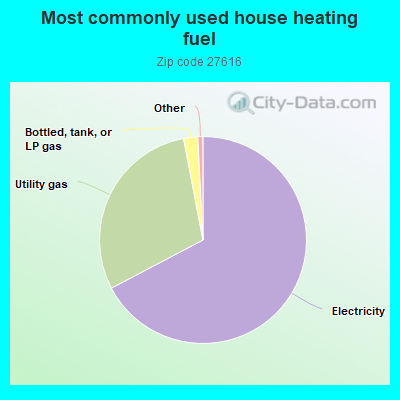
67.3%Electricity
29.7%Utility gas
2.2%Bottled, tank, or LP gas
Place of birth for U.S.-born residents:
This state: 22,705
Northeast: 9,343
Midwest: 3,817
South: 7,879
West: 1,787
34% of the 27616 zip code residents lived in the same house 5 years ago. Out of people who lived in different houses, 54% lived in this county. Out of people who lived in different counties, 50% lived in North Carolina.
85% of the 27616 zip code residents lived in the same house 1 year ago. Out of people who lived in different houses, 53% moved from this county. Out of people who lived in different houses, 19% moved from different county within same state. Out of people who lived in different houses, 20% moved from different state. Out of people who lived in different houses, 3% moved from abroad.
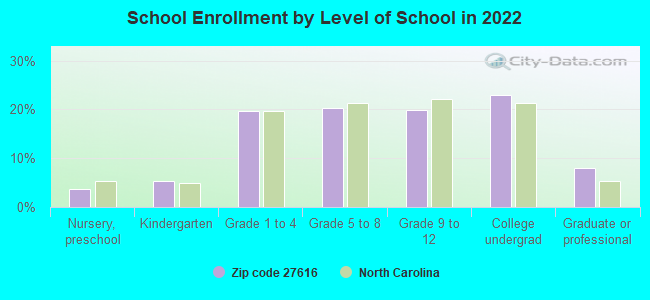
Private vs. public school enrollment:
Students in private schools in grades 1 to 8 (elementary and middle school): 679
Here:
11.6%
North Carolina:
13.8%
Students in private schools in grades 9 to 12 (high school): 333
Here:
11.4%
North Carolina:
11.9%
Students in private undergraduate colleges: 655
Here:
19.6%
North Carolina:
19.3%
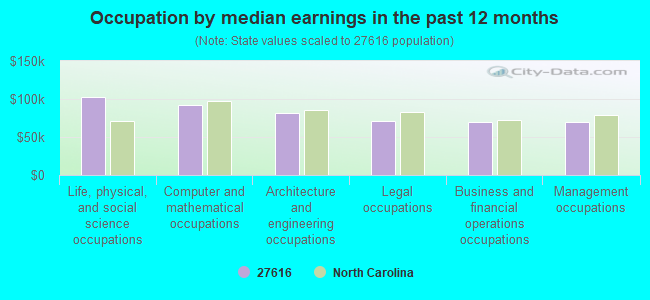
Occupation by median earnings in the past 12 months ($)
102,423Life, physical, and social science occupations
92,497Computer and mathematical occupations
81,844Architecture and engineering occupations
71,336Legal occupations
70,394Business and financial operations occupations
70,010Management occupations
Companies with federal contracts located in this zip code (RALEIGH, NC):
TRIANGLE RENT A CAR, INC (4817 HARGROVE RD) : $4,230,111 in 862 contractsfrom 2002 to 2006
Contracts for Lease or Rental of Equipment -- Ground Effect Vehicles, Motor Vehicles, Trailers, and Cycles, Trucks and Truck Tractors, Wheeled, Lease or Rental of Equipment -- Vehicular Equipment Components, Passenger Motor Vehicles, and moreby Air Force, Department of Defense, Army, Navy, and others Signed by year:2000: $0; 2001: $0; 2002: $343,797; 2003: $756,422; 2004: $641,566; 2005: $1,479,211; 2006: $1,009,115.
Biggest contracts:
$89,475 with Air Force for Lease or Rental of Equipment -- Ground Effect Vehicles, Motor Vehicles, Trailers, and Cycles. Taking place in VA. Signed on 2002-02-24. Completion date: 2002-05-31.
$86,160 with Department of Defense for Lease or Rental of Equipment -- Ground Effect Vehicles, Motor Vehicles, Trailers, and Cycles. Signed on 2005-01-04. Completion date: 2005-04-15.
$81,600 with Army for Trucks and Truck Tractors, Wheeled. Taking place in AL. Signed on 2006-06-07. Completion date: 2006-06-08.
$77,904 with Army for Lease or Rental of Equipment -- Ground Effect Vehicles, Motor Vehicles, Trailers, and Cycles. Taking place in SC. Signed on 2005-11-29. Completion date: 2006-09-30.
J P S COMMUNICATIONS, INC (5800 DEPARTURE DR) : $3,758,832 in 55 contractsfrom 2000 to 2006
Contracts for Miscellaneous Communication Equipment, Radio and Television Communication Equipment, Except Airborne, Communications Security Equipment and Components, Filters and Networks, and moreby Navy, Office of the Secretary, Department of Homeland Security, Army, Federal Bureau of Investigation, and others Signed by year:2000: $351,414; 2001: $231,227; 2002: $516,868; 2003: $1,586,261; 2004: $739,089; 2005: $105,709; 2006: $228,264.
Biggest contracts:
$938,815 with Navy for Miscellaneous Communication Equipment. Taking place in MD. Signed on 2003-09-26. Completion date: 2003-11-25.
$498,398, same as above.Signed on 2004-07-21. Completion date: 2004-09-21.
$228,264 with Office of the Secretary, Department of Homeland Security for Radio and Television Communication Equipment, Except Airborne. Taking place in WA. Signed on 2006-08-30. Completion date: 2007-01-31.
$150,000 with Army for Miscellaneous Communication Equipment. Signed on 2002-06-03. Completion date: 2002-12-02.
TITAN ATLANTIC GROUP, INC (5240 GREENS DAIRY RD; small business) : $530,104 in 12 contractsfrom 2000 to 2003
Contracts for Other Architect and Engineering Services, Architect - Engineer Services (including landscaping, interior layout, and designing) by Army, Navy Signed by year:2000: $99,812; 2001: $94,980; 2002: $308,360; 2003: $26,952; 2004: $0; 2005: $0; 2006: $0.
Biggest contracts:
$132,096 with Army for Other Architect and Engineering Services. Signed on 2002-09-03. Completion date: 2003-03-10.
$94,980 with Army for Architect - Engineer Services (including landscaping, interior layout, and designing). Signed on 2001-03-27. Completion date: 2001-07-12.
$91,214 with Army for Other Architect and Engineering Services. Signed on 2002-04-15. Completion date: 2002-10-02.
$54,999, same as above.Signed on 2002-09-04. Completion date: 2003-04-23.
S&ME INC (3100 SPRING FOREST RD) : $88,143 in 7 contractsfrom 2001 to 2006
Contracts for Architect - Engineer Services (including landscaping, interior layout, and designing), Miscellaneous Items, Maintenance, Repair or Alteration of Real Property -- Hospitals and Infirmaries, , and moreby Navy, National Oceanic and Atmospheric Administration/Under Secretary for Oceans and Atmosphere, Army Signed by year:2000: $0; 2001: $1,140; 2002: -$1,909; 2003: $0; 2004: $1,500; 2005: $86,362; 2006: $1,050.
Biggest contracts:
$87,862 with Navy for Architect - Engineer Services (including landscaping, interior layout, and designing). Signed on 2005-06-09. Completion date: 2006-06-06.
$1,500 with Navy for Miscellaneous Items. Taking place in SC. Signed on 2004-10-28. Completion date: 2005-10-31.
$1,140 with Navy for Maintenance, Repair or Alteration of Real Property -- Hospitals and Infirmaries. Taking place in SC. Signed on 2001-03-08. Completion date: 2001-05-14.
$1,050 with National Oceanic and Atmospheric Administration/Under Secretary for Oceans and Atmosphere for . Taking place in SC. Signed on 2006-09-12. Completion date: 2006-12-30.
TOMPKINS ASSOCIATES (8970 SOUTHALL RD)
$83,890 with Defense Logistics Agency for Other Management Support Services. Taking place in CA. Signed on 2004-05-11. Completion date: 2004-08-31.
TRIANGLE AUTOMATED CONTROLS, I (5915-101 OAK FOREST ROAD; small business)
$32,350 with Navy for Maintenance, Repair or Alteration of Real Property -- Other Industrial Buildings. Signed on 2000-08-23. Completion date: 2000-11-23.
AKM ENTERPRISE INC (4837 HEDGEROW DR; small business)
$11,500 with Army for Maintenance, Repair or Alteration of Real Property -- Heating and Cooling Plants. Signed on 2002-09-27. Completion date: 2002-10-30.
SMITH SHELDON D AND ASSOC INC (8441 GARVEY DR; small business) : $153 in 2 contractsin 2005
$115 with Navy for O-Ring. Signed on 2005-05-11. Completion date: 2005-05-20.
$38, same as above.Signed on 2005-06-13. Completion date: 2005-06-20.
INDELIBLE BLUE, INC (2800-106 SUMNER BLVD; small business) : -$1 in 2 contractsin 2003
$0 with U.S. Army Corps of Engineers - civil program financing only for ADP Software. Signed on 2003-03-21. Completion date: 2000-10-13.
-$1, same as above.Signed on 2003-03-21. Completion date: 2000-10-13.
Top industries in this zip code by the number of employees in 2005:
2002 - 2018 National Fire Incident Reporting System (NFIRS) incidents
Based on the data from the years 2002 - 2018 the average number of fire incidents per year is 30. The highest number of fires - 74 took place in 2005, and the least - 1 in 2007. The data has a decreasing trend.
When looking into fire subcategories, the most reports belonged to: Structure Fires (37.3%), and Outside Fires (36.9%).
Fire incident types reported to NFIRS in Zip Code 27616
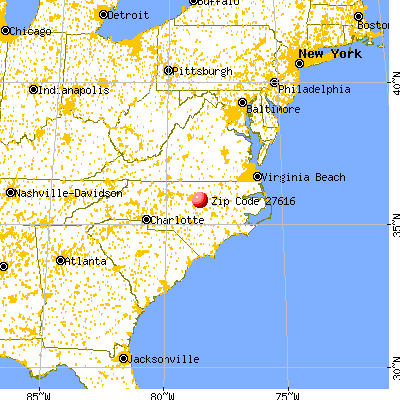


 Nearest zip codes: 27604, 27609, 27571, 27615, 27545, 27614.
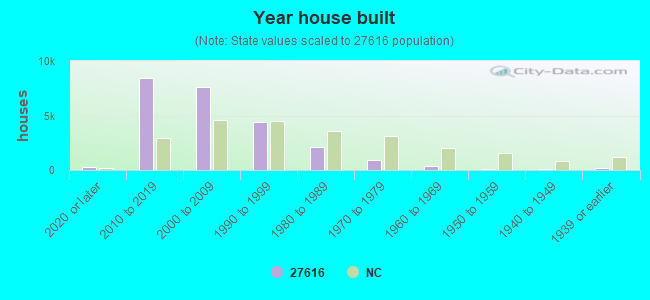


 Based on the data from the years 2002 - 2018 the average number of fire incidents per year is 30. The highest number of fires - 74 took place in 2005, and the least - 1 in 2007. The data has a decreasing trend.
 When looking into fire subcategories, the most reports belonged to: Structure Fires (37.3%), and Outside Fires (36.9%).