Estimated zip code population in 2022: 1,703 Zip code population in 2010: 1,698 Zip code population in 2000: 1,519
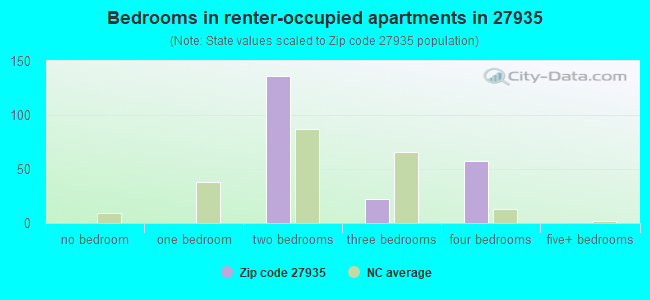
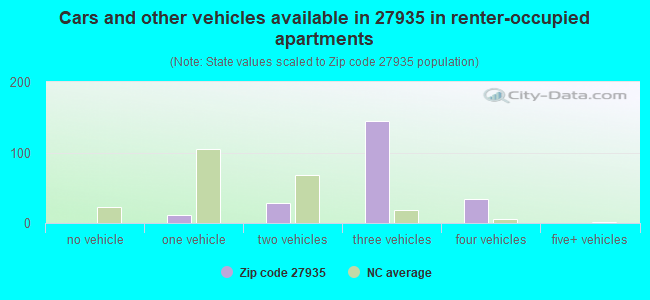
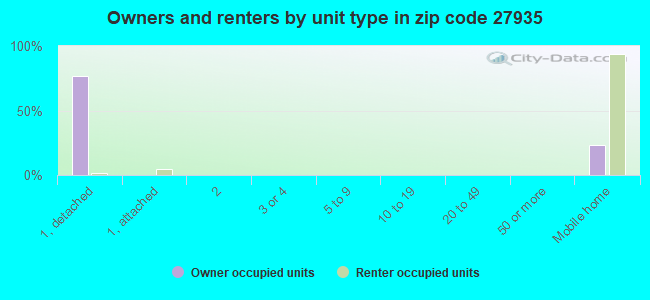
Houses and condos: 706 Renter-occupied apartments: 212
% of renters here:
34%
State:
33%
March 2022 cost of living index in zip code 27935: 79.9 (low, U.S. average is 100)
Land area: 60.0 sq. mi. Water area: 2.0 sq. mi.
Population density: 28 people per square mile
(very low).
OSM Map
General Map
Google Map
MSN Map
OSM Map
General Map
Google Map
MSN Map
OSM Map
General Map
Google Map
MSN Map
OSM Map
General Map
Google Map
MSN Map
Please wait while loading the map...
Real estate property taxes paid for housing units in 2022:
This zip code:
0.7% ($1,282)
North Carolina:
0.6% ($1,769)
Median real estate property taxes paid for housing units with mortgages in 2022: $1,142 (0.6%) Median real estate property taxes paid for housing units with no mortgage in 2022: $1,546 (0.8%)
Business Search- 14 Million verified businesses
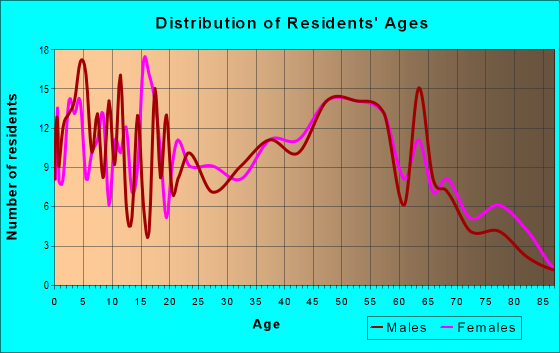
Males: 901
(53.0%)
Females: 801
(47.0%)
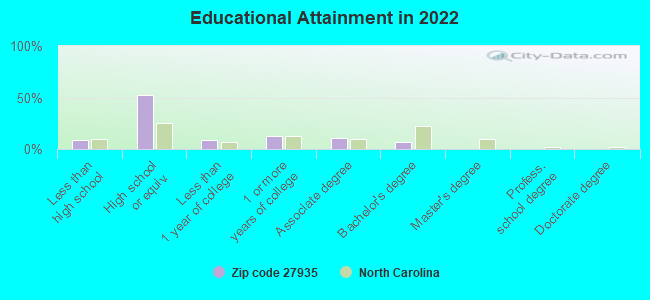
For population 25 years and over in 27935:
High school or higher: 89.3%
Bachelor's degree or higher: 7.3%
Graduate or professional degree: 0.5%
Unemployed: 6.3%
Mean travel time to work (commute): 30.8 minutes
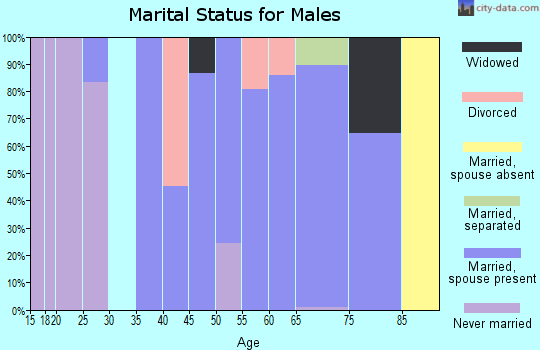
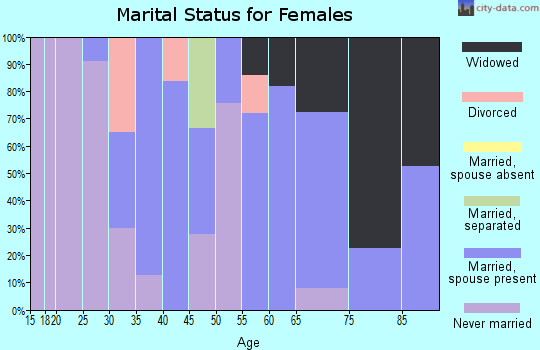
For population 15 years and over in 27935:
Never married: 19.1%
Now married: 61.3%
Separated: 5.0%
Widowed: 4.9%
Divorced: 9.7%
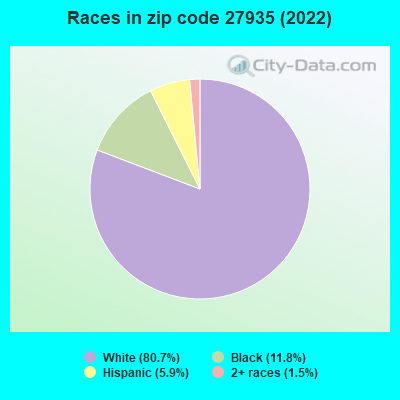
Zip code 27935 compared to state average:
Black race population percentage below state average.
Foreign-born population percentage below state average.
Length of stay since moving in significantly above state average.
House age below state average.
Percentage of population with a bachelor's degree or higher significantly below state average.
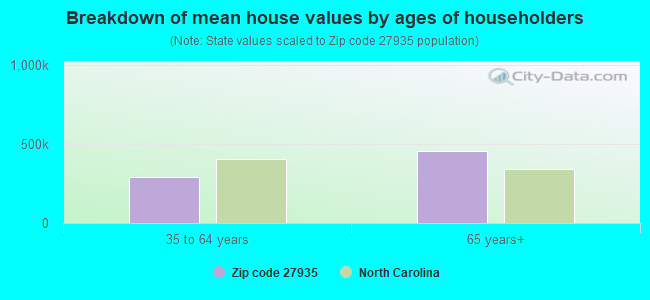
Estimated median house/condo value in 2022: $193,159
27935:
$193,159
North Carolina:
$280,600
According to our research of North Carolina and other state lists, there were 7 registered sex offenders living in 27935 zip code as of April 26, 2024. The ratio of all residents to sex offenders in zip code 27935 is 234 to 1.
Median resident age:
This zip code:
42.0 years
North Carolina median age:
39.2 years
Average household size:
This zip code:
2.8 people
North Carolina:
2.4 people
Averages for the 2020 tax year for zip code 27935, filed in 2021:
Average Adjusted Gross Income (AGI) in 2020: $50,978 (Individual Income Tax Returns)
Here:
$50,978
State:
$70,020
Salary/wage: $48,202 (reported on 80.0% of returns)
Here:
$48,202
State:
$58,387
(% of AGI for various income ranges: 1278.7% for AGIs below $25k, 3792.3% for AGIs $25k-50k, 6941.2% for AGIs $50k-75k, 9465.0% for AGIs $75k-100k, 22195.0% for AGIs $100k-200k)
Taxable interest for individuals: $373 (reported on 33.8% of returns)
This zip code:
$373
North Carolina:
$1,479
(% of AGI for various income ranges: 6.7% for AGIs below $25k, 27.7% for AGIs $25k-50k, 11.2% for AGIs $50k-75k, 10.0% for AGIs $75k-100k, 57.5% for AGIs $100k-200k)
Ordinary dividends: $2,800 (reported on 9.2% of returns)
Here:
$2,800
State:
$7,888
(% of AGI for various income ranges: 82.3% for AGIs $25k-50k, 152.5% for AGIs $100k-200k)
Net capital gain/loss in AGI: +$2,820 (reported on 7.7% of returns)
Here:
+$2,820
State:
+$23,652
(% of AGI for various income ranges: 202.5% for AGIs $50k-75k)
Profit/loss from business: +$2,978 (reported on 13.8% of returns)
Here:
+$2,978
State:
+$11,710
(% of AGI for various income ranges: 99.3% for AGIs below $25k, 40.8% for AGIs $25k-50k, 165.0% for AGIs $75k-100k)
Taxable individual retirement arrangement distribution: $7,700 (reported on 9.2% of returns)
27935:
$7,700
North Carolina:
$20,247
(% of AGI for various income ranges: 193.1% for AGIs $25k-50k, 263.8% for AGIs $50k-75k)
Total itemized deductions: $26,850 (reported on 3.1% of returns)
Here:
$26,850
State:
$34,549
(% of AGI for various income ranges: 413.1% for AGIs $25k-50k)
Taxes paid: $6,600 (reported on 3.1% of returns)
27935:
$6,600
State:
$7,586
(% of AGI for various income ranges: 101.5% for AGIs $25k-50k)
Earned income credit: $2,085 (reported on 20.0% of returns)
Here:
$2,085
State:
$2,337
(% of AGI for various income ranges: 122.7% for AGIs below $25k, 66.9% for AGIs $25k-50k)
Percentage of individuals using paid preparers for their 2020 taxes: 90.8%
Here:
91%
State:
93%
(% for various income ranges: 86.4% for AGIs below $25k, 94.4% for AGIs $25k-50k, 100.0% for AGIs $50k-75k, 83.3% for AGIs $75k-100k, 87.5% for AGIs $100k-200k)
Averages for the 2012 tax year for zip code 27935, filed in 2013:
Average Adjusted Gross Income (AGI) in 2012: $45,570 (Individual Income Tax Returns)
Here:
$45,570
State:
$54,937
Salary/wage: $40,956 (reported on 85.2% of returns)
Here:
$40,956
State:
$46,336
(% of AGI for various income ranges: 78.7% for AGIs below $25k, 71.7% for AGIs $25k-50k, 83.4% for AGIs $50k-75k, 78.8% for AGIs $75k-100k, 71.9% for AGIs $100k-200k)
Taxable interest for individuals: $652 (reported on 34.4% of returns)
This zip code:
$652
North Carolina:
$1,298
(% of AGI for various income ranges: 0.7% for AGIs below $25k, 0.5% for AGIs $25k-50k, 0.3% for AGIs $50k-75k, 0.4% for AGIs $75k-100k, 0.7% for AGIs $100k-200k)
Ordinary dividends: $967 (reported on 9.8% of returns)
Here:
$967
State:
$6,213
Net capital gain/loss in AGI: +$8,386 (reported on 11.5% of returns)
Here:
+$8,386
State:
+$12,740
Profit/loss from business: +$6,462 (reported on 13.1% of returns)
Here:
+$6,462
State:
+$10,311
(% of AGI for various income ranges: 4.9% for AGIs below $25k, 4.4% for AGIs $25k-50k, 1.6% for AGIs $50k-75k)
Taxable individual retirement arrangement distribution: $7,900 (reported on 6.6% of returns)
27935:
$7,900
North Carolina:
$15,575
Total itemized deductions: $17,312 (24% of AGI, reported on 27.9% of returns)
Here:
$17,312
State:
$23,438
Here:
23.6% of AGI
State:
21.5% of AGI
(% of AGI for various income ranges: 12.8% for AGIs $25k-50k, 10.3% for AGIs $50k-75k, 12.4% for AGIs $75k-100k, 11.5% for AGIs $100k-200k)
Charity contributions: $3,992 (reported on 21.3% of returns)
Here:
$3,992
State:
$4,687
(% of AGI for various income ranges: 1.9% for AGIs $25k-50k, 1.5% for AGIs $50k-75k, 2.3% for AGIs $75k-100k, 2.6% for AGIs $100k-200k)
Taxes paid: $5,559 (reported on 27.9% of returns)
27935:
$5,559
State:
$8,823
(% of AGI for various income ranges: 1.9% for AGIs $25k-50k, 3.4% for AGIs $50k-75k, 4.4% for AGIs $75k-100k, 5.4% for AGIs $100k-200k)
Earned income credit: $2,238 (reported on 21.3% of returns)
Here:
$2,238
State:
$2,376
(% of AGI for various income ranges: 8.4% for AGIs below $25k, 1.0% for AGIs $25k-50k)
Percentage of individuals using paid preparers for their 2012 taxes: 60.7%
Here:
61%
State:
53%
(% for various income ranges: 54.5% for AGIs below $25k, 58.8% for AGIs $25k-50k, 63.6% for AGIs $50k-75k, 66.7% for AGIs $75k-100k, 80.0% for AGIs $100k-200k)
Averages for the 2004 tax year for zip code 27935, filed in 2005:
Average Adjusted Gross Income (AGI) in 2004: $36,149 (Individual Income Tax Returns)
Here:
$36,149
State:
$45,376
Salary/wage: $35,895 (reported on 84.3% of returns)
Here:
$35,895
State:
$39,442
(% of AGI for various income ranges: 87.0% for AGIs below $10k, 75.0% for AGIs $10k-25k, 85.6% for AGIs $25k-50k, 83.9% for AGIs $50k-75k, 92.3% for AGIs $75k-100k, 75.1% for AGIs over 100k)
Taxable interest for individuals: $980 (reported on 42.2% of returns)
This zip code:
$980
North Carolina:
$1,515
(% of AGI for various income ranges: 5.1% for AGIs below $10k, 1.8% for AGIs $10k-25k, 1.4% for AGIs $25k-50k, 0.8% for AGIs $50k-75k, 0.1% for AGIs $75k-100k, 1.6% for AGIs over 100k)
Taxable dividends: $491 (reported on 9.5% of returns)
Here:
$491
State:
$4,016
(% of AGI for various income ranges: 0.2% for AGIs $10k-25k, 0.1% for AGIs $25k-50k, 0.2% for AGIs $50k-75k, 0.1% for AGIs $75k-100k)
Net capital gain/loss: +$1,304 (reported on 7.7% of returns)
Here:
+$1,304
State:
+$11,152
(% of AGI for various income ranges: 0.3% for AGIs $10k-25k, 0.3% for AGIs $50k-75k, 0.8% for AGIs $75k-100k)
Profit/loss from business: +$4,169 (reported on 9.8% of returns)
Here:
+$4,169
State:
+$9,490
(% of AGI for various income ranges: -10.9% for AGIs below $10k, 0.8% for AGIs $10k-25k, 3.5% for AGIs $25k-50k, 1.4% for AGIs $50k-75k)
IRA payment deduction: $3,417 (reported on 2.0% of returns)
27935:
$3,417
North Carolina:
$2,967
Total itemized deductions: $15,399 (23% of AGI, reported on 23.9% of returns)
Here:
$15,399
State:
$19,464
Here:
23.4% of AGI
State:
22.7% of AGI
(% of AGI for various income ranges: 3.8% for AGIs $10k-25k, 8.8% for AGIs $25k-50k, 10.2% for AGIs $50k-75k, 15.4% for AGIs $75k-100k, 13.7% for AGIs over 100k)
Charity contributions deductions: $3,239 (5% of AGI, reported on 19.5% of returns)
Here:
$3,239
State:
$4,035
Here:
4.8% of AGI
State:
4.5% of AGI
(% of AGI for various income ranges: 0.6% for AGIs $10k-25k, 1.6% for AGIs $25k-50k, 1.8% for AGIs $50k-75k, 2.9% for AGIs $75k-100k, 1.8% for AGIs over 100k)
Total tax: $3,953 (reported on 74.1% of returns)
27935:
$3,953
State:
$7,257
(% of AGI for various income ranges: 4.2% for AGIs below $10k, 3.2% for AGIs $10k-25k, 6.6% for AGIs $25k-50k, 8.3% for AGIs $50k-75k, 9.5% for AGIs $75k-100k, 15.1% for AGIs over 100k)
Earned income credit: $1,811 (reported on 20.4% of returns)
Here:
$1,811
State:
$1,851
Percentage of individuals using paid preparers for their 2004 taxes: 63.3%
Here:
63%
State:
62%
(% for various income ranges: 51.9% for AGIs below $10k, 64.8% for AGIs $10k-25k, 60.1% for AGIs $25k-50k, 70.5% for AGIs $50k-75k, 68.8% for AGIs $75k-100k, 84.2% for AGIs over 100k)
Household received Food Stamps/SNAP in the past 12 months: 129 Household did not receive Food Stamps/SNAP in the past 12 months: 492
Women who had a birth in the past 12 months: 8 (8 now married, 0 unmarried) Women who did not have a birth in the past 12 months: 446 (211 now married, 235 unmarried)
Housing units in zip code 27935 with a mortgage: 260 (30 second mortgage, 32 both second mortgage and home equity loan) Houses without a mortgage: 9
Median monthly owner costs for units with a mortgage: $1,247 Median monthly owner costs for units without a mortgage: $551
Residents with income below the poverty level in 2022:
This zip code:
1.9%
Whole state:
12.8%
Residents with income below 50% of the poverty level in 2022:
This zip code:
1.5%
Whole state:
6.8%
Median number of rooms in houses and condos:
Here:
6.4
State:
6.4
Median number of rooms in apartments:
Here:
4.2
State:
4.4
Notable locations in this zip code not listed on our city pages
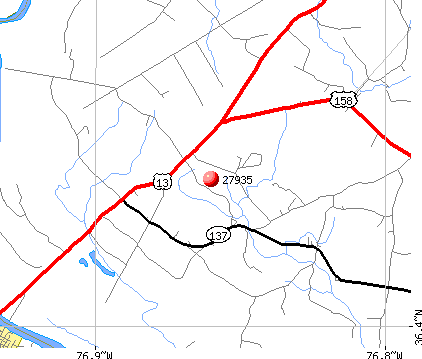
Churches in zip code 27935 include: Ballards Grove Church (A), Cool Spring Church (B), Eure Church (C), Gods Healing Cathedral (D). Display/hide their locations on the map
Reservoirs and swamps: Taylor Millpond (A), Big Branch (B), Bob Jones Swamp (C), Run of Swamp (D), Whiteoak Pocosin (E), Horsepen Pocosin (F). Display/hide their locations on the map
Streams, rivers, and creeks: Cypress Swamp (A), Barnes Creek (B), Spices Creek (C), Beasley Branch (D), Buckhorn Creek (E), Island Creek (F), Jady Branch (G), Sarem Creek (H), Mud Creek (I). Display/hide their locations on the map
Size of family households: 246 2-persons, 90 3-persons, 14 4-persons, 17 5-persons, 62 6-persons
Size of nonfamily households: 156 1-person, 33 2-persons
371 married couples with children.
79 single-parent households (79 women).
91.1% of residents of 27935 zip code speak English at home.
4.3% of residents speak Spanish at home (100% not well).
4.0% of residents speak other Indo-European language at home (100% very well).
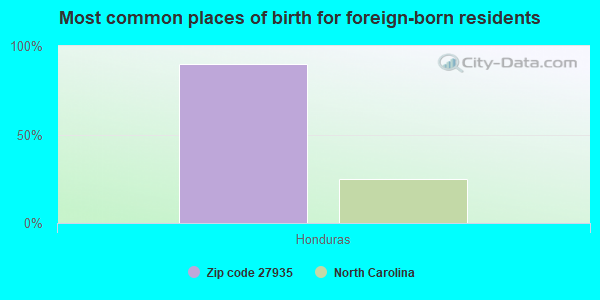
Foreign born population: 75 (4.4%) (0.0% of them are naturalized citizens)
:
4.4%
Whole state:
8.6%
90%Honduras
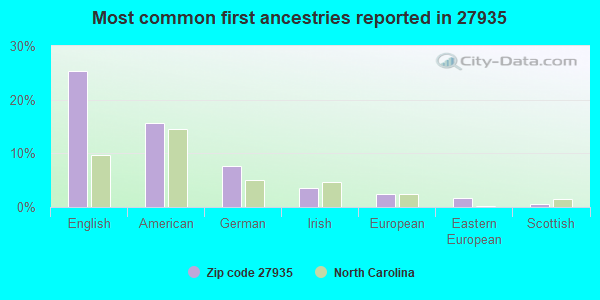
25%English
16%American
8%German
4%Irish
2%European
2%Eastern European
1%Scottish
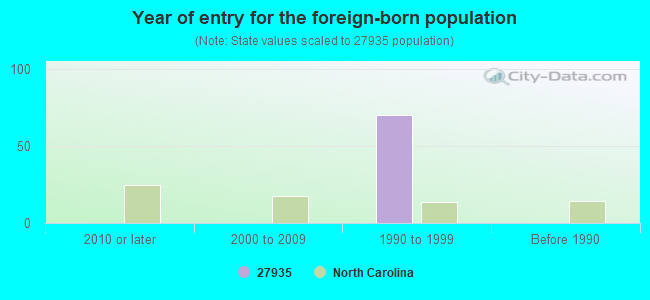
Year of entry for the foreign-born population
02010 or later
02000 to 2009
701990 to 1999
0Before 1990
Housing units lacking complete plumbing facilities: 4.3%
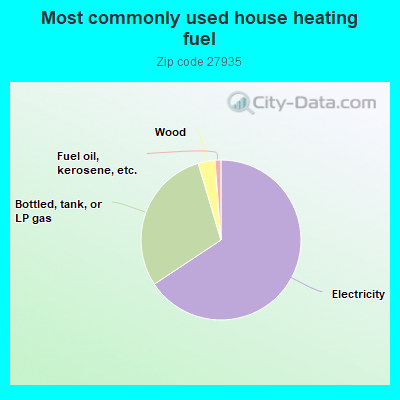
65.9%Electricity
29.8%Bottled, tank, or LP gas
3.4%Wood
1.2%Fuel oil, kerosene, etc.
Population in 1990: 1,346. Population change in the 1990s: +173 (+12.9%).
Place of birth for U.S.-born residents:
This state: 879
South: 729
West: 12
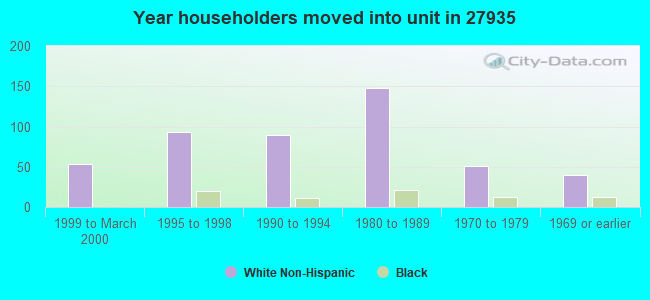
78% of the 27935 zip code residents lived in the same house 5 years ago. Out of people who lived in different houses, 34% lived in this county. Out of people who lived in different counties, 50% lived in North Carolina.
79% of the 27935 zip code residents lived in the same house 1 year ago. Out of people who lived in different houses, 7% moved from this county. Out of people who lived in different houses, 5% moved from different county within same state. Out of people who lived in different houses, 93% moved from different state.
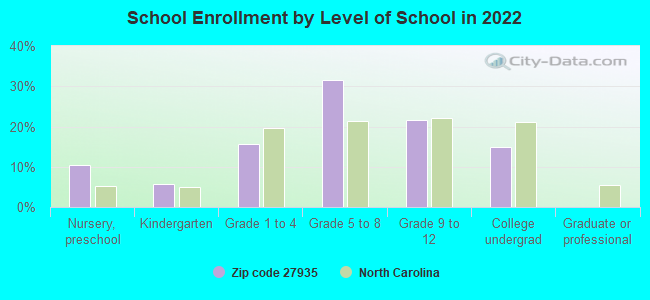
Private vs. public school enrollment:
Students in private schools in grades 1 to 8 (elementary and middle school): 6
Here:
2.6%
North Carolina:
13.8%
Students in private schools in grades 9 to 12 (high school):
Here:
0.0%
North Carolina:
11.9%
Students in private undergraduate colleges:
Here:
0.0%
North Carolina:
19.3%
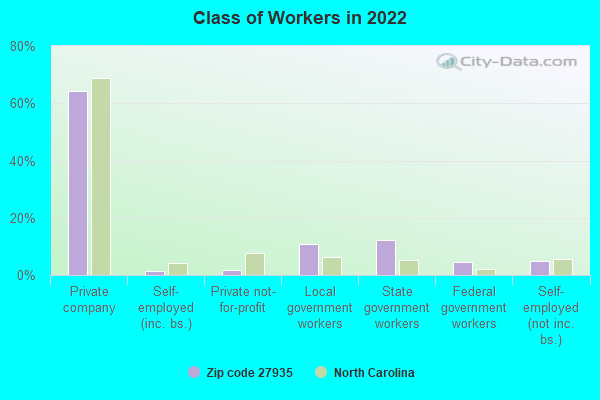
Occupation by median earnings in the past 12 months ($)
70,891Sales and related occupations
53,779Business and financial operations occupations
41,322Office and administrative support occupations
37,226Food preparation and serving related occupations
27,625Construction and extraction occupations
9,493Education, training, and library occupations
Top industries in this zip code by the number of employees in 2005:
Accommodation and Food Services: Full-Service Restaurants (20-49 employees: 1 establishment)
Professional, Scientific, and Technical Services: Veterinary Services (5-9: 1)
Other Services (except Public Administration): Religious Organizations (1-4: 2)
Construction: Plumbing, Heating, and Air-Conditioning Contractors (1-4: 1)
Professional, Scientific, and Technical Services: Administrative Management and General Management Consulting Services (1-4: 1)
Construction: Framing Contractors (1-4: 1)
People in group quarters in 2000:
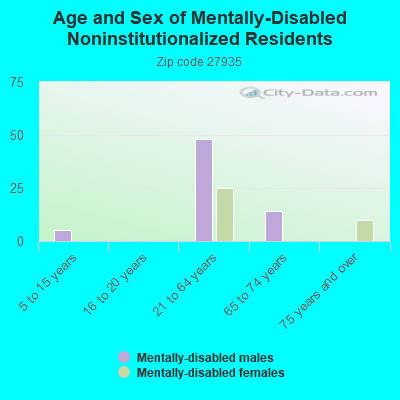
6 people in homes for the mentally retarded
Fatal accident statistics in 2014:
Fatal accident count: 1
Vehicles involved in fatal accidents: 2
Fatal accidents caused by drunken drivers: 0
Fatalities: 1
Persons involved in fatal accidents: 2
Pedestrians involved in fatal accidents: 0
Fatal accident statistics in 2013:
Fatal accident count: 1
Vehicles involved in fatal accidents: 1
Fatal accidents caused by drunken drivers: 0
Fatalities: 1
Persons involved in fatal accidents: 1
Pedestrians involved in fatal accidents: 0
2003 - 2018 National Fire Incident Reporting System (NFIRS) incidents
Based on the data from the years 2003 - 2018 the average number of fire incidents per year is 10. The highest number of fire incidents - 30 took place in 2007, and the least - 1 in 2016. The data has a declining trend.
When looking into fire subcategories, the most incidents belonged to: Structure Fires (47.9%), and Outside Fires (34.4%).
Fire incident types reported to NFIRS in Zip Code 27935
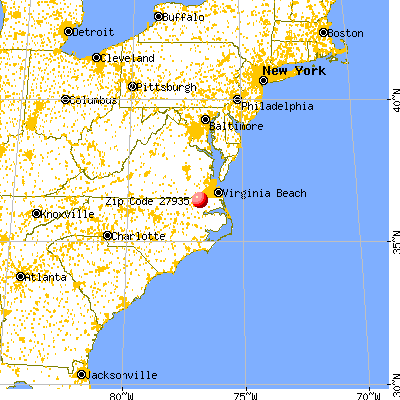


 Nearest zip codes: 27986, 27937, 27922, 27938, 27818, 27942.
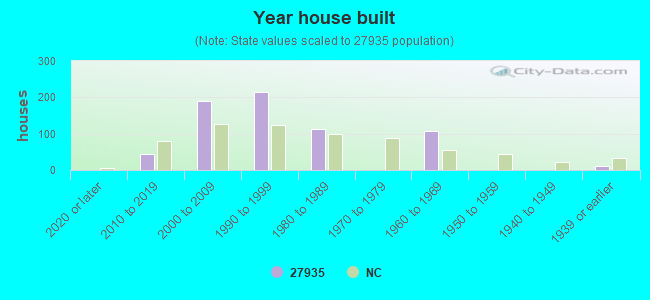


 Based on the data from the years 2003 - 2018 the average number of fire incidents per year is 10. The highest number of fire incidents - 30 took place in 2007, and the least - 1 in 2016. The data has a declining trend.
 When looking into fire subcategories, the most incidents belonged to: Structure Fires (47.9%), and Outside Fires (34.4%).