Estimated zip code population in 2022: 3,116 Zip code population in 2010: 4,333 Zip code population in 2000: 3,080
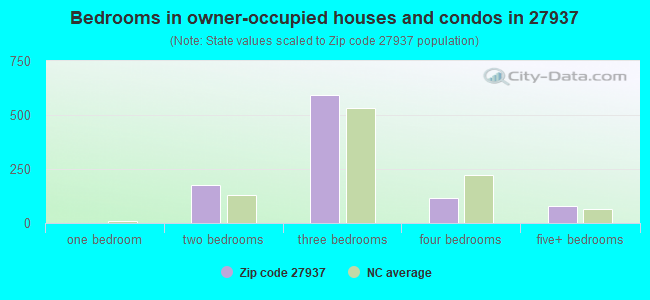
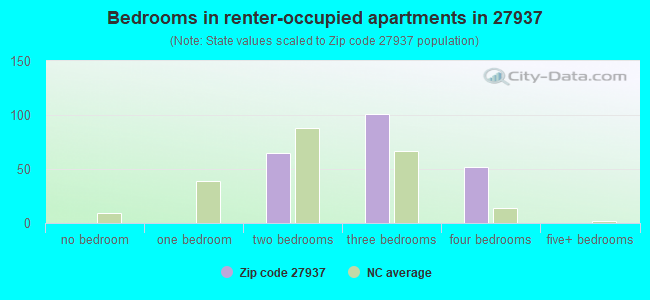
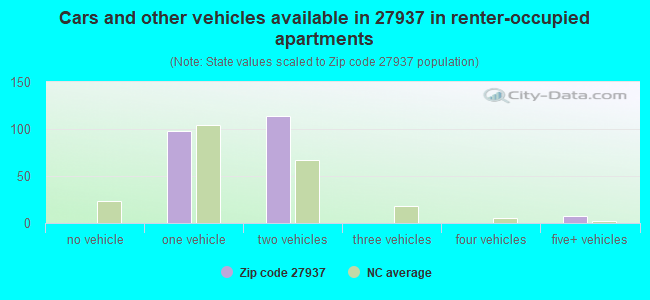
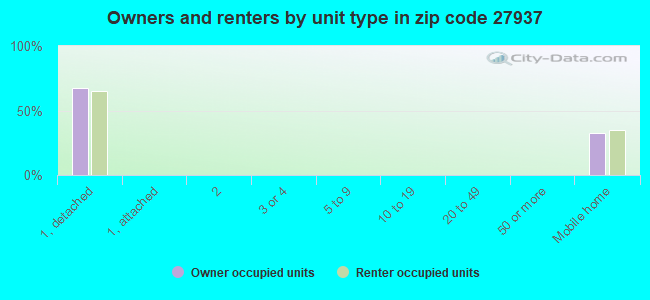
Houses and condos: 1,259 Renter-occupied apartments: 216
% of renters here:
18%
State:
33%
March 2022 cost of living index in zip code 27937: 80.9 (low, U.S. average is 100)
Land area: 84.4 sq. mi. Water area: 0.6 sq. mi.
Population density: 37 people per square mile
(very low).
OSM Map
General Map
Google Map
MSN Map
OSM Map
General Map
Google Map
MSN Map
OSM Map
General Map
Google Map
MSN Map
OSM Map
General Map
Google Map
MSN Map
Please wait while loading the map...
Real estate property taxes paid for housing units in 2022:
This zip code:
0.7% ($1,194)
North Carolina:
0.6% ($1,769)
Median real estate property taxes paid for housing units with mortgages in 2022: $1,335 (0.8%) Median real estate property taxes paid for housing units with no mortgage in 2022: $712 (0.6%)
Business Search- 14 Million verified businesses
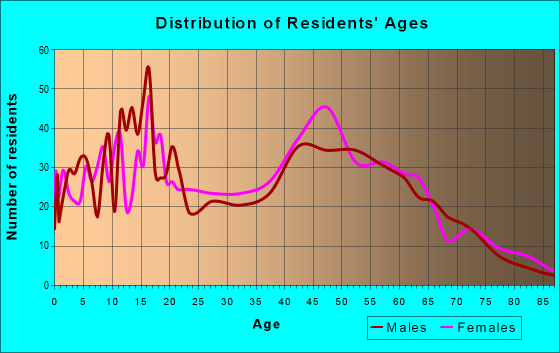
Males: 1,614
(51.8%)
Females: 1,501
(48.2%)
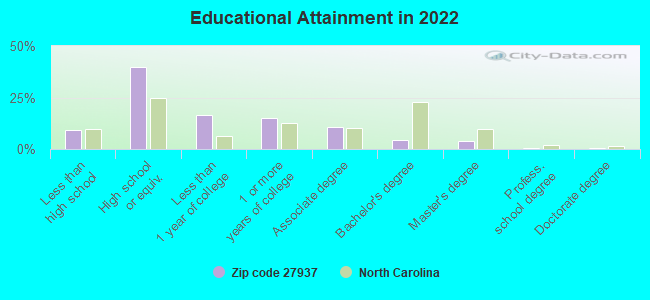
For population 25 years and over in 27937:
High school or higher: 89.8%
Bachelor's degree or higher: 8.8%
Graduate or professional degree: 4.4%
Unemployed: 11.4%
Mean travel time to work (commute): 39.2 minutes
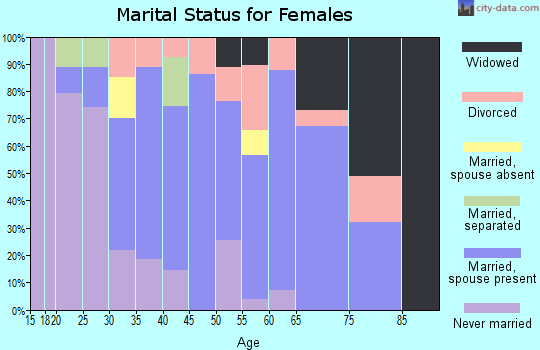
For population 15 years and over in 27937:
Never married: 30.8%
Now married: 50.2%
Separated: 3.0%
Widowed: 7.1%
Divorced: 8.8%
Zip code 27937 compared to state average:
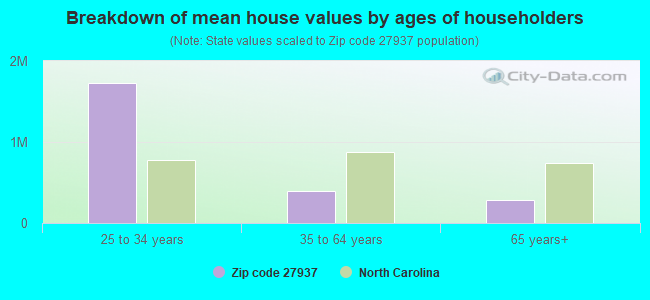
Median house value below state average.
Unemployed percentage significantly above state average.
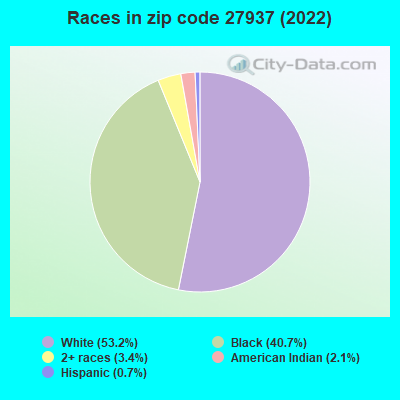
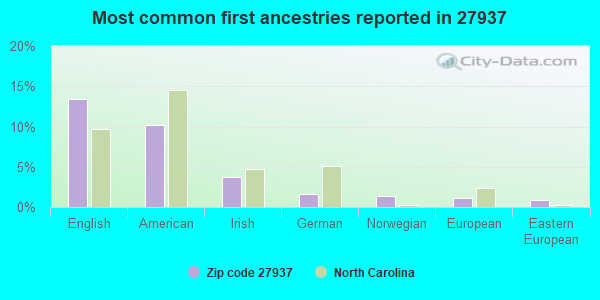
Black race population percentage above state average.
Hispanic race population percentage significantly below state average.
Median age above state average.
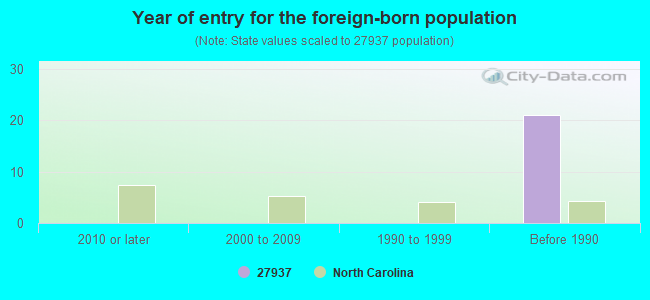
Foreign-born population percentage significantly below state average.
Renting percentage below state average.
Length of stay since moving in significantly above state average.
Number of college students below state average.
Percentage of population with a bachelor's degree or higher significantly below state average.
Averages for the 2020 tax year for zip code 27937, filed in 2021:
Average Adjusted Gross Income (AGI) in 2020: $51,610 (Individual Income Tax Returns)
Here:
$51,610
State:
$70,020
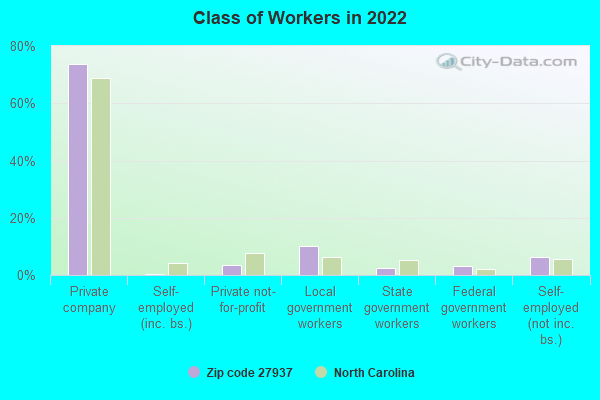
Salary/wage: $47,391 (reported on 83.6% of returns)
Here:
$47,391
State:
$58,387
(% of AGI for various income ranges: 1164.3% for AGIs below $25k, 3634.4% for AGIs $25k-50k, 6767.7% for AGIs $50k-75k, 9551.8% for AGIs $75k-100k, 20027.3% for AGIs $100k-200k)
Taxable interest for individuals: $574 (reported on 20.6% of returns)
This zip code:
$574
North Carolina:
$1,479
(% of AGI for various income ranges: 12.1% for AGIs below $25k, 11.4% for AGIs $25k-50k, 14.1% for AGIs $50k-75k, 15.5% for AGIs $75k-100k, 50.0% for AGIs $100k-200k)
Ordinary dividends: $1,469 (reported on 7.9% of returns)
Here:
$1,469
State:
$7,888
(% of AGI for various income ranges: 10.8% for AGIs $25k-50k, 26.8% for AGIs $50k-75k, 84.5% for AGIs $100k-200k)
Net capital gain/loss in AGI: +$3,783 (reported on 7.3% of returns)
Here:
+$3,783
State:
+$23,652
(% of AGI for various income ranges: 7.7% for AGIs $50k-75k, 104.5% for AGIs $75k-100k, 299.1% for AGIs $100k-200k)
Profit/loss from business: +$4,514 (reported on 12.7% of returns)
Here:
+$4,514
State:
+$11,710
(% of AGI for various income ranges: 63.3% for AGIs below $25k, 95.6% for AGIs $25k-50k, 15.5% for AGIs $50k-75k, 74.5% for AGIs $75k-100k, 201.8% for AGIs $100k-200k)
Taxable individual retirement arrangement distribution: $11,989 (reported on 5.5% of returns)
27937:
$11,989
North Carolina:
$20,247
(% of AGI for various income ranges: 23.1% for AGIs below $25k, 55.8% for AGIs $25k-50k, 118.2% for AGIs $50k-75k, 473.6% for AGIs $100k-200k)
Total itemized deductions: $29,900 (reported on 4.8% of returns)
Here:
$29,900
State:
$34,549
(% of AGI for various income ranges: 168.1% for AGIs $25k-50k, 473.6% for AGIs $50k-75k, 677.3% for AGIs $100k-200k)
Charity contributions: $8,633 (reported on 3.6% of returns)
Here:
$8,633
State:
$13,360
(% of AGI for various income ranges: 28.6% for AGIs below $25k, 75.5% for AGIs $50k-75k, 210.9% for AGIs $100k-200k)
Taxes paid: $6,029 (reported on 4.2% of returns)
27937:
$6,029
State:
$7,586
(% of AGI for various income ranges: 23.1% for AGIs $25k-50k, 69.1% for AGIs $50k-75k, 170.0% for AGIs $100k-200k)
Earned income credit: $2,300 (reported on 21.2% of returns)
Here:
$2,300
State:
$2,337
(% of AGI for various income ranges: 114.5% for AGIs below $25k, 90.0% for AGIs $25k-50k)
Percentage of individuals using paid preparers for their 2020 taxes: 93.3%
Here:
93%
State:
93%
(% for various income ranges: 90.7% for AGIs below $25k, 95.6% for AGIs $25k-50k, 93.3% for AGIs $50k-75k, 93.3% for AGIs $75k-100k, 95.2% for AGIs $100k-200k)
Averages for the 2012 tax year for zip code 27937, filed in 2013:
Average Adjusted Gross Income (AGI) in 2012: $44,868 (Individual Income Tax Returns)
Here:
$44,868
State:
$54,937
Salary/wage: $39,952 (reported on 89.4% of returns)
Here:
$39,952
State:
$46,336
(% of AGI for various income ranges: 76.5% for AGIs below $25k, 80.7% for AGIs $25k-50k, 80.9% for AGIs $50k-75k, 85.2% for AGIs $75k-100k, 73.9% for AGIs $100k-200k)
Taxable interest for individuals: $603 (reported on 22.5% of returns)
This zip code:
$603
North Carolina:
$1,298
(% of AGI for various income ranges: 0.4% for AGIs below $25k, 0.3% for AGIs $25k-50k, 0.3% for AGIs $50k-75k, 0.4% for AGIs $100k-200k)
Ordinary dividends: $1,200 (reported on 7.9% of returns)
Here:
$1,200
State:
$6,213
(% of AGI for various income ranges: 0.1% for AGIs $25k-50k, 0.1% for AGIs $50k-75k, 0.3% for AGIs $75k-100k, 0.4% for AGIs $100k-200k)
Net capital gain/loss in AGI: +$1,317 (reported on 4.0% of returns)
Here:
+$1,317
State:
+$12,740
Profit/loss from business: +$7,828 (reported on 11.9% of returns)
Here:
+$7,828
State:
+$10,311
(% of AGI for various income ranges: 6.2% for AGIs below $25k, 3.0% for AGIs $25k-50k, 1.6% for AGIs $50k-75k, 1.6% for AGIs $75k-100k)
Taxable individual retirement arrangement distribution: $8,362 (reported on 5.3% of returns)
27937:
$8,362
North Carolina:
$15,575
Total itemized deductions: $17,802 (25% of AGI, reported on 35.1% of returns)
Here:
$17,802
State:
$23,438
Here:
24.8% of AGI
State:
21.5% of AGI
(% of AGI for various income ranges: 8.6% for AGIs below $25k, 10.7% for AGIs $25k-50k, 17.2% for AGIs $50k-75k, 15.3% for AGIs $75k-100k, 15.7% for AGIs $100k-200k)
Charity contributions: $3,897 (reported on 25.8% of returns)
Here:
$3,897
State:
$4,687
(% of AGI for various income ranges: 0.7% for AGIs below $25k, 1.9% for AGIs $25k-50k, 2.8% for AGIs $50k-75k, 2.4% for AGIs $75k-100k, 2.7% for AGIs $100k-200k)
Taxes paid: $5,191 (reported on 35.1% of returns)
27937:
$5,191
State:
$8,823
(% of AGI for various income ranges: 1.3% for AGIs below $25k, 2.4% for AGIs $25k-50k, 4.3% for AGIs $50k-75k, 5.0% for AGIs $75k-100k, 6.1% for AGIs $100k-200k)
Earned income credit: $2,378 (reported on 23.8% of returns)
Here:
$2,378
State:
$2,376
(% of AGI for various income ranges: 8.5% for AGIs below $25k, 1.4% for AGIs $25k-50k)
Percentage of individuals using paid preparers for their 2012 taxes: 51.0%
Here:
51%
State:
53%
(% for various income ranges: 45.5% for AGIs below $25k, 50.0% for AGIs $25k-50k, 54.2% for AGIs $50k-75k, 60.0% for AGIs $75k-100k, 63.6% for AGIs $100k-200k)
Averages for the 2004 tax year for zip code 27937, filed in 2005:
Average Adjusted Gross Income (AGI) in 2004: $34,709 (Individual Income Tax Returns)
Here:
$34,709
State:
$45,376
Salary/wage: $33,385 (reported on 88.3% of returns)
Here:
$33,385
State:
$39,442
(% of AGI for various income ranges: 158.0% for AGIs below $10k, 79.8% for AGIs $10k-25k, 87.7% for AGIs $25k-50k, 86.4% for AGIs $50k-75k, 84.2% for AGIs $75k-100k, 70.3% for AGIs over 100k)
Taxable interest for individuals: $917 (reported on 30.4% of returns)
This zip code:
$917
North Carolina:
$1,515
(% of AGI for various income ranges: 5.6% for AGIs below $10k, 0.8% for AGIs $10k-25k, 0.7% for AGIs $25k-50k, 0.7% for AGIs $50k-75k, 0.5% for AGIs $75k-100k, 1.1% for AGIs over 100k)
Taxable dividends: $552 (reported on 8.6% of returns)
Here:
$552
State:
$4,016
(% of AGI for various income ranges: 0.1% for AGIs $10k-25k, 0.1% for AGIs $25k-50k, 0.1% for AGIs $50k-75k, 0.3% for AGIs $75k-100k, 0.2% for AGIs over 100k)
Net capital gain/loss: +$4,509 (reported on 8.3% of returns)
Here:
+$4,509
State:
+$11,152
(% of AGI for various income ranges: 0.0% for AGIs $10k-25k, 0.6% for AGIs $25k-50k, 1.6% for AGIs $50k-75k, 2.9% for AGIs $75k-100k)
Profit/loss from business: +$2,418 (reported on 12.6% of returns)
Here:
+$2,418
State:
+$9,490
(% of AGI for various income ranges: -8.6% for AGIs below $10k, 4.9% for AGIs $10k-25k, 1.5% for AGIs $25k-50k, -0.1% for AGIs $50k-75k, -0.5% for AGIs over 100k)
IRA payment deduction: $1,600 (reported on 1.5% of returns)
27937:
$1,600
North Carolina:
$2,967
Total itemized deductions: $15,329 (26% of AGI, reported on 30.1% of returns)
Here:
$15,329
State:
$19,464
Here:
25.8% of AGI
State:
22.7% of AGI
(% of AGI for various income ranges: 7.4% for AGIs $10k-25k, 13.1% for AGIs $25k-50k, 14.8% for AGIs $50k-75k, 16.1% for AGIs $75k-100k, 15.4% for AGIs over 100k)
Charity contributions deductions: $3,258 (5% of AGI, reported on 26.1% of returns)
Here:
$3,258
State:
$4,035
Here:
5.3% of AGI
State:
4.5% of AGI
(% of AGI for various income ranges: 1.0% for AGIs $10k-25k, 2.4% for AGIs $25k-50k, 2.6% for AGIs $50k-75k, 3.4% for AGIs $75k-100k, 3.1% for AGIs over 100k)
Total tax: $3,750 (reported on 68.8% of returns)
27937:
$3,750
State:
$7,257
(% of AGI for various income ranges: 3.3% for AGIs below $10k, 3.5% for AGIs $10k-25k, 5.6% for AGIs $25k-50k, 7.8% for AGIs $50k-75k, 9.8% for AGIs $75k-100k, 13.9% for AGIs over 100k)
Earned income credit: $1,871 (reported on 24.7% of returns)
Here:
$1,871
State:
$1,851
Percentage of individuals using paid preparers for their 2004 taxes: 59.6%
Here:
60%
State:
62%
(% for various income ranges: 48.8% for AGIs below $10k, 63.5% for AGIs $10k-25k, 55.0% for AGIs $25k-50k, 62.9% for AGIs $50k-75k, 80.8% for AGIs $75k-100k, 76.9% for AGIs over 100k)
Household received Food Stamps/SNAP in the past 12 months: 244 Household did not receive Food Stamps/SNAP in the past 12 months: 942
Women who had a birth in the past 12 months: 34 (35 now married, 0 unmarried) Women who did not have a birth in the past 12 months: 585 (284 now married, 301 unmarried)
Housing units in zip code 27937 with a mortgage: 607 (51 second mortgage, 53 both second mortgage and home equity loan) Median monthly owner costs for units with a mortgage: $1,322 Median monthly owner costs for units without a mortgage: $504
Residents with income below the poverty level in 2022:
This zip code:
13.0%
Whole state:
12.8%
Residents with income below 50% of the poverty level in 2022:
This zip code:
5.9%
Whole state:
6.8%
Median number of rooms in houses and condos:
Here:
6.4
State:
6.4
Median number of rooms in apartments:
Here:
6.7
State:
4.4
Notable locations in this zip code not listed on our city pages
Churches in zip code 27937 include: Ebenezer Gospel Church (A), Kittrells Church (B), Sycamore Hill Church (C), New Pine Grove Church (D), Middle Swamp Church (E), New Hope Church (F), Piney Wood Chapel (G), Sarem Grove Church (H), Red Oak Grove Church (I). Display/hide their locations on the map
Facilities with environmental interests located in this zip code:
BUCKLAND ELEMENTARY (448 NC 37 NORTH in GATES, NC)
(National Center for Education Statistics) - STATE ID-304 Organizations: GATES COUNTY SCHOOLS (SCHOOL DISTRICT)
CARROLL`S GARAGE INC (HWY 37 N in GATES, NC)
(Resource Conservation and Recovery Act (tracking hazardous waste)) Organizations: R.J.CARROLL & J.C.CARROLL (CONTACT/OWNER)
Alternative names: CARROLL'S GARAGE INC
Housing units lacking complete plumbing facilities: 1.9%
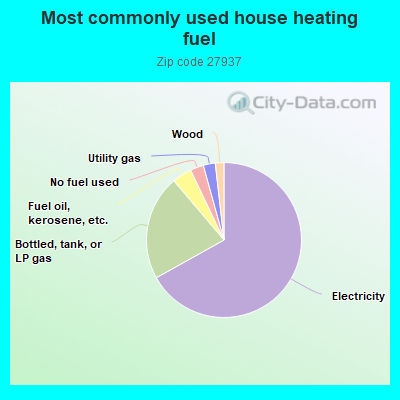
67.1%Electricity
22.0%Bottled, tank, or LP gas
4.1%Fuel oil, kerosene, etc.
2.8%No fuel used
2.5%Utility gas
1.8%Wood
Population in 1990: 2,598. Population change in the 1990s: +482 (+18.6%).
Place of birth for U.S.-born residents:
This state: 1,469
Northeast: 136
Midwest: 147
South: 1,311
West: 30
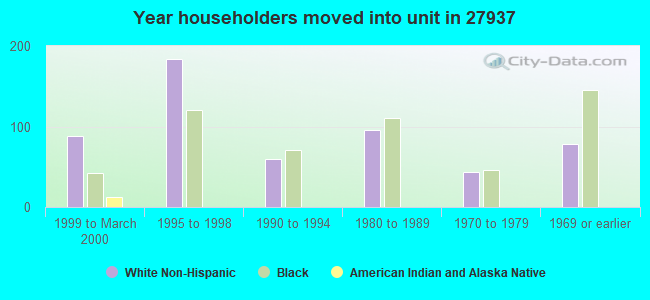
60% of the 27937 zip code residents lived in the same house 5 years ago. Out of people who lived in different houses, 42% lived in this county. Out of people who lived in different counties, 50% lived in North Carolina.
89% of the 27937 zip code residents lived in the same house 1 year ago. Out of people who lived in different houses, 31% moved from this county. Out of people who lived in different houses, 20% moved from different county within same state. Out of people who lived in different houses, 52% moved from different state.
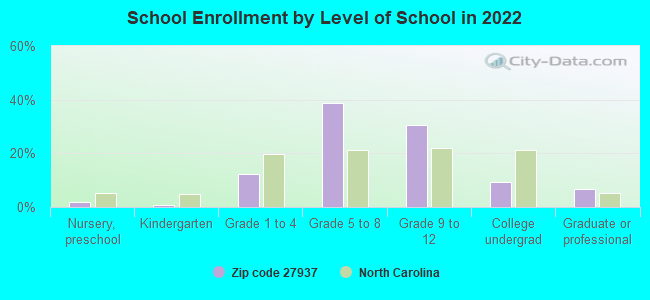
Private vs. public school enrollment:
Students in private schools in grades 1 to 8 (elementary and middle school): 13
Here:
5.7%
North Carolina:
13.8%
Students in private schools in grades 9 to 12 (high school): 15
Here:
10.8%
North Carolina:
11.9%
Students in private undergraduate colleges: 37
Here:
81.5%
North Carolina:
19.3%
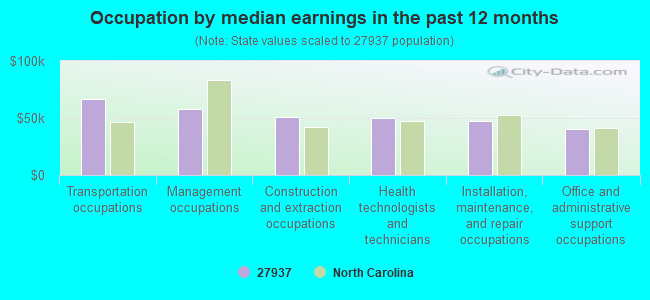
Occupation by median earnings in the past 12 months ($)
66,468Transportation occupations
57,918Management occupations
51,260Construction and extraction occupations
49,753Health technologists and technicians
47,612Installation, maintenance, and repair occupations
40,657Office and administrative support occupations
Top industries in this zip code by the number of employees in 2005:
Accommodation and Food Services: Full-Service Restaurants (20-49 employees: 1 establishment)
Wholesale Trade: Grain and Field Bean Merchant Wholesalers (10-19: 1)
Health Care and Social Assistance: Home Health Care Services (10-19: 1)
Accommodation and Food Services: Snack and Nonalcoholic Beverage Bars (5-9: 1)
Health Care and Social Assistance: Child Day Care Services (5-9: 1)
Construction: Siding Contractors (1-4: 2)
Construction: New Single-Family Housing Construction (except Operative Builders) (1-4: 1)
Fatal accident statistics in 2014:
Fatal accident count: 3
Vehicles involved in fatal accidents: 5
Fatal accidents caused by drunken drivers: 1
Fatalities: 3
Persons involved in fatal accidents: 4
Pedestrians involved in fatal accidents: 1
Fatal accident statistics in 2012:
Fatal accident count: 2
Vehicles involved in fatal accidents: 2
Fatal accidents caused by drunken drivers: 1
Fatalities: 2
Persons involved in fatal accidents: 2
Pedestrians involved in fatal accidents: 0
2002 - 2017 National Fire Incident Reporting System (NFIRS) incidents
According to the data from the years 2002 - 2017 the average number of fires per year is 12. The highest number of reported fire incidents - 64 took place in 2007, and the least - 1 in 2002. The data has an increasing trend.
When looking into fire subcategories, the most reports belonged to: Structure Fires (55.3%), and Outside Fires (33.0%).
Fire incident types reported to NFIRS in Zip Code 27937


 Nearest zip codes: 23438, 27935, 23437, 27938, 27926, 27986.
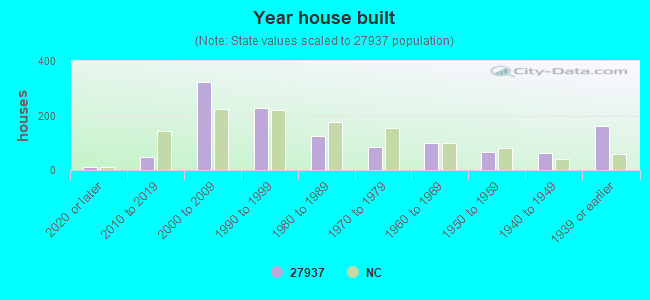


 (Location: 448 NC 37 NORTH, Grades: PK-5)
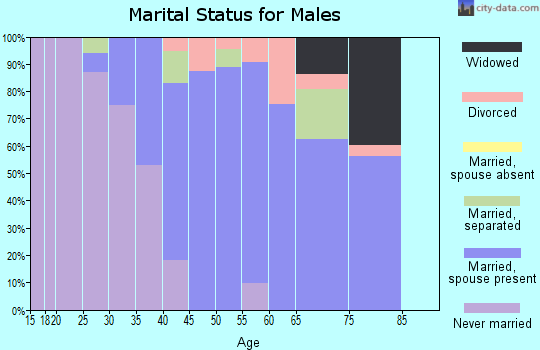
 According to the data from the years 2002 - 2017 the average number of fires per year is 12. The highest number of reported fire incidents - 64 took place in 2007, and the least - 1 in 2002. The data has an increasing trend.
 When looking into fire subcategories, the most reports belonged to: Structure Fires (55.3%), and Outside Fires (33.0%).