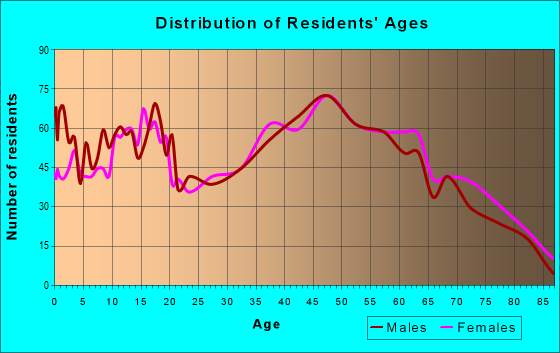
Estimated zip code population in 2022: 8,172 Zip code population in 2010: 8,342 Zip code population in 2000: 8,275
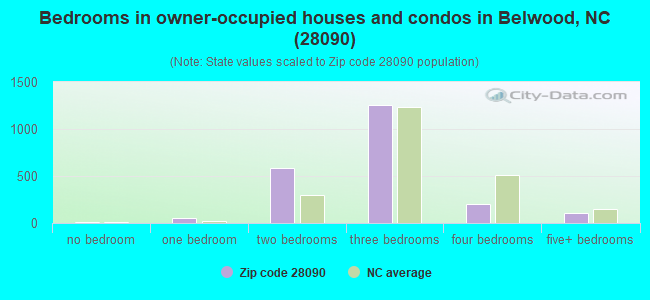
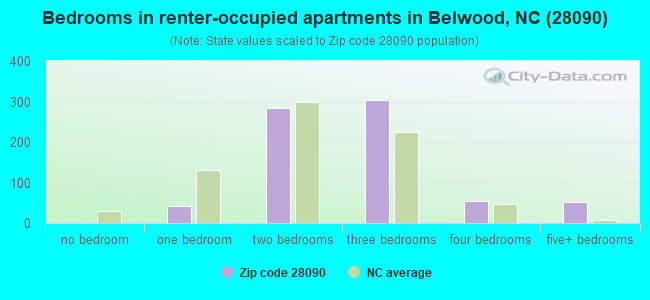
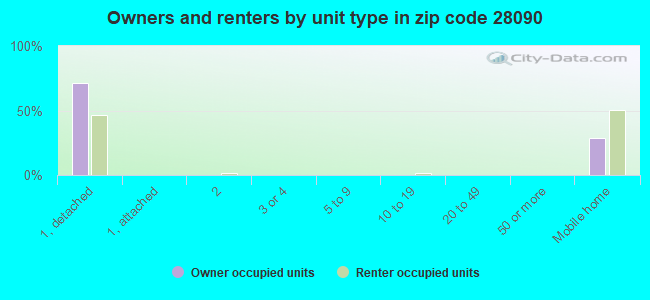
Houses and condos: 3,664 Renter-occupied apartments: 742
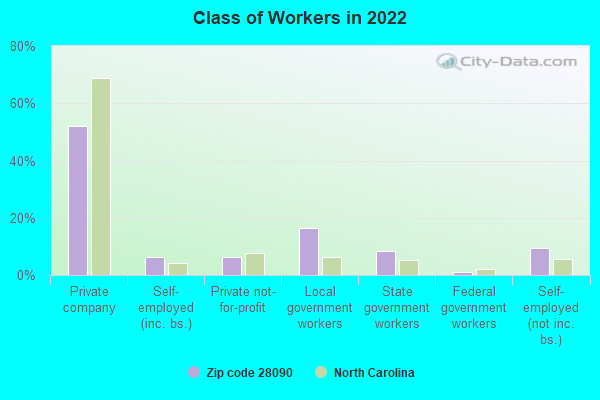
% of renters here:
25%
State:
33%
March 2022 cost of living index in zip code 28090: 78.9 (low, U.S. average is 100)
Land area: 93.6 sq. mi. Water area: 0.3 sq. mi.
Population density: 87 people per square mile
(very low).
OSM Map
General Map
Google Map
MSN Map
OSM Map
General Map
Google Map
MSN Map
OSM Map
General Map
Google Map
MSN Map
OSM Map
General Map
Google Map
MSN Map
Please wait while loading the map...
Real estate property taxes paid for housing units in 2022:
This zip code:
0.5% ($726)
North Carolina:
0.6% ($1,769)
Median real estate property taxes paid for housing units with mortgages in 2022: $1,256 (0.5%) Median real estate property taxes paid for housing units with no mortgage in 2022: $633 (0.6%)
Averages for the 2020 tax year for zip code 28090, filed in 2021:
Average Adjusted Gross Income (AGI) in 2020: $46,357 (Individual Income Tax Returns)
Here:
$46,357
State:
$70,020
Salary/wage: $41,114 (reported on 84.7% of returns)
Here:
$41,114
State:
$58,387
(% of AGI for various income ranges: 1247.0% for AGIs below $25k, 3810.7% for AGIs $25k-50k, 6748.4% for AGIs $50k-75k, 9583.8% for AGIs $75k-100k, 15478.9% for AGIs $100k-200k)
Taxable interest for individuals: $1,065 (reported on 24.5% of returns)
This zip code:
$1,065
North Carolina:
$1,479
(% of AGI for various income ranges: 9.8% for AGIs below $25k, 15.8% for AGIs $25k-50k, 47.7% for AGIs $50k-75k, 88.1% for AGIs $75k-100k, 106.3% for AGIs $100k-200k)
Ordinary dividends: $3,967 (reported on 11.9% of returns)
Here:
$3,967
State:
$7,888
(% of AGI for various income ranges: 10.8% for AGIs below $25k, 27.3% for AGIs $25k-50k, 37.7% for AGIs $50k-75k, 166.2% for AGIs $75k-100k, 213.7% for AGIs $100k-200k)
Net capital gain/loss in AGI: +$4,263 (reported on 9.2% of returns)
Here:
+$4,263
State:
+$23,652
(% of AGI for various income ranges: 3.4% for AGIs below $25k, 6.3% for AGIs $25k-50k, 76.5% for AGIs $50k-75k, 144.3% for AGIs $75k-100k, 348.4% for AGIs $100k-200k)
Profit/loss from business: +$6,093 (reported on 12.5% of returns)
Here:
+$6,093
State:
+$11,710
(% of AGI for various income ranges: 102.8% for AGIs below $25k, 67.9% for AGIs $25k-50k, 100.0% for AGIs $50k-75k, 99.5% for AGIs $75k-100k, 284.7% for AGIs $100k-200k)
Taxable individual retirement arrangement distribution: $12,236 (reported on 8.6% of returns)
28090:
$12,236
North Carolina:
$20,247
(% of AGI for various income ranges: 49.9% for AGIs below $25k, 84.6% for AGIs $25k-50k, 134.2% for AGIs $50k-75k, 370.0% for AGIs $75k-100k, 614.7% for AGIs $100k-200k)
Total itemized deductions: $31,190 (reported on 3.1% of returns)
Here:
$31,190
State:
$34,549
(% of AGI for various income ranges: 55.3% for AGIs below $25k, 360.0% for AGIs $50k-75k, 783.7% for AGIs $100k-200k)
Charity contributions: $10,825 (reported on 2.4% of returns)
Here:
$10,825
State:
$13,360
(% of AGI for various income ranges: 102.9% for AGIs $50k-75k, 287.9% for AGIs $100k-200k)
Taxes paid: $5,950 (reported on 3.1% of returns)
28090:
$5,950
State:
$7,586
(% of AGI for various income ranges: 4.6% for AGIs below $25k, 50.6% for AGIs $50k-75k, 207.9% for AGIs $100k-200k)
Earned income credit: $2,461 (reported on 23.5% of returns)
Here:
$2,461
State:
$2,337
(% of AGI for various income ranges: 136.6% for AGIs below $25k, 88.0% for AGIs $25k-50k)
Percentage of individuals using paid preparers for their 2020 taxes: 93.6%
Here:
94%
State:
93%
(% for various income ranges: 91.3% for AGIs below $25k, 95.7% for AGIs $25k-50k, 93.2% for AGIs $50k-75k, 93.8% for AGIs $75k-100k, 96.7% for AGIs $100k-200k, 100.0% for AGIs over 200k)
Averages for the 2012 tax year for zip code 28090, filed in 2013:
Average Adjusted Gross Income (AGI) in 2012: $38,098 (Individual Income Tax Returns)
Here:
$38,098
State:
$54,937
Salary/wage: $34,806 (reported on 83.6% of returns)
Here:
$34,806
State:
$46,336
(% of AGI for various income ranges: 74.0% for AGIs below $25k, 81.9% for AGIs $25k-50k, 78.7% for AGIs $50k-75k, 81.2% for AGIs $75k-100k, 64.0% for AGIs $100k-200k)
Taxable interest for individuals: $1,174 (reported on 29.4% of returns)
This zip code:
$1,174
North Carolina:
$1,298
(% of AGI for various income ranges: 1.2% for AGIs below $25k, 0.8% for AGIs $25k-50k, 1.1% for AGIs $50k-75k, 0.9% for AGIs $75k-100k, 0.6% for AGIs $100k-200k)
Ordinary dividends: $2,749 (reported on 12.2% of returns)
Here:
$2,749
State:
$6,213
(% of AGI for various income ranges: 0.5% for AGIs below $25k, 0.6% for AGIs $25k-50k, 0.5% for AGIs $50k-75k, 0.6% for AGIs $75k-100k, 2.2% for AGIs $100k-200k)
Net capital gain/loss in AGI: +$1,388 (reported on 8.4% of returns)
Here:
+$1,388
State:
+$12,740
(% of AGI for various income ranges: 0.6% for AGIs $50k-75k, 0.1% for AGIs $75k-100k, 0.8% for AGIs $100k-200k)
Profit/loss from business: +$5,819 (reported on 14.7% of returns)
Here:
+$5,819
State:
+$10,311
(% of AGI for various income ranges: 7.4% for AGIs below $25k, 1.6% for AGIs $25k-50k, 0.6% for AGIs $50k-75k, 1.7% for AGIs $75k-100k, 1.2% for AGIs $100k-200k)
Taxable individual retirement arrangement distribution: $9,333 (reported on 9.4% of returns)
28090:
$9,333
North Carolina:
$15,575
(% of AGI for various income ranges: 3.0% for AGIs below $25k, 1.4% for AGIs $25k-50k, 2.5% for AGIs $50k-75k, 2.7% for AGIs $75k-100k, 2.3% for AGIs $100k-200k)
Total itemized deductions: $17,311 (24% of AGI, reported on 23.1% of returns)
Here:
$17,311
State:
$23,438
Here:
24.1% of AGI
State:
21.5% of AGI
(% of AGI for various income ranges: 6.0% for AGIs below $25k, 8.8% for AGIs $25k-50k, 10.3% for AGIs $50k-75k, 13.3% for AGIs $75k-100k, 13.6% for AGIs $100k-200k)
Charity contributions: $3,878 (reported on 19.2% of returns)
Here:
$3,878
State:
$4,687
(% of AGI for various income ranges: 0.9% for AGIs below $25k, 1.5% for AGIs $25k-50k, 1.8% for AGIs $50k-75k, 2.4% for AGIs $75k-100k, 3.2% for AGIs $100k-200k)
Taxes paid: $5,395 (reported on 23.1% of returns)
28090:
$5,395
State:
$8,823
(% of AGI for various income ranges: 0.8% for AGIs below $25k, 1.9% for AGIs $25k-50k, 2.8% for AGIs $50k-75k, 4.7% for AGIs $75k-100k, 6.1% for AGIs $100k-200k)
Earned income credit: $2,446 (reported on 28.7% of returns)
Here:
$2,446
State:
$2,376
(% of AGI for various income ranges: 9.3% for AGIs below $25k, 1.6% for AGIs $25k-50k)
Percentage of individuals using paid preparers for their 2012 taxes: 63.6%
Here:
64%
State:
53%
(% for various income ranges: 61.2% for AGIs below $25k, 63.9% for AGIs $25k-50k, 65.9% for AGIs $50k-75k, 70.8% for AGIs $75k-100k, 66.7% for AGIs $100k-200k)
Averages for the 2004 tax year for zip code 28090, filed in 2005:
Average Adjusted Gross Income (AGI) in 2004: $32,047 (Individual Income Tax Returns)
Here:
$32,047
State:
$45,376
Salary/wage: $30,275 (reported on 86.8% of returns)
Here:
$30,275
State:
$39,442
(% of AGI for various income ranges: 84.5% for AGIs below $10k, 81.0% for AGIs $10k-25k, 84.3% for AGIs $25k-50k, 87.5% for AGIs $50k-75k, 82.5% for AGIs $75k-100k, 64.0% for AGIs over 100k)
Taxable interest for individuals: $1,134 (reported on 35.3% of returns)
This zip code:
$1,134
North Carolina:
$1,515
(% of AGI for various income ranges: 5.3% for AGIs below $10k, 1.5% for AGIs $10k-25k, 1.2% for AGIs $25k-50k, 0.8% for AGIs $50k-75k, 0.8% for AGIs $75k-100k, 1.5% for AGIs over 100k)
Taxable dividends: $1,610 (reported on 14.1% of returns)
Here:
$1,610
State:
$4,016
(% of AGI for various income ranges: 1.5% for AGIs below $10k, 0.7% for AGIs $10k-25k, 0.4% for AGIs $25k-50k, 0.4% for AGIs $50k-75k, 0.5% for AGIs $75k-100k, 2.4% for AGIs over 100k)
Net capital gain/loss: +$2,220 (reported on 7.8% of returns)
Here:
+$2,220
State:
+$11,152
(% of AGI for various income ranges: 0.9% for AGIs below $10k, 0.4% for AGIs $10k-25k, -0.0% for AGIs $25k-50k, 0.1% for AGIs $50k-75k, 0.2% for AGIs $75k-100k, 3.3% for AGIs over 100k)
Profit/loss from business: +$3,699 (reported on 12.9% of returns)
Here:
+$3,699
State:
+$9,490
(% of AGI for various income ranges: -5.0% for AGIs below $10k, 3.9% for AGIs $10k-25k, 2.2% for AGIs $25k-50k, 1.5% for AGIs $50k-75k, 0.4% for AGIs $75k-100k, -1.0% for AGIs over 100k)
IRA payment deduction: $2,912 (reported on 1.9% of returns)
28090:
$2,912
North Carolina:
$2,967
Total itemized deductions: $14,639 (25% of AGI, reported on 24.1% of returns)
Here:
$14,639
State:
$19,464
Here:
24.5% of AGI
State:
22.7% of AGI
(% of AGI for various income ranges: 9.4% for AGIs below $10k, 6.1% for AGIs $10k-25k, 10.5% for AGIs $25k-50k, 12.0% for AGIs $50k-75k, 14.9% for AGIs $75k-100k, 13.7% for AGIs over 100k)
Charity contributions deductions: $3,124 (5% of AGI, reported on 21.0% of returns)
Here:
$3,124
State:
$4,035
Here:
5.1% of AGI
State:
4.5% of AGI
(% of AGI for various income ranges: 1.0% for AGIs below $10k, 0.9% for AGIs $10k-25k, 1.7% for AGIs $25k-50k, 2.2% for AGIs $50k-75k, 2.8% for AGIs $75k-100k, 3.7% for AGIs over 100k)
Total tax: $3,550 (reported on 67.4% of returns)
28090:
$3,550
State:
$7,257
(% of AGI for various income ranges: 2.3% for AGIs below $10k, 3.2% for AGIs $10k-25k, 6.0% for AGIs $25k-50k, 7.9% for AGIs $50k-75k, 10.0% for AGIs $75k-100k, 15.0% for AGIs over 100k)
Earned income credit: $1,820 (reported on 25.5% of returns)
Here:
$1,820
State:
$1,851
Percentage of individuals using paid preparers for their 2004 taxes: 73.9%
Here:
74%
State:
62%
(% for various income ranges: 72.6% for AGIs below $10k, 76.5% for AGIs $10k-25k, 74.2% for AGIs $25k-50k, 72.4% for AGIs $50k-75k, 67.6% for AGIs $75k-100k, 69.9% for AGIs over 100k)
Household received Food Stamps/SNAP in the past 12 months: 607 Household did not receive Food Stamps/SNAP in the past 12 months: 2,386
Women who had a birth in the past 12 months: 155 (61 now married, 90 unmarried) Women who did not have a birth in the past 12 months: 1,224 (706 now married, 521 unmarried)
Housing units in zip code 28090 with a mortgage: 633 (80 second mortgage, 84 both second mortgage and home equity loan) Houses without a mortgage: 34
Median monthly owner costs for units with a mortgage: $1,014 Median monthly owner costs for units without a mortgage: $317
Residents with income below the poverty level in 2022:
This zip code:
15.2%
Whole state:
12.8%
Residents with income below 50% of the poverty level in 2022:
This zip code:
5.1%
Whole state:
6.8%
Median number of rooms in houses and condos:
Here:
5.6
State:
6.4
Median number of rooms in apartments:
Here:
5.1
State:
4.4
Notable locations in this zip code not listed on our city pages
Churches in zip code 28090 include: Kadesh Church (A), Elliotts Memorial Church (B), Saint Pauls Church (C), Ledford Grove Church (D), Philadelphia Church (E), Friendship Church (F), Normans Grove Church (G), Knob Creek Church (H), Pine Grove Church (I). Display/hide their locations on the map
Cemeteries: Eaker Cemetery (1), Warlick Cemetery (2), Rose Hill Cemetery (3), Mooney Cemetery (4), Salem Cemetery (5). Display/hide their locations on the map
Streams, rivers, and creeks: Duncans Creek (A), Dark Hollow Branch (B), Big Branch (C), Adams Branch (D), Knob Creek (E), Crooked Run Creek (F), Magness Creek (G), Maple Creek (H), Stoney Run Creek (I). Display/hide their locations on the map
In group quarters: 33 (-1 institutionalized population)
Size of family households: 904 2-persons, 618 3-persons, 369 4-persons, 78 5-persons, 97 6-persons, 35 7-or-more-persons
Size of nonfamily households: 749 1-person, 114 2-persons, 7 3-persons
1,144 married couples with children.
299 single-parent households (84 men, 215 women).
98.2% of residents of 28090 zip code speak English at home.
1.3% of residents speak Spanish at home (88% very well, 12% not at all).
0.2% of residents speak other Indo-European language at home (31% very well, 69% well).
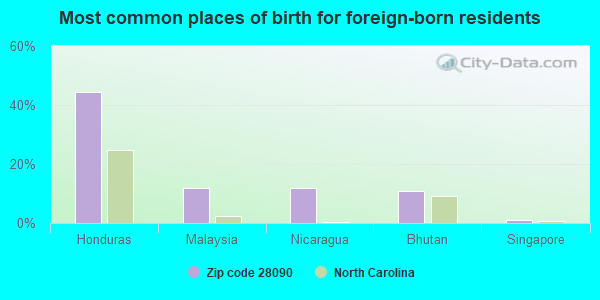
Foreign born population: 95 (1.2%) (86.1% of them are naturalized citizens)
This zip code:
1.2%
Whole state:
8.6%
45%Honduras
12%Malaysia
12%Nicaragua
11%Bhutan
1%Singapore
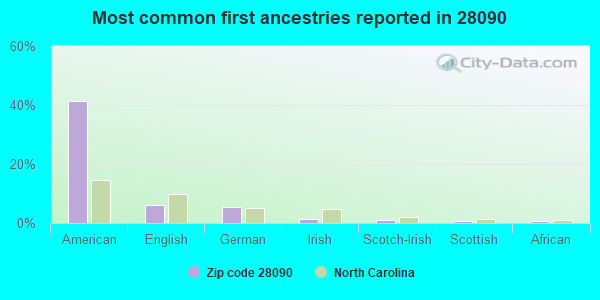
41%American
6%English
5%German
2%Irish
1%Scotch-Irish
1%Scottish
1%African
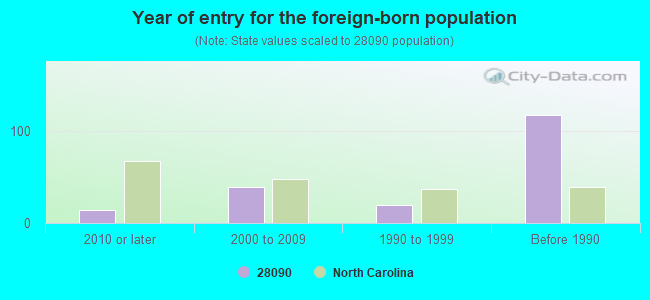
Year of entry for the foreign-born population
142010 or later
392000 to 2009
201990 to 1999
118Before 1990
Facilities with environmental interests located in this zip code:
CLEVELAND CAROKNIT (101 WEST MAIN STREET in LAWNDALE, NC)
AIR SYNTHETIC MINOR (AIRS/AFS) STATE MASTER (North Carolina facility info) - UNDERGROUND STORAGE TANK PROGRAM CRITERIA AND HAZARDOUS AIR POLLUTANT INVENTORY (Inventory of air pollution sources) National Pollutant Discharge Elimination System MAJOR (Tracking pollutant discharge elimination systems) - permit National Pollutant Discharge Elimination System NON-MAJOR (Tracking pollutant discharge elimination systems) - permit TRI REPORTER (Tracking of toxic chemicals releasing facilities) Business SIC classification: WEFT KNIT FABRIC MILLS; NONCLASSIFIABLE ESTABLISHMENTS Alternative names: CLEVELAND caro knit, CLEVELAND MILLS CO, E FLEX LLC E FLEX WWTP
CLEVELAND COUNTY SANITARY DISTRICT (435 CASAR-LAWNDALE ROAD in LAWNDALE, NC)
STATE MASTER (North Carolina facility info) - -66AN2CF000AA0D848WJTR1TAKA, WASTEWATER FACILITY National Pollutant Discharge Elimination System NON-MAJOR (Tracking pollutant discharge elimination systems) - permit Business SIC classification: WATER SUPPLY Alternative names: CLEVELAND CO SNTRY DIS CLEVELA, CLEVELAND COUNTY WTP, UPPER CLEVELAND CO. SAN.DIST.
BURNS HIGH (307 E STAGECOACH TRL in LAWNDALE, NC)
(National Center for Education Statistics) - STATE ID-312 Organizations: CLEVELAND COUNTY SCHOOLS (SCHOOL DISTRICT)
BURNS MIDDLE (215 SHADY GROVE RD in LAWNDALE, NC)
(National Center for Education Statistics) - STATE ID-316 Organizations: CLEVELAND COUNTY SCHOOLS (SCHOOL DISTRICT)
Housing units lacking complete plumbing facilities: 0.4% Housing units lacking complete kitchen facilities: 0.7%
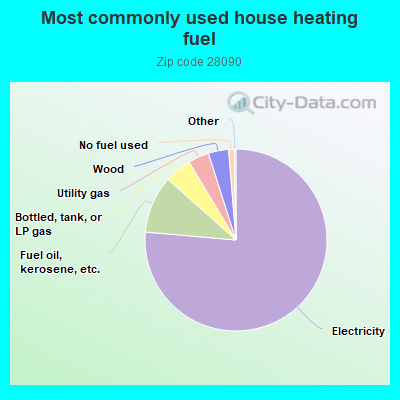
76.4%Electricity
10.2%Fuel oil, kerosene, etc.
4.8%Bottled, tank, or LP gas
3.7%Utility gas
3.6%Wood
1.0%No fuel used
Population in 1990: 6,842. Population change in the 1990s: +1,433 (+20.9%).
Place of birth for U.S.-born residents:
This state: 6,725
Northeast: 292
Midwest: 152
South: 556
West: 121
64% of the 28090 zip code residents lived in the same house 5 years ago. Out of people who lived in different houses, 61% lived in this county. Out of people who lived in different counties, 50% lived in North Carolina.
99% of the 28090 zip code residents lived in the same house 1 year ago. Out of people who lived in different houses, 34% moved from this county. Out of people who lived in different houses, 105% moved from different county within same state. Out of people who lived in different houses, 7% moved from different state. Out of people who lived in different houses, 12% moved from abroad.
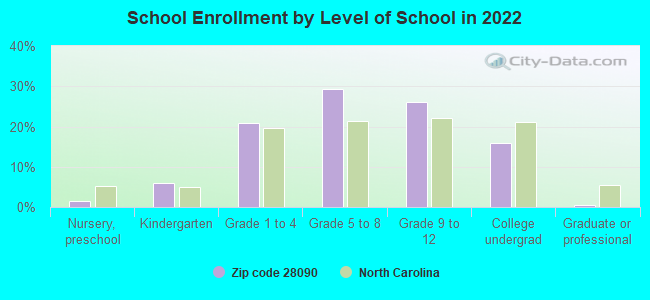
Private vs. public school enrollment:
Students in private schools in grades 1 to 8 (elementary and middle school): 37
Here:
4.5%
North Carolina:
13.8%
Students in private schools in grades 9 to 12 (high school): 2
Here:
0.5%
North Carolina:
11.9%
Students in private undergraduate colleges: 27
Here:
10.2%
North Carolina:
19.3%
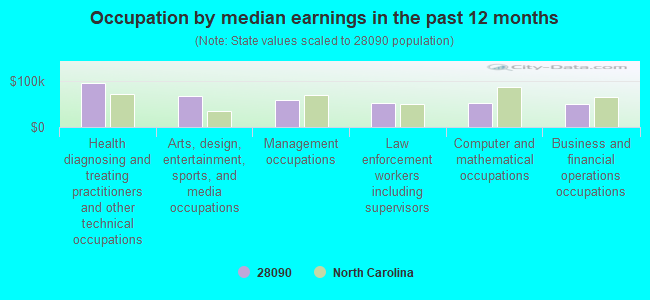
Occupation by median earnings in the past 12 months ($)
95,306Health diagnosing and treating practitioners and other technical occupations
66,428Arts, design, entertainment, sports, and media occupations
59,155Management occupations
52,363Law enforcement workers including supervisors
51,360Computer and mathematical occupations
50,786Business and financial operations occupations
Top industries in this zip code by the number of employees in 2005:
Other Services (except Public Administration): Religious Organizations (5-9 employees: 4 establishments, 1-4 employees: 8 establishments)
Wholesale Trade: Fresh Fruit and Vegetable Merchant Wholesalers (20-49: 1)
Professional, Scientific, and Technical Services: Interior Design Services (20-49: 1)
Accommodation and Food Services: Full-Service Restaurants (10-19: 1, 5-9: 1)
Health Care and Social Assistance: Homes for the Elderly (10-19: 1, 1-4: 1)
9 people in workers' group living quarters and job corps centers
People in group quarters in 2000:
106 people in other nonhousehold living situations
39 people in nursing homes
11 people in homes for the mentally ill
2 people in homes for the mentally retarded
Fatal accident statistics in 2014:
Fatal accident count: 1
Vehicles involved in fatal accidents: 2
Fatal accidents caused by drunken drivers: 0
Fatalities: 1
Persons involved in fatal accidents: 2
Pedestrians involved in fatal accidents: 0
Fatal accident statistics in 2012:
Fatal accident count: 2
Vehicles involved in fatal accidents: 3
Fatal accidents caused by drunken drivers: 2
Fatalities: 2
Persons involved in fatal accidents: 4
Pedestrians involved in fatal accidents: 0
2002 - 2018 National Fire Incident Reporting System (NFIRS) incidents
Based on the data from the years 2002 - 2018 the average number of fire incidents per year is 76. The highest number of reported fires - 101 took place in 2006, and the least - 47 in 2017. The data has a rising trend.
When looking into fire subcategories, the most reports belonged to: Structure Fires (52.7%), and Outside Fires (34.3%).
Fire incident types reported to NFIRS in Zip Code 28090
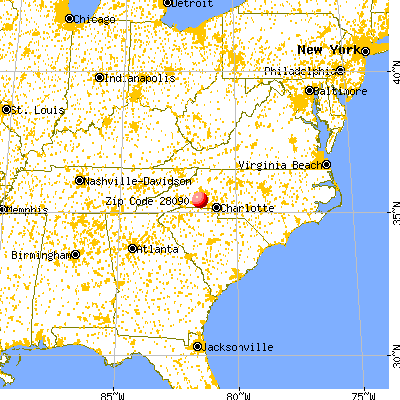


 Nearest zip codes: 28020, 28150, 28169, 28021, 28168, 28089.
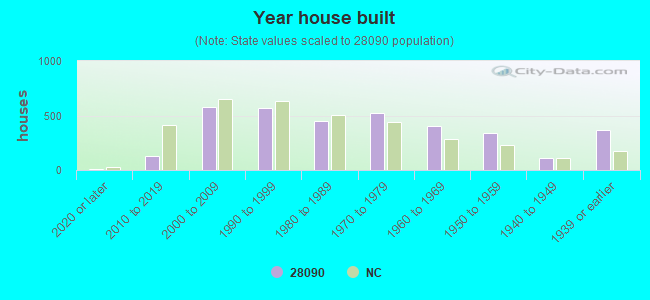


 Based on the data from the years 2002 - 2018 the average number of fire incidents per year is 76. The highest number of reported fires - 101 took place in 2006, and the least - 47 in 2017. The data has a rising trend.
 When looking into fire subcategories, the most reports belonged to: Structure Fires (52.7%), and Outside Fires (34.3%).