Estimated zip code population in 2022: 10,864 Zip code population in 2010: 10,230 Zip code population in 2000: 9,366
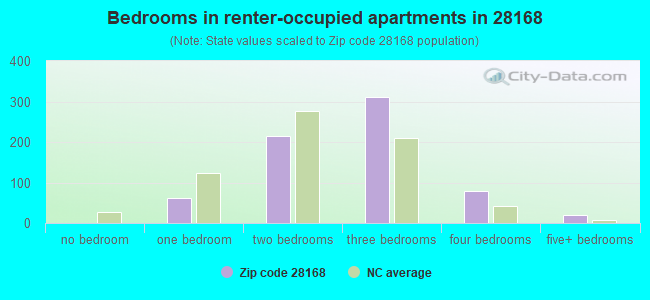
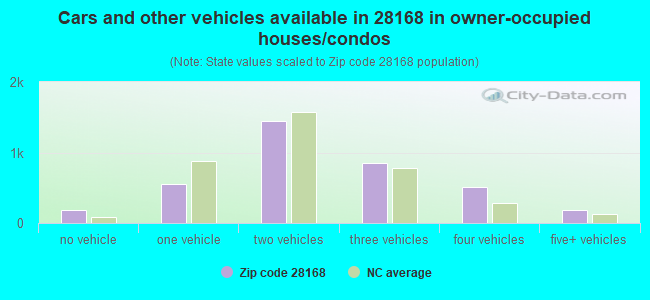
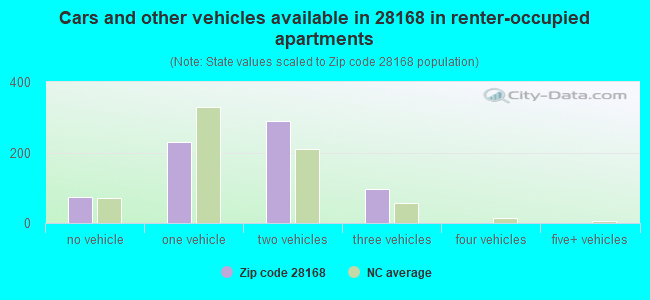
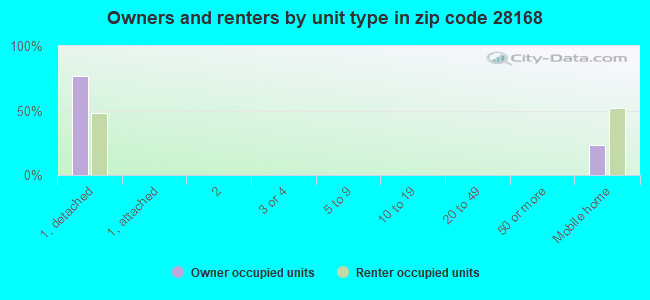
Houses and condos: 4,895 Renter-occupied apartments: 687
% of renters here:
15%
State:
33%
March 2022 cost of living index in zip code 28168: 80.0 (low, U.S. average is 100)
Land area: 86.7 sq. mi. Water area: 0.3 sq. mi.
Population density: 125 people per square mile
(very low).
OSM Map
General Map
Google Map
MSN Map
OSM Map
General Map
Google Map
MSN Map
OSM Map
General Map
Google Map
MSN Map
OSM Map
General Map
Google Map
MSN Map
Please wait while loading the map...
Real estate property taxes paid for housing units in 2022:
This zip code:
0.5% ($1,066)
North Carolina:
0.6% ($1,769)
Median real estate property taxes paid for housing units with mortgages in 2022: $1,176 (0.5%) Median real estate property taxes paid for housing units with no mortgage in 2022: $944 (0.6%)
Averages for the 2020 tax year for zip code 28168, filed in 2021:
Average Adjusted Gross Income (AGI) in 2020: $51,562 (Individual Income Tax Returns)
Here:
$51,562
State:
$70,020
Salary/wage: $46,316 (reported on 83.9% of returns)
Here:
$46,316
State:
$58,387
(% of AGI for various income ranges: 1187.7% for AGIs below $25k, 3594.0% for AGIs $25k-50k, 6648.9% for AGIs $50k-75k, 10271.6% for AGIs $75k-100k, 16188.3% for AGIs $100k-200k)
Taxable interest for individuals: $780 (reported on 27.7% of returns)
This zip code:
$780
North Carolina:
$1,479
(% of AGI for various income ranges: 18.5% for AGIs below $25k, 13.3% for AGIs $25k-50k, 32.6% for AGIs $50k-75k, 37.2% for AGIs $75k-100k, 90.7% for AGIs $100k-200k)
Ordinary dividends: $3,069 (reported on 11.3% of returns)
Here:
$3,069
State:
$7,888
(% of AGI for various income ranges: 12.5% for AGIs below $25k, 23.5% for AGIs $25k-50k, 42.2% for AGIs $50k-75k, 105.0% for AGIs $75k-100k, 179.3% for AGIs $100k-200k)
Net capital gain/loss in AGI: +$9,429 (reported on 10.5% of returns)
Here:
+$9,429
State:
+$23,652
(% of AGI for various income ranges: 20.7% for AGIs below $25k, 23.7% for AGIs $25k-50k, 35.9% for AGIs $50k-75k, 165.9% for AGIs $75k-100k, 532.3% for AGIs $100k-200k)
Profit/loss from business: +$8,378 (reported on 12.6% of returns)
Here:
+$8,378
State:
+$11,710
(% of AGI for various income ranges: 106.5% for AGIs below $25k, 139.2% for AGIs $25k-50k, 114.6% for AGIs $50k-75k, 180.3% for AGIs $75k-100k, 348.7% for AGIs $100k-200k)
Taxable individual retirement arrangement distribution: $12,321 (reported on 8.5% of returns)
28168:
$12,321
North Carolina:
$20,247
(% of AGI for various income ranges: 72.7% for AGIs below $25k, 71.0% for AGIs $25k-50k, 162.0% for AGIs $50k-75k, 300.3% for AGIs $75k-100k, 474.3% for AGIs $100k-200k)
Total itemized deductions: $31,013 (reported on 3.3% of returns)
Here:
$31,013
State:
$34,549
(% of AGI for various income ranges: 43.8% for AGIs below $25k, 213.0% for AGIs $50k-75k, 999.3% for AGIs $100k-200k)
Charity contributions: $14,517 (reported on 2.6% of returns)
Here:
$14,517
State:
$13,360
(% of AGI for various income ranges: 73.7% for AGIs $50k-75k, 448.0% for AGIs $100k-200k)
Taxes paid: $6,547 (reported on 3.3% of returns)
28168:
$6,547
State:
$7,586
(% of AGI for various income ranges: 6.3% for AGIs below $25k, 40.6% for AGIs $50k-75k, 230.3% for AGIs $100k-200k)
Earned income credit: $2,123 (reported on 19.6% of returns)
Here:
$2,123
State:
$2,337
(% of AGI for various income ranges: 99.3% for AGIs below $25k, 76.9% for AGIs $25k-50k)
Percentage of individuals using paid preparers for their 2020 taxes: 95.2%
Here:
95%
State:
93%
(% for various income ranges: 94.9% for AGIs below $25k, 95.2% for AGIs $25k-50k, 95.9% for AGIs $50k-75k, 95.8% for AGIs $75k-100k, 93.9% for AGIs $100k-200k, 100.0% for AGIs over 200k)
Averages for the 2012 tax year for zip code 28168, filed in 2013:
Average Adjusted Gross Income (AGI) in 2012: $40,437 (Individual Income Tax Returns)
Here:
$40,437
State:
$54,937
Salary/wage: $37,034 (reported on 86.3% of returns)
Here:
$37,034
State:
$46,336
(% of AGI for various income ranges: 75.5% for AGIs below $25k, 82.4% for AGIs $25k-50k, 81.3% for AGIs $50k-75k, 79.0% for AGIs $75k-100k, 78.4% for AGIs $100k-200k, 61.6% for AGIs over 200k)
Taxable interest for individuals: $707 (reported on 30.8% of returns)
This zip code:
$707
North Carolina:
$1,298
(% of AGI for various income ranges: 0.8% for AGIs below $25k, 0.8% for AGIs $25k-50k, 0.2% for AGIs $50k-75k, 0.5% for AGIs $75k-100k, 0.5% for AGIs $100k-200k, 0.4% for AGIs over 200k)
Ordinary dividends: $2,168 (reported on 12.0% of returns)
Here:
$2,168
State:
$6,213
(% of AGI for various income ranges: 0.7% for AGIs below $25k, 0.6% for AGIs $25k-50k, 0.4% for AGIs $50k-75k, 0.8% for AGIs $75k-100k, 1.2% for AGIs $100k-200k)
Net capital gain/loss in AGI: +$3,470 (reported on 8.0% of returns)
Here:
+$3,470
State:
+$12,740
(% of AGI for various income ranges: 0.3% for AGIs $25k-50k, 0.5% for AGIs $50k-75k, 0.5% for AGIs $75k-100k, 2.6% for AGIs $100k-200k)
Profit/loss from business: +$6,005 (reported on 14.0% of returns)
Here:
+$6,005
State:
+$10,311
(% of AGI for various income ranges: 7.1% for AGIs below $25k, 1.4% for AGIs $25k-50k, 1.4% for AGIs $50k-75k, 0.8% for AGIs $75k-100k, 1.8% for AGIs $100k-200k)
Taxable individual retirement arrangement distribution: $10,886 (reported on 8.7% of returns)
28168:
$10,886
North Carolina:
$15,575
(% of AGI for various income ranges: 3.1% for AGIs below $25k, 2.2% for AGIs $25k-50k, 1.9% for AGIs $50k-75k, 2.7% for AGIs $75k-100k, 2.8% for AGIs $100k-200k)
Total itemized deductions: $17,246 (24% of AGI, reported on 25.8% of returns)
Here:
$17,246
State:
$23,438
Here:
23.7% of AGI
State:
21.5% of AGI
(% of AGI for various income ranges: 6.4% for AGIs below $25k, 8.8% for AGIs $25k-50k, 10.6% for AGIs $50k-75k, 13.8% for AGIs $75k-100k, 16.1% for AGIs $100k-200k, 10.0% for AGIs over 200k)
Charity contributions: $3,833 (reported on 20.5% of returns)
Here:
$3,833
State:
$4,687
(% of AGI for various income ranges: 0.7% for AGIs below $25k, 1.2% for AGIs $25k-50k, 1.9% for AGIs $50k-75k, 2.8% for AGIs $75k-100k, 3.8% for AGIs $100k-200k)
Taxes paid: $5,519 (reported on 25.5% of returns)
28168:
$5,519
State:
$8,823
(% of AGI for various income ranges: 1.0% for AGIs below $25k, 2.2% for AGIs $25k-50k, 3.0% for AGIs $50k-75k, 4.5% for AGIs $75k-100k, 6.4% for AGIs $100k-200k, 6.8% for AGIs over 200k)
Earned income credit: $2,353 (reported on 24.1% of returns)
Here:
$2,353
State:
$2,376
(% of AGI for various income ranges: 7.6% for AGIs below $25k, 1.5% for AGIs $25k-50k)
Percentage of individuals using paid preparers for their 2012 taxes: 61.2%
Here:
61%
State:
53%
(% for various income ranges: 56.4% for AGIs below $25k, 62.5% for AGIs $25k-50k, 65.7% for AGIs $50k-75k, 67.6% for AGIs $75k-100k, 76.2% for AGIs $100k-200k)
Averages for the 2004 tax year for zip code 28168, filed in 2005:
Average Adjusted Gross Income (AGI) in 2004: $34,962 (Individual Income Tax Returns)
Here:
$34,962
State:
$45,376
Salary/wage: $32,621 (reported on 89.5% of returns)
Here:
$32,621
State:
$39,442
(% of AGI for various income ranges: 100.6% for AGIs below $10k, 83.8% for AGIs $10k-25k, 86.4% for AGIs $25k-50k, 87.1% for AGIs $50k-75k, 82.5% for AGIs $75k-100k, 65.2% for AGIs over 100k)
Taxable interest for individuals: $872 (reported on 36.8% of returns)
This zip code:
$872
North Carolina:
$1,515
(% of AGI for various income ranges: 3.1% for AGIs below $10k, 1.5% for AGIs $10k-25k, 0.9% for AGIs $25k-50k, 0.7% for AGIs $50k-75k, 0.7% for AGIs $75k-100k, 0.6% for AGIs over 100k)
Taxable dividends: $1,659 (reported on 13.6% of returns)
Here:
$1,659
State:
$4,016
(% of AGI for various income ranges: 1.8% for AGIs below $10k, 0.8% for AGIs $10k-25k, 0.3% for AGIs $25k-50k, 0.6% for AGIs $50k-75k, 0.8% for AGIs $75k-100k, 1.1% for AGIs over 100k)
Net capital gain/loss: +$4,360 (reported on 9.1% of returns)
Here:
+$4,360
State:
+$11,152
(% of AGI for various income ranges: -0.3% for AGIs below $10k, 0.3% for AGIs $10k-25k, 0.4% for AGIs $25k-50k, 0.4% for AGIs $50k-75k, 1.4% for AGIs $75k-100k, 5.9% for AGIs over 100k)
Profit/loss from business: +$5,743 (reported on 14.8% of returns)
Here:
+$5,743
State:
+$9,490
(% of AGI for various income ranges: 13.7% for AGIs below $10k, 4.0% for AGIs $10k-25k, 1.8% for AGIs $25k-50k, 2.3% for AGIs $50k-75k, 0.7% for AGIs $75k-100k, 3.0% for AGIs over 100k)
IRA payment deduction: $3,232 (reported on 1.7% of returns)
28168:
$3,232
North Carolina:
$2,967
Total itemized deductions: $14,604 (25% of AGI, reported on 29.0% of returns)
Here:
$14,604
State:
$19,464
Here:
24.6% of AGI
State:
22.7% of AGI
(% of AGI for various income ranges: 21.2% for AGIs below $10k, 6.5% for AGIs $10k-25k, 10.0% for AGIs $25k-50k, 13.8% for AGIs $50k-75k, 16.0% for AGIs $75k-100k, 14.1% for AGIs over 100k)
Charity contributions deductions: $3,043 (5% of AGI, reported on 23.1% of returns)
Here:
$3,043
State:
$4,035
Here:
4.8% of AGI
State:
4.5% of AGI
(% of AGI for various income ranges: 0.9% for AGIs below $10k, 0.7% for AGIs $10k-25k, 1.3% for AGIs $25k-50k, 2.4% for AGIs $50k-75k, 3.4% for AGIs $75k-100k, 3.0% for AGIs over 100k)
Total tax: $3,842 (reported on 72.8% of returns)
28168:
$3,842
State:
$7,257
(% of AGI for various income ranges: 3.6% for AGIs below $10k, 3.7% for AGIs $10k-25k, 6.1% for AGIs $25k-50k, 8.1% for AGIs $50k-75k, 9.9% for AGIs $75k-100k, 16.6% for AGIs over 100k)
Earned income credit: $1,772 (reported on 20.9% of returns)
Here:
$1,772
State:
$1,851
Percentage of individuals using paid preparers for their 2004 taxes: 68.6%
Here:
69%
State:
62%
(% for various income ranges: 57.7% for AGIs below $10k, 73.6% for AGIs $10k-25k, 71.0% for AGIs $25k-50k, 67.6% for AGIs $50k-75k, 67.8% for AGIs $75k-100k, 67.9% for AGIs over 100k)
Household received Food Stamps/SNAP in the past 12 months: 571 Household did not receive Food Stamps/SNAP in the past 12 months: 3,849
Women who had a birth in the past 12 months: 46 (48 now married, 0 unmarried) Women who did not have a birth in the past 12 months: 2,247 (1,035 now married, 1,213 unmarried)
Housing units in zip code 28168 with a mortgage: 1,917 (139 second mortgage, 139 both second mortgage and home equity loan) Houses without a mortgage: 31
Median monthly owner costs for units with a mortgage: $1,142 Median monthly owner costs for units without a mortgage: $322
Residents with income below the poverty level in 2022:
This zip code:
12.4%
Whole state:
12.8%
Residents with income below 50% of the poverty level in 2022:
This zip code:
8.9%
Whole state:
6.8%
Median number of rooms in houses and condos:
Here:
5.8
State:
6.4
Median number of rooms in apartments:
Here:
5.1
State:
4.4
Notable locations in this zip code not listed on our city pages
Churches in zip code 28168 include: Hebron Church (A), Hulls Grove Church (B), Indian Creek Church (C), John Grace Church (D), Travis Chapel (E), Trinity Church (F), Bethel Church (G), Macedonia Church (H), Beulah Church (I). Display/hide their locations on the map
In group quarters: 4 (-1 institutionalized population)
Size of family households: 1,777 2-persons, 726 3-persons, 548 4-persons, 159 5-persons, 54 6-persons, 53 7-or-more-persons
Size of nonfamily households: 825 1-person, 226 2-persons, 56 3-persons
1,458 married couples with children.
387 single-parent households (80 men, 307 women).
94.8% of residents of 28168 zip code speak English at home.
4.9% of residents speak Spanish at home (78% very well, 22% well).
0.2% of residents speak other Indo-European language at home (100% very well).
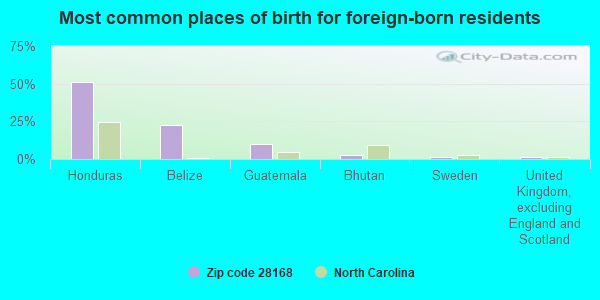
Foreign born population: 512 (4.7%) (44.7% of them are naturalized citizens)
This zip code:
4.7%
Whole state:
8.6%
51%Honduras
22%Belize
10%Guatemala
3%Bhutan
1%Sweden
1%United Kingdom, excluding England and Scotland
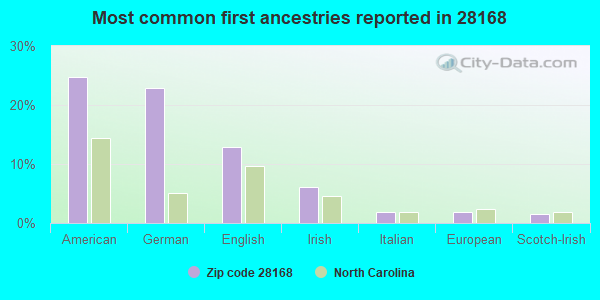
25%American
23%German
13%English
6%Irish
2%Italian
2%European
2%Scotch-Irish
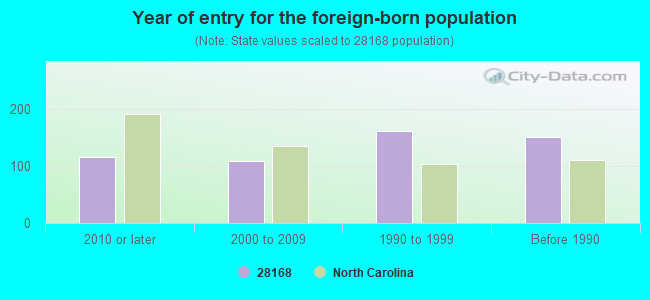
Year of entry for the foreign-born population
1152010 or later
1092000 to 2009
1611990 to 1999
151Before 1990
Facilities with environmental interests located in this zip code:
BANOAK ELEMENTARY SCHOOL (7651 WEST NC 10 HIGHWAY in VALE, NC)
(Geographic Names Information System) STATE MASTER (North Carolina facility info) - UNDERGROUND STORAGE TANK PROGRAM (National Center for Education Statistics) - STATE ID-312 Business SIC classification: NONCLASSIFIABLE ESTABLISHMENTS Organizations: CATAWBA COUNTY SCHOOLS (SCHOOL DISTRICT)
Housing units lacking complete plumbing facilities: 3.3% Housing units lacking complete kitchen facilities: 1.0%
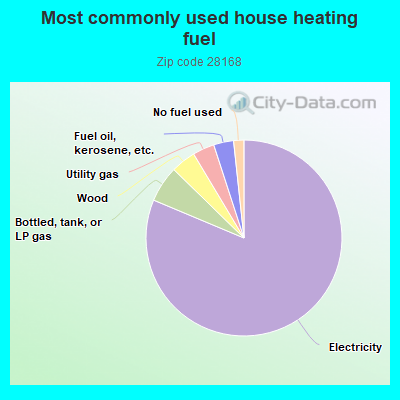
81.4%Electricity
6.0%Bottled, tank, or LP gas
4.1%Wood
3.6%Utility gas
3.3%Fuel oil, kerosene, etc.
1.7%No fuel used
Population in 1990: 3,422. Population change in the 1990s: +5,944 (+173.7%).
Place of birth for U.S.-born residents:
This state: 7,706
Northeast: 458
Midwest: 578
South: 1,264
West: 203
66% of the 28168 zip code residents lived in the same house 5 years ago. Out of people who lived in different houses, 59% lived in this county. Out of people who lived in different counties, 50% lived in North Carolina.
94% of the 28168 zip code residents lived in the same house 1 year ago. Out of people who lived in different houses, 69% moved from this county. Out of people who lived in different houses, 17% moved from different county within same state. Out of people who lived in different houses, 14% moved from different state.
Private vs. public school enrollment:
Students in private schools in grades 1 to 8 (elementary and middle school): 46
Here:
4.4%
North Carolina:
13.8%
Students in private schools in grades 9 to 12 (high school):
Here:
0.0%
North Carolina:
11.9%
Students in private undergraduate colleges: 127
Here:
33.5%
North Carolina:
19.3%
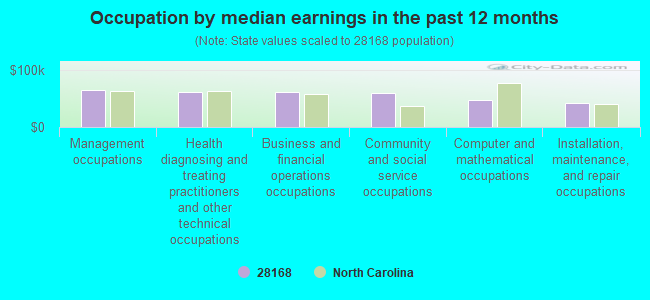
Occupation by median earnings in the past 12 months ($)
64,853Management occupations
61,433Health diagnosing and treating practitioners and other technical occupations
60,956Business and financial operations occupations
59,613Community and social service occupations
47,439Computer and mathematical occupations
41,658Installation, maintenance, and repair occupations
Top industries in this zip code by the number of employees in 2005:
Other Services (except Public Administration): Religious Organizations (10-19 employees: 1 establishment, 5-9 employees: 3 establishments, 1-4 employees: 6 establishments)
Construction: Site Preparation Contractors (20-49: 1, 1-4: 2)
Health Care and Social Assistance: Child Day Care Services (20-49: 1)
People in group quarters in 2010:
3 people in workers' group living quarters and job corps centers
Fatal accident statistics in 2014:
Fatal accident count: 3
Vehicles involved in fatal accidents: 4
Fatal accidents caused by drunken drivers: 2
Fatalities: 4
Persons involved in fatal accidents: 6
Pedestrians involved in fatal accidents: 2
Fatal accident statistics in 2013:
Fatal accident count: 1
Vehicles involved in fatal accidents: 1
Fatal accidents caused by drunken drivers: 1
Fatalities: 1
Persons involved in fatal accidents: 1
Pedestrians involved in fatal accidents: 0
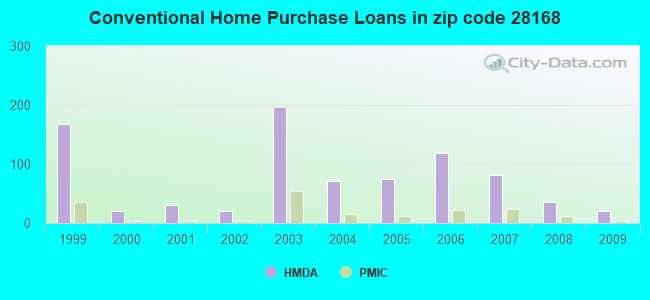
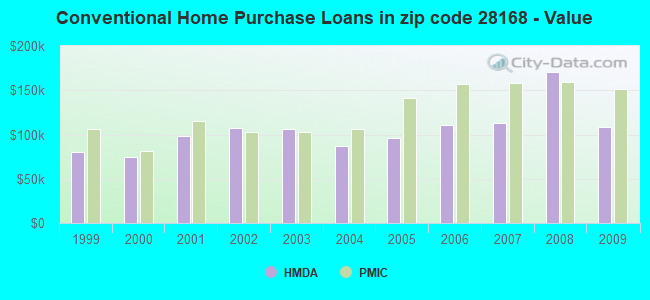
Home Mortgage Disclosure Act Aggregated Statistics For Year 2009 (Based on 2 partial tracts)
A) FHA, FSA/RHS & VA Home Purchase Loans
B) Conventional Home Purchase Loans
C) Refinancings
D) Home Improvement Loans
F) Non-occupant Loans on < 5 Family Dwellings (A B C & D)
G) Loans On Manufactured Home Dwelling (A B C & D)
Number
Average Value
Number
Average Value
Number
Average Value
Number
Average Value
Number
Average Value
Number
Average Value
LOANS ORIGINATED
22
$106,935
20
$108,466
131
$142,866
8
$70,401
12
$127,554
20
$122,007
APPLICATIONS APPROVED, NOT ACCEPTED
0
$0
1
$242,530
13
$163,243
0
$0
0
$0
3
$55,693
APPLICATIONS DENIED
4
$218,280
5
$80,306
43
$119,856
8
$13,811
5
$40,152
9
$54,644
APPLICATIONS WITHDRAWN
3
$145,520
7
$167,463
36
$130,511
0
$0
0
$0
5
$77,340
FILES CLOSED FOR INCOMPLETENESS
3
$191,330
1
$128,000
9
$148,813
1
$78,150
1
$256,010
3
$64,227
Aggregated Statistics For Year 2008 (Based on 2 partial tracts)
A) FHA, FSA/RHS & VA Home Purchase Loans
B) Conventional Home Purchase Loans
C) Refinancings
D) Home Improvement Loans
F) Non-occupant Loans on < 5 Family Dwellings (A B C & D)
G) Loans On Manufactured Home Dwelling (A B C & D)
Number
Average Value
Number
Average Value
Number
Average Value
Number
Average Value
Number
Average Value
Number
Average Value
LOANS ORIGINATED
31
$117,615
35
$170,196
102
$119,470
16
$47,412
11
$69,330
42
$72,599
APPLICATIONS APPROVED, NOT ACCEPTED
1
$212,890
3
$96,113
8
$106,781
1
$33,690
0
$0
4
$60,295
APPLICATIONS DENIED
1
$220,970
8
$103,076
82
$120,116
15
$84,976
3
$234,897
23
$78,735
APPLICATIONS WITHDRAWN
4
$99,370
3
$91,173
27
$153,104
3
$172,917
1
$40,420
4
$77,138
FILES CLOSED FOR INCOMPLETENESS
3
$116,773
0
$0
7
$154,373
0
$0
0
$0
3
$79,497
Aggregated Statistics For Year 2007 (Based on 2 partial tracts)
A) FHA, FSA/RHS & VA Home Purchase Loans
B) Conventional Home Purchase Loans
C) Refinancings
D) Home Improvement Loans
F) Non-occupant Loans on < 5 Family Dwellings (A B C & D)
G) Loans On Manufactured Home Dwelling (A B C & D)
Number
Average Value
Number
Average Value
Number
Average Value
Number
Average Value
Number
Average Value
Number
Average Value
LOANS ORIGINATED
8
$111,160
81
$112,782
104
$110,539
12
$40,422
13
$53,688
46
$76,333
APPLICATIONS APPROVED, NOT ACCEPTED
0
$0
7
$85,656
20
$73,972
3
$46,710
1
$134,740
4
$54,570
APPLICATIONS DENIED
0
$0
19
$95,453
109
$106,086
22
$56,101
3
$83,090
35
$78,611
APPLICATIONS WITHDRAWN
1
$86,230
9
$153,903
27
$138,283
3
$122,163
0
$0
5
$79,228
FILES CLOSED FOR INCOMPLETENESS
3
$131,147
4
$127,330
12
$147,878
0
$0
0
$0
1
$133,390
Aggregated Statistics For Year 2006 (Based on 2 partial tracts)
A) FHA, FSA/RHS & VA Home Purchase Loans
B) Conventional Home Purchase Loans
C) Refinancings
D) Home Improvement Loans
F) Non-occupant Loans on < 5 Family Dwellings (A B C & D)
G) Loans On Manufactured Home Dwelling (A B C & D)
Number
Average Value
Number
Average Value
Number
Average Value
Number
Average Value
Number
Average Value
Number
Average Value
LOANS ORIGINATED
13
$114,425
119
$110,408
128
$88,413
16
$66,191
27
$65,973
59
$63,944
APPLICATIONS APPROVED, NOT ACCEPTED
0
$0
20
$83,472
32
$91,497
3
$26,050
0
$0
13
$58,975
APPLICATIONS DENIED
4
$98,698
36
$106,557
115
$87,780
13
$67,474
4
$45,475
50
$74,457
APPLICATIONS WITHDRAWN
3
$188,187
4
$173,140
32
$99,918
4
$115,878
3
$67,370
7
$91,431
FILES CLOSED FOR INCOMPLETENESS
0
$0
5
$177,588
9
$175,312
1
$33,690
1
$67,370
0
$0
Aggregated Statistics For Year 2005 (Based on 2 partial tracts)
A) FHA, FSA/RHS & VA Home Purchase Loans
B) Conventional Home Purchase Loans
C) Refinancings
D) Home Improvement Loans
F) Non-occupant Loans on < 5 Family Dwellings (A B C & D)
G) Loans On Manufactured Home Dwelling (A B C & D)
Number
Average Value
Number
Average Value
Number
Average Value
Number
Average Value
Number
Average Value
Number
Average Value
LOANS ORIGINATED
7
$95,473
75
$96,222
120
$89,815
20
$32,068
22
$71,167
42
$48,442
APPLICATIONS APPROVED, NOT ACCEPTED
0
$0
20
$94,520
31
$74,889
1
$26,950
1
$171,120
19
$58,860
APPLICATIONS DENIED
3
$60,183
35
$84,155
150
$86,737
26
$24,253
5
$71,142
59
$66,319
APPLICATIONS WITHDRAWN
0
$0
9
$118,571
81
$111,352
3
$117,673
1
$68,720
19
$73,469
FILES CLOSED FOR INCOMPLETENESS
0
$0
0
$0
7
$71,413
0
$0
0
$0
0
$0
Aggregated Statistics For Year 2004 (Based on 2 partial tracts)
A) FHA, FSA/RHS & VA Home Purchase Loans
B) Conventional Home Purchase Loans
C) Refinancings
D) Home Improvement Loans
F) Non-occupant Loans on < 5 Family Dwellings (A B C & D)
G) Loans On Manufactured Home Dwelling (A B C & D)
Number
Average Value
Number
Average Value
Number
Average Value
Number
Average Value
Number
Average Value
Number
Average Value
LOANS ORIGINATED
12
$106,220
71
$87,050
143
$103,882
8
$29,980
22
$78,272
47
$71,240
APPLICATIONS APPROVED, NOT ACCEPTED
0
$0
16
$58,275
43
$115,406
0
$0
1
$67,370
15
$51,830
APPLICATIONS DENIED
1
$164,380
34
$85,877
115
$88,401
11
$19,598
1
$64,680
54
$73,259
APPLICATIONS WITHDRAWN
1
$92,970
9
$125,458
54
$103,500
1
$202,110
0
$0
5
$69,526
FILES CLOSED FOR INCOMPLETENESS
0
$0
1
$52,550
5
$147,406
0
$0
0
$0
1
$52,550
Aggregated Statistics For Year 2003 (Based on 2 full and 6 partial tracts)
A) FHA, FSA/RHS & VA Home Purchase Loans
B) Conventional Home Purchase Loans
C) Refinancings
D) Home Improvement Loans
F) Non-occupant Loans on < 5 Family Dwellings (A B C & D)
Number
Average Value
Number
Average Value
Number
Average Value
Number
Average Value
Number
Average Value
LOANS ORIGINATED
25
$107,108
197
$105,794
650
$97,793
32
$18,723
51
$84,172
APPLICATIONS APPROVED, NOT ACCEPTED
2
$77,645
28
$78,227
114
$87,326
7
$38,340
1
$73,800
APPLICATIONS DENIED
7
$125,426
75
$93,195
320
$89,877
27
$34,224
9
$54,422
APPLICATIONS WITHDRAWN
2
$141,885
37
$100,539
96
$96,733
0
$0
7
$41,837
FILES CLOSED FOR INCOMPLETENESS
1
$159,270
10
$80,339
19
$102,734
1
$84,320
0
$0
Aggregated Statistics For Year 2002 (Based on 2 partial tracts)
A) FHA, FSA/RHS & VA Home Purchase Loans
B) Conventional Home Purchase Loans
C) Refinancings
D) Home Improvement Loans
F) Non-occupant Loans on < 5 Family Dwellings (A B C & D)
Number
Average Value
Number
Average Value
Number
Average Value
Number
Average Value
Number
Average Value
LOANS ORIGINATED
5
$106,268
20
$107,741
61
$96,101
2
$54,540
1
$51,530
APPLICATIONS APPROVED, NOT ACCEPTED
0
$0
3
$68,927
9
$81,419
1
$12,710
0
$0
APPLICATIONS DENIED
1
$64,910
7
$90,437
25
$94,678
1
$15,390
0
$0
APPLICATIONS WITHDRAWN
1
$57,550
0
$0
14
$90,486
1
$48,850
0
$0
FILES CLOSED FOR INCOMPLETENESS
1
$48,850
1
$84,990
3
$124,470
0
$0
1
$50,190
Aggregated Statistics For Year 2001 (Based on 2 partial tracts)
A) FHA, FSA/RHS & VA Home Purchase Loans
B) Conventional Home Purchase Loans
C) Refinancings
D) Home Improvement Loans
F) Non-occupant Loans on < 5 Family Dwellings (A B C & D)
Number
Average Value
Number
Average Value
Number
Average Value
Number
Average Value
Number
Average Value
LOANS ORIGINATED
4
$86,828
31
$98,156
70
$84,721
8
$12,548
5
$94,892
APPLICATIONS APPROVED, NOT ACCEPTED
1
$58,220
3
$41,713
8
$69,764
1
$6,690
1
$35,470
APPLICATIONS DENIED
0
$0
17
$75,738
25
$77,199
3
$18,070
1
$35,470
APPLICATIONS WITHDRAWN
0
$0
4
$80,638
7
$72,083
1
$44,840
0
$0
FILES CLOSED FOR INCOMPLETENESS
0
$0
1
$78,970
1
$101,050
0
$0
0
$0
Aggregated Statistics For Year 2000 (Based on 2 partial tracts)
A) FHA, FSA/RHS & VA Home Purchase Loans
B) Conventional Home Purchase Loans
C) Refinancings
D) Home Improvement Loans
F) Non-occupant Loans on < 5 Family Dwellings (A B C & D)
Number
Average Value
Number
Average Value
Number
Average Value
Number
Average Value
Number
Average Value
LOANS ORIGINATED
6
$93,018
21
$74,632
39
$76,461
9
$13,830
3
$72,273
APPLICATIONS APPROVED, NOT ACCEPTED
1
$28,110
4
$119,452
7
$67,971
3
$22,083
1
$66,920
APPLICATIONS DENIED
3
$63,350
23
$50,947
23
$82,457
7
$13,097
0
$0
APPLICATIONS WITHDRAWN
1
$38,810
1
$133,170
9
$66,028
1
$47,510
0
$0
FILES CLOSED FOR INCOMPLETENESS
1
$46,170
0
$0
1
$36,140
0
$0
0
$0
Aggregated Statistics For Year 1999 (Based on 1 full and 3 partial tracts)
A) FHA, FSA/RHS & VA Home Purchase Loans
B) Conventional Home Purchase Loans
C) Refinancings
D) Home Improvement Loans
F) Non-occupant Loans on < 5 Family Dwellings (A B C & D)
2002 - 2018 National Fire Incident Reporting System (NFIRS) incidents
According to the data from the years 2002 - 2018 the average number of fire incidents per year is 62. The highest number of fire incidents - 89 took place in 2010, and the least - 11 in 2005. The data has a rising trend.
When looking into fire subcategories, the most incidents belonged to: Structure Fires (43.9%), and Outside Fires (34.4%).
Fire incident types reported to NFIRS in Zip Code 28168

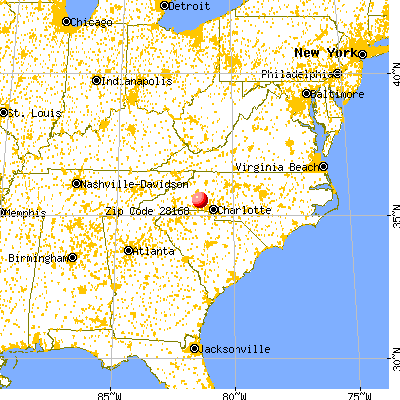


 Nearest zip codes: 28602, 28612, 28021, 28033, 28637, 28090.


 According to the data from the years 2002 - 2018 the average number of fire incidents per year is 62. The highest number of fire incidents - 89 took place in 2010, and the least - 11 in 2005. The data has a rising trend.
 When looking into fire subcategories, the most incidents belonged to: Structure Fires (43.9%), and Outside Fires (34.4%).