Estimated zip code population in 2022: 28,453 Zip code population in 2010: 26,311 Zip code population in 2000: 22,714
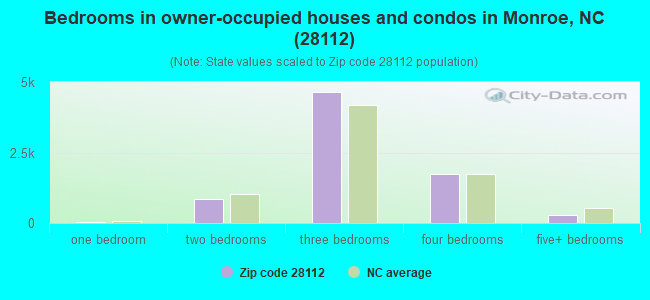
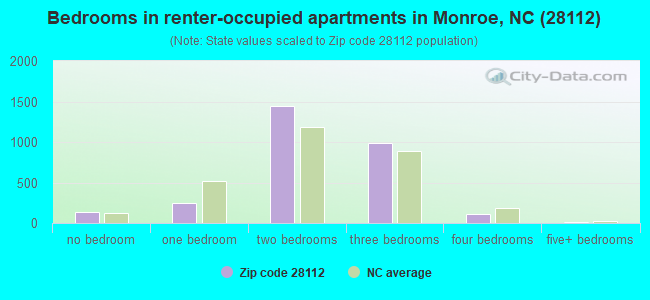
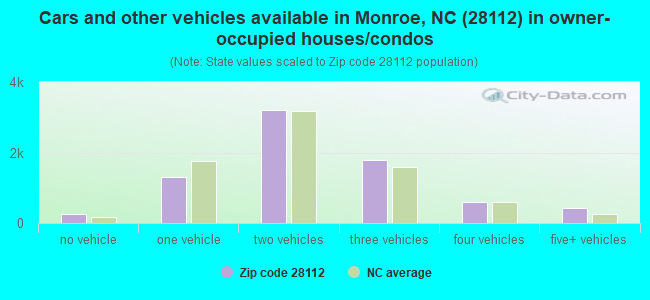
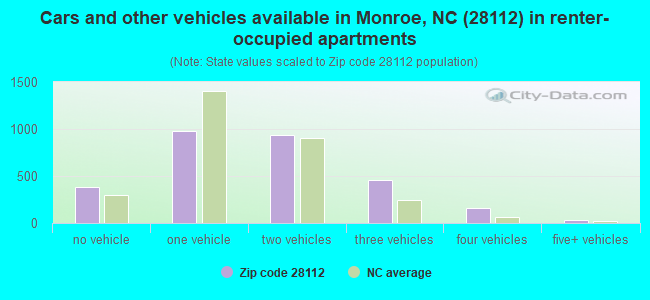
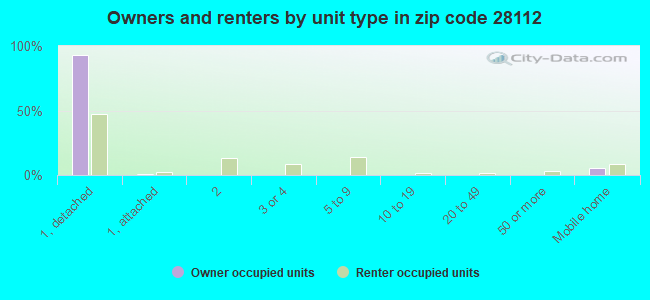
Houses and condos: 10,938 Renter-occupied apartments: 2,943
% of renters here:
28%
State:
33%
March 2022 cost of living index in zip code 28112: 81.7 (low, U.S. average is 100)
Land area: 132.1 sq. mi. Water area: 1.7 sq. mi.
Population density: 215 people per square mile
(very low).
OSM Map
General Map
Google Map
MSN Map
OSM Map
General Map
Google Map
MSN Map
OSM Map
General Map
Google Map
MSN Map
OSM Map
General Map
Google Map
MSN Map
Please wait while loading the map...
Real estate property taxes paid for housing units in 2022:
This zip code:
0.5% ($1,508)
North Carolina:
0.6% ($1,769)
Median real estate property taxes paid for housing units with mortgages in 2022: $1,521 (0.5%) Median real estate property taxes paid for housing units with no mortgage in 2022: $1,440 (0.6%)
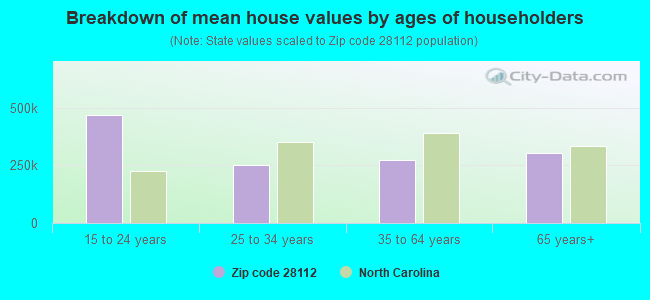
Estimated median house/condo value in 2022: $280,600
28112:
$280,600
North Carolina:
$280,600
According to our research of North Carolina and other state lists, there were 56 registered sex offenders living in 28112 zip code as of April 27, 2024. The ratio of all residents to sex offenders in zip code 28112 is 478 to 1. The ratio of registered sex offenders to all residents in this zip code is near the state average.
Median resident age:
This zip code:
39.7 years
North Carolina median age:
39.2 years
Average household size:
This zip code:
2.6 people
North Carolina:
2.4 people
Averages for the 2020 tax year for zip code 28112, filed in 2021:
Average Adjusted Gross Income (AGI) in 2020: $53,539 (Individual Income Tax Returns)
Here:
$53,539
State:
$70,020
Salary/wage: $46,779 (reported on 83.2% of returns)
Here:
$46,779
State:
$58,387
(% of AGI for various income ranges: 1210.2% for AGIs below $25k, 3896.2% for AGIs $25k-50k, 7080.8% for AGIs $50k-75k, 10328.3% for AGIs $75k-100k, 18967.0% for AGIs $100k-200k, 60872.9% for AGIs over 200k)
Taxable interest for individuals: $1,227 (reported on 20.9% of returns)
This zip code:
$1,227
North Carolina:
$1,479
(% of AGI for various income ranges: 9.6% for AGIs below $25k, 12.7% for AGIs $25k-50k, 40.9% for AGIs $50k-75k, 51.7% for AGIs $75k-100k, 64.2% for AGIs $100k-200k, 1698.6% for AGIs over 200k)
Ordinary dividends: $4,192 (reported on 11.2% of returns)
Here:
$4,192
State:
$7,888
(% of AGI for various income ranges: 11.6% for AGIs below $25k, 20.0% for AGIs $25k-50k, 47.4% for AGIs $50k-75k, 85.6% for AGIs $75k-100k, 159.7% for AGIs $100k-200k, 3637.1% for AGIs over 200k)
Net capital gain/loss in AGI: +$17,831 (reported on 9.8% of returns)
Here:
+$17,831
State:
+$23,652
(% of AGI for various income ranges: 3.8% for AGIs below $25k, 16.1% for AGIs $25k-50k, 86.5% for AGIs $50k-75k, 164.9% for AGIs $75k-100k, 390.6% for AGIs $100k-200k, 22837.1% for AGIs over 200k)
Profit/loss from business: +$10,003 (reported on 18.7% of returns)
Here:
+$10,003
State:
+$11,710
(% of AGI for various income ranges: 199.5% for AGIs below $25k, 201.4% for AGIs $25k-50k, 274.1% for AGIs $50k-75k, 346.9% for AGIs $75k-100k, 625.1% for AGIs $100k-200k, 1458.6% for AGIs over 200k)
Taxable individual retirement arrangement distribution: $17,902 (reported on 7.2% of returns)
28112:
$17,902
North Carolina:
$20,247
(% of AGI for various income ranges: 47.1% for AGIs below $25k, 73.2% for AGIs $25k-50k, 168.3% for AGIs $50k-75k, 297.3% for AGIs $75k-100k, 751.0% for AGIs $100k-200k, 4165.7% for AGIs over 200k)
Self-employed (Keogh) retirement plans: $14,700 (reported on 0.2% of returns)
28112:
$14,700
North Carolina:
$26,749
(% of AGI for various income ranges: 22.6% for AGIs $50k-75k)
Total itemized deductions: $29,415 (reported on 5.0% of returns)
Here:
$29,415
State:
$34,549
(% of AGI for various income ranges: 39.5% for AGIs below $25k, 73.4% for AGIs $25k-50k, 207.5% for AGIs $50k-75k, 311.4% for AGIs $75k-100k, 808.0% for AGIs $100k-200k, 6357.1% for AGIs over 200k)
Charity contributions: $11,254 (reported on 4.2% of returns)
Here:
$11,254
State:
$13,360
(% of AGI for various income ranges: 4.5% for AGIs below $25k, 20.2% for AGIs $25k-50k, 52.8% for AGIs $50k-75k, 59.7% for AGIs $75k-100k, 265.5% for AGIs $100k-200k, 3138.6% for AGIs over 200k)
Taxes paid: $6,445 (reported on 5.0% of returns)
28112:
$6,445
State:
$7,586
(% of AGI for various income ranges: 4.0% for AGIs below $25k, 11.7% for AGIs $25k-50k, 38.8% for AGIs $50k-75k, 77.3% for AGIs $75k-100k, 231.5% for AGIs $100k-200k, 1248.6% for AGIs over 200k)
Earned income credit: $2,406 (reported on 20.0% of returns)
Here:
$2,406
State:
$2,337
(% of AGI for various income ranges: 117.2% for AGIs below $25k, 83.3% for AGIs $25k-50k, 1.6% for AGIs $50k-75k)
Percentage of individuals using paid preparers for their 2020 taxes: 93.5%
Here:
93%
State:
93%
(% for various income ranges: 92.2% for AGIs below $25k, 93.8% for AGIs $25k-50k, 94.1% for AGIs $50k-75k, 95.3% for AGIs $75k-100k, 94.0% for AGIs $100k-200k, 95.7% for AGIs over 200k)
Averages for the 2012 tax year for zip code 28112, filed in 2013:
Average Adjusted Gross Income (AGI) in 2012: $43,576 (Individual Income Tax Returns)
Here:
$43,576
State:
$54,937
Salary/wage: $38,141 (reported on 85.4% of returns)
Here:
$38,141
State:
$46,336
(% of AGI for various income ranges: 76.8% for AGIs below $25k, 83.6% for AGIs $25k-50k, 79.4% for AGIs $50k-75k, 76.0% for AGIs $75k-100k, 73.2% for AGIs $100k-200k, 46.6% for AGIs over 200k)
Taxable interest for individuals: $1,379 (reported on 25.3% of returns)
This zip code:
$1,379
North Carolina:
$1,298
(% of AGI for various income ranges: 0.7% for AGIs below $25k, 0.5% for AGIs $25k-50k, 0.4% for AGIs $50k-75k, 0.8% for AGIs $75k-100k, 0.6% for AGIs $100k-200k, 2.7% for AGIs over 200k)
Ordinary dividends: $3,012 (reported on 12.1% of returns)
Here:
$3,012
State:
$6,213
(% of AGI for various income ranges: 0.6% for AGIs below $25k, 0.5% for AGIs $25k-50k, 0.4% for AGIs $50k-75k, 0.9% for AGIs $75k-100k, 0.8% for AGIs $100k-200k, 2.7% for AGIs over 200k)
Net capital gain/loss in AGI: +$5,554 (reported on 8.4% of returns)
Here:
+$5,554
State:
+$12,740
(% of AGI for various income ranges: 0.3% for AGIs $25k-50k, 0.5% for AGIs $50k-75k, 1.0% for AGIs $75k-100k, 1.4% for AGIs $100k-200k, 4.9% for AGIs over 200k)
Profit/loss from business: +$8,120 (reported on 16.3% of returns)
Here:
+$8,120
State:
+$10,311
(% of AGI for various income ranges: 8.7% for AGIs below $25k, 2.0% for AGIs $25k-50k, 2.3% for AGIs $50k-75k, 1.9% for AGIs $75k-100k, 2.5% for AGIs $100k-200k, 2.0% for AGIs over 200k)
Taxable individual retirement arrangement distribution: $15,014 (reported on 9.0% of returns)
28112:
$15,014
North Carolina:
$15,575
(% of AGI for various income ranges: 2.7% for AGIs below $25k, 1.8% for AGIs $25k-50k, 2.8% for AGIs $50k-75k, 3.4% for AGIs $75k-100k, 3.9% for AGIs $100k-200k, 4.7% for AGIs over 200k)
Self-employment retirement plans: $37,250 (reported on 0.2% of returns)
28112:
$37,250
North Carolina:
$21,078
Total itemized deductions: $19,125 (24% of AGI, reported on 31.0% of returns)
Here:
$19,125
State:
$23,438
Here:
23.6% of AGI
State:
21.5% of AGI
(% of AGI for various income ranges: 8.6% for AGIs below $25k, 10.9% for AGIs $25k-50k, 15.3% for AGIs $50k-75k, 16.3% for AGIs $75k-100k, 16.3% for AGIs $100k-200k, 13.4% for AGIs over 200k)
Charity contributions: $3,796 (reported on 25.5% of returns)
Here:
$3,796
State:
$4,687
(% of AGI for various income ranges: 0.9% for AGIs below $25k, 1.6% for AGIs $25k-50k, 2.3% for AGIs $50k-75k, 2.7% for AGIs $75k-100k, 3.2% for AGIs $100k-200k, 2.4% for AGIs over 200k)
Taxes paid: $6,447 (reported on 30.9% of returns)
28112:
$6,447
State:
$8,823
(% of AGI for various income ranges: 1.5% for AGIs below $25k, 2.6% for AGIs $25k-50k, 4.5% for AGIs $50k-75k, 5.5% for AGIs $75k-100k, 6.7% for AGIs $100k-200k, 7.2% for AGIs over 200k)
Earned income credit: $2,548 (reported on 23.8% of returns)
Here:
$2,548
State:
$2,376
(% of AGI for various income ranges: 8.5% for AGIs below $25k, 1.2% for AGIs $25k-50k)
Percentage of individuals using paid preparers for their 2012 taxes: 63.8%
Here:
64%
State:
53%
(% for various income ranges: 63.6% for AGIs below $25k, 64.7% for AGIs $25k-50k, 62.9% for AGIs $50k-75k, 63.2% for AGIs $75k-100k, 61.6% for AGIs $100k-200k, 75.0% for AGIs over 200k)
Averages for the 2004 tax year for zip code 28112, filed in 2005:
Average Adjusted Gross Income (AGI) in 2004: $39,539 (Individual Income Tax Returns)
Here:
$39,539
State:
$45,376
Salary/wage: $34,998 (reported on 87.3% of returns)
Here:
$34,998
State:
$39,442
(% of AGI for various income ranges: 143.4% for AGIs below $10k, 82.3% for AGIs $10k-25k, 84.5% for AGIs $25k-50k, 83.4% for AGIs $50k-75k, 81.8% for AGIs $75k-100k, 55.0% for AGIs over 100k)
Taxable interest for individuals: $1,567 (reported on 34.7% of returns)
This zip code:
$1,567
North Carolina:
$1,515
(% of AGI for various income ranges: 4.5% for AGIs below $10k, 1.7% for AGIs $10k-25k, 0.9% for AGIs $25k-50k, 0.8% for AGIs $50k-75k, 0.9% for AGIs $75k-100k, 2.4% for AGIs over 100k)
Taxable dividends: $3,322 (reported on 17.7% of returns)
Here:
$3,322
State:
$4,016
(% of AGI for various income ranges: 2.4% for AGIs below $10k, 0.8% for AGIs $10k-25k, 0.9% for AGIs $25k-50k, 0.8% for AGIs $50k-75k, 0.9% for AGIs $75k-100k, 3.5% for AGIs over 100k)
Net capital gain/loss: +$8,801 (reported on 12.2% of returns)
Here:
+$8,801
State:
+$11,152
(% of AGI for various income ranges: -0.7% for AGIs below $10k, 0.2% for AGIs $10k-25k, 0.6% for AGIs $25k-50k, 0.8% for AGIs $50k-75k, 1.1% for AGIs $75k-100k, 9.2% for AGIs over 100k)
Profit/loss from business: +$9,189 (reported on 14.8% of returns)
Here:
+$9,189
State:
+$9,490
(% of AGI for various income ranges: 9.1% for AGIs below $10k, 4.4% for AGIs $10k-25k, 3.2% for AGIs $25k-50k, 2.2% for AGIs $50k-75k, 2.8% for AGIs $75k-100k, 4.4% for AGIs over 100k)
IRA payment deduction: $3,245 (reported on 2.3% of returns)
28112:
$3,245
North Carolina:
$2,967
(% of AGI for various income ranges: 0.2% for AGIs $10k-25k, 0.2% for AGIs $25k-50k, 0.2% for AGIs $50k-75k, 0.1% for AGIs $75k-100k, 0.2% for AGIs over 100k)
Self-employed pension: $14,222 (reported on 0.4% of returns)
Here:
$14,222
North Carolina:
$14,754
Total itemized deductions: $16,610 (24% of AGI, reported on 36.4% of returns)
Here:
$16,610
State:
$19,464
Here:
23.9% of AGI
State:
22.7% of AGI
(% of AGI for various income ranges: 16.0% for AGIs below $10k, 9.1% for AGIs $10k-25k, 15.1% for AGIs $25k-50k, 17.8% for AGIs $50k-75k, 18.0% for AGIs $75k-100k, 14.7% for AGIs over 100k)
Charity contributions deductions: $3,592 (5% of AGI, reported on 31.4% of returns)
Here:
$3,592
State:
$4,035
Here:
4.9% of AGI
State:
4.5% of AGI
(% of AGI for various income ranges: 1.5% for AGIs below $10k, 1.3% for AGIs $10k-25k, 2.4% for AGIs $25k-50k, 3.0% for AGIs $50k-75k, 3.1% for AGIs $75k-100k, 3.9% for AGIs over 100k)
Total tax: $5,519 (reported on 68.8% of returns)
28112:
$5,519
State:
$7,257
(% of AGI for various income ranges: 3.8% for AGIs below $10k, 3.2% for AGIs $10k-25k, 6.0% for AGIs $25k-50k, 7.9% for AGIs $50k-75k, 9.9% for AGIs $75k-100k, 18.4% for AGIs over 100k)
Earned income credit: $1,947 (reported on 19.0% of returns)
Here:
$1,947
State:
$1,851
Percentage of individuals using paid preparers for their 2004 taxes: 67.9%
Here:
68%
State:
62%
(% for various income ranges: 58.4% for AGIs below $10k, 73.6% for AGIs $10k-25k, 69.1% for AGIs $25k-50k, 66.9% for AGIs $50k-75k, 64.6% for AGIs $75k-100k, 70.4% for AGIs over 100k)
Likely homosexual households (counted as self-reported same-sex unmarried-partner households)
Lesbian couples: 0.2% of all households
Gay men: 0.0% of all households
Household received Food Stamps/SNAP in the past 12 months: 1,478 Household did not receive Food Stamps/SNAP in the past 12 months: 9,036
Women who had a birth in the past 12 months: 398 (329 now married, 73 unmarried) Women who did not have a birth in the past 12 months: 5,586 (2,834 now married, 2,760 unmarried)
Housing units in zip code 28112 with a mortgage: 5,178 (558 second mortgage, 23 home equity loan, 477 both second mortgage and home equity loan) Houses without a mortgage: 670
Median monthly owner costs for units with a mortgage: $1,322 Median monthly owner costs for units without a mortgage: $407
Residents with income below the poverty level in 2022:
This zip code:
11.6%
Whole state:
12.8%
Residents with income below 50% of the poverty level in 2022:
This zip code:
5.5%
Whole state:
6.8%
Median number of rooms in houses and condos:
Here:
6.5
State:
6.4
Median number of rooms in apartments:
Here:
4.5
State:
4.4
Notable locations in this zip code not listed on our city pages
Notable locations in zip code 28112: Monroe Country Club and Golf Course (A), Sunset Plaza (B), Guardian Care Convalescent Center (C). Display/hide their locations on the map
Churches in zip code 28112 include: Antioch Church (A), Liberty Church (B), Turner Church (C), Union Church (D), Belmont Church (E), Bethany Church (F), Macedonia Church (G), Beulah Church (H), Midway Church (I). Display/hide their locations on the map
4,137 married couples with children.
1,702 single-parent households (665 men, 1,037 women).
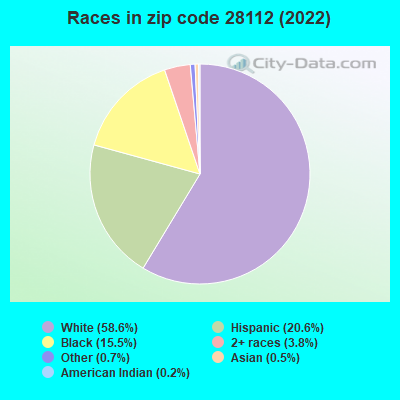
79.7% of residents of 28112 zip code speak English at home.
19.4% of residents speak Spanish at home (47% very well, 23% well, 18% not well, 13% not at all).
0.5% of residents speak other Indo-European language at home (52% very well, 48% well).
0.1% of residents speak Asian or Pacific Island language at home (53% very well, 47% well).
0.2% of residents speak other language at home (100% well).
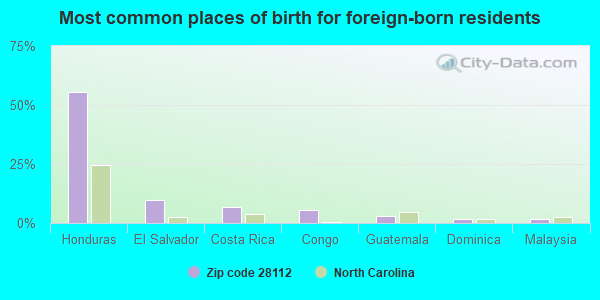
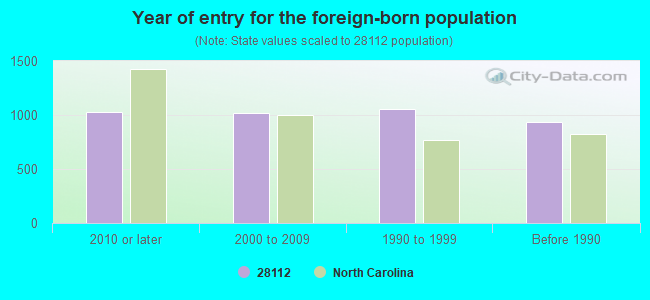
Foreign born population: 3,710 (13.0%) (31.1% of them are naturalized citizens)
Facilities with environmental interests located in this zip code:
CHELSEA LABORATORIES INCORPORATED (2021 E. ROOSEVELT BLVD. in MONROE, NC)
AIR MINOR (AIRS/AFS) STATE MASTER (North Carolina facility info) - -115DA4YG000T3D84DY0J0ANE05, WASTEWATER FACILITY STATE MASTER (North Carolina facility info) - AIR PROGRAM (Resource Conservation and Recovery Act (tracking hazardous waste)) Business SIC classification: MEDICINAL CHEMICALS AND BOTANICAL PRODUCTS; CHEMICALS AND CHEMICAL PREPARATIONS Business NAICS classification: MEDICINAL AND BOTANICAL MANUFACTURING. Organizations: R P SCHERER CORP (CONTACT/OWNER)
, HOESCHT MARION ROUSSEL (CONTACT/OWNER)
Alternative names: R.P. SCHERER CORPORATION, SCHERER R P (SE) CORP
AIR MINOR (AIRS/AFS) STATE MASTER (North Carolina facility info) - AIR PROGRAM CRITERIA AND HAZARDOUS AIR POLLUTANT INVENTORY (Inventory of air pollution sources) HAZARDOUS WASTE BIENNIAL REPORTER (Resource Conservation and Recovery Act (tracking hazardous waste)) Large Quantity Generators, more that 1000 kg of hazardous waste/month (Resource Conservation and Recovery Act (tracking hazardous waste)) - notification TRI REPORTER (Tracking of toxic chemicals releasing facilities) Business SIC classification: COATING, ENGRAVING, AND ALLIED SERVICES Business NAICS classification: PLATE WORK MANUFACTURING.; ALL OTHER MISCELLANEOUS FABRICATED METAL PRODUCT MANUFACTURING. Organizations: JACK SHARRETT (CONTACT/OPERATOR)
Alternative names: ACME NAMEPLATE DIV GM NAMEPLATE, GM NAMEPLATE, INC, ACME NAMEPLATE DIV, GENERAL MOTORS NAMEPLATE ACME DIVISION, GM NAMEPLATE NC DIV, GENERAL MOTORS NAMEPLATE INCORPORATED ACME NAMEPLATE DIVISION
BENTON HEIGHTS ELEMENTARY (1200 CONCORD AVE in MONROE, NC)
STATE MASTER (North Carolina facility info) - UNDERGROUND STORAGE TANK PROGRAM (National Center for Education Statistics) - STATE ID-304 Business SIC classification: NONCLASSIFIABLE ESTABLISHMENTS Organizations: UNION COUNTY PUBLIC SCHOOLS (SCHOOL DISTRICT)
Alternative names: BENTON HEIGHTS SCHOOL
BANTAM MART (5432 OLD PAGELAND HWY in MONROE, NC)
STATE MASTER (North Carolina facility info) - UNDERGROUND STORAGE TANK PROGRAM National Pollutant Discharge Elimination System NON-MAJOR (Tracking pollutant discharge elimination systems) - permit Business SIC classification: GASOLINE SERVICE STATIONS; NONCLASSIFIABLE ESTABLISHMENTS Alternative names: BANTAM MART #23909
AMOCO #6 (2030 EAST ROOSEVELT BLVD in MONROE, NC)
STATE MASTER (North Carolina facility info) - UNDERGROUND STORAGE TANK PROGRAM Conditionally Exempt Small Quantity Generators, less than 100 kg/month of hazardous waste (Resource Conservation and Recovery Act (tracking hazardous waste)) - notification Business SIC classification: NONCLASSIFIABLE ESTABLISHMENTS Organizations: MONROE OIL COMPANY INC (CONTACT/OWNER)
DOLSONS PROPERTY (3220 LANCASTER HWY in MONROE, NC)
(Resource Conservation and Recovery Act (tracking hazardous waste))
Housing units lacking complete plumbing facilities: 1.3% Housing units lacking complete kitchen facilities: 1.2%
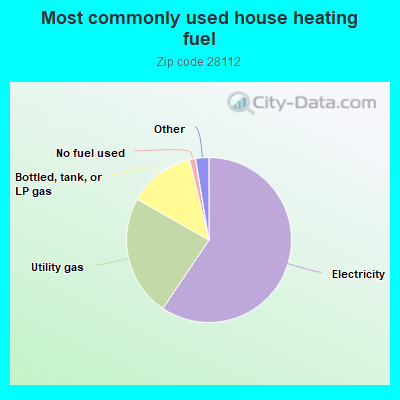
59.5%Electricity
23.8%Utility gas
13.0%Bottled, tank, or LP gas
1.2%No fuel used
1.0%Fuel oil, kerosene, etc.
0.9%Wood
0.7%Other fuel
Population in 1990: 9,986. Population change in the 1990s: +12,728 (+127.5%).
Place of birth for U.S.-born residents:
This state: 15,900
Northeast: 3,069
Midwest: 1,150
South: 3,651
West: 544
59% of the 28112 zip code residents lived in the same house 5 years ago. Out of people who lived in different houses, 58% lived in this county. Out of people who lived in different counties, 50% lived in North Carolina.
92% of the 28112 zip code residents lived in the same house 1 year ago. Out of people who lived in different houses, 61% moved from this county. Out of people who lived in different houses, 26% moved from different county within same state. Out of people who lived in different houses, 10% moved from different state.
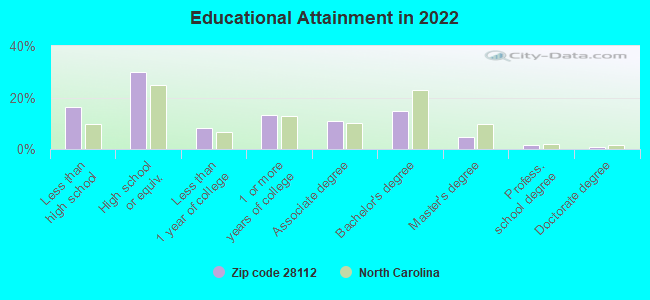
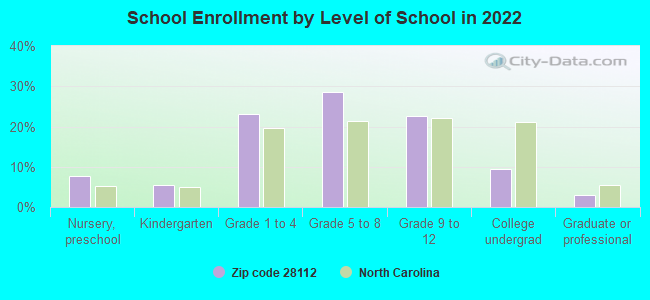
Private vs. public school enrollment:
Students in private schools in grades 1 to 8 (elementary and middle school): 342
Here:
10.9%
North Carolina:
13.8%
Students in private schools in grades 9 to 12 (high school): 157
Here:
11.5%
North Carolina:
11.9%
Students in private undergraduate colleges: 80
Here:
14.0%
North Carolina:
19.3%
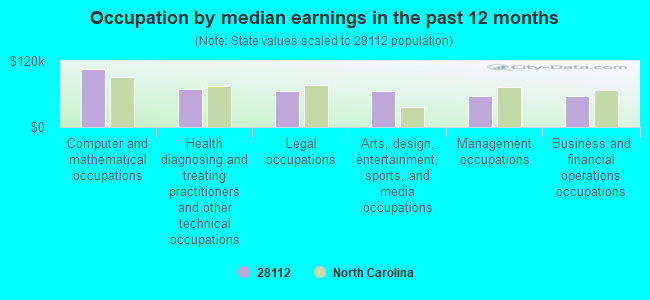
Occupation by median earnings in the past 12 months ($)
106,328Computer and mathematical occupations
68,672Health diagnosing and treating practitioners and other technical occupations
65,221Legal occupations
64,564Arts, design, entertainment, sports, and media occupations
57,265Management occupations
56,573Business and financial operations occupations
Companies with federal contracts located in this zip code (MONROE, NC):
OPERATING AND MAINTENANCE SPEC (694 W CROWELL ST) : $31,861 in 11 contractsfrom 2004 to 2005
Contracts for Pressure, Temperature, and Humidity Measuring and Controlling Instruments by Defense Logistics Agency, Navy Signed by year:2000: $0; 2001: $0; 2002: $0; 2003: $0; 2004: $2,309; 2005: $29,552; 2006: $0.
Biggest contracts:
$9,205 with Defense Logistics Agency for Pressure, Temperature, and Humidity Measuring and Controlling Instruments. Signed on 2005-08-02. Completion date: 2005-08-02.
$9,205, same as above.Signed on 2005-05-26. Completion date: 2005-07-05.
$8,552, same as above.Signed on 2005-07-14. Completion date: 2005-07-14.
$967 with Navy for Pressure, Temperature, and Humidity Measuring and Controlling Instruments. Signed on 2005-08-10. Completion date: 2005-08-12.
HARRIS TRANSPORT COMPANY (1166 CURTIS ST)
$11,100 with Navy for Other Defense -- Applied Research and Exploratory Development (R&D). Taking place in NY. Signed on 2005-07-18. Completion date: 2005-08-05.
frame first distrubutors (dba: mirror image paint & body; small business)
$9,019 with Bureau of Prisoners/Federal Prison System for Maintenance, Repair and Rebuilding of Equipment -- Ground Effect Vehicles, Motor Vehicles, Trailers, and Cycles. Signed on 2004-11-17. Completion date: 2004-12-31.
FRAME SQUARE INDUSTRIES INC (314-A DEPOT ST; small business)
$3,150 with Air Force for Woodworking Machines. Signed on 2005-09-27. Completion date: 2005-10-27.
Top industries in this zip code by the number of employees in 2005:
Health Care and Social Assistance: Offices of Physicians (except Mental Health Specialists) (50-99 employees: 2 establishments, 20-49 employees: 3 establishments, 10-19 employees: 3 establishments, 5-9 employees: 9 establishments, 1-4 employees: 13 establishments)
Health Care and Social Assistance: Nursing Care Facilities (100-249: 2)
Other Services (except Public Administration): Religious Organizations (20-49: 2, 10-19: 4, 5-9: 3, 1-4: 14)
2002 - 2018 National Fire Incident Reporting System (NFIRS) incidents
Based on the data from the years 2002 - 2018 the average number of fire incidents per year is 60. The highest number of reported fires - 101 took place in 2018, and the least - 20 in 2014. The data has a rising trend.
When looking into fire subcategories, the most reports belonged to: Outside Fires (39.4%), and Structure Fires (36.8%).
Fire incident types reported to NFIRS in Zip Code 28112


 Nearest zip codes: 28174, 28108, 28110, 28173, 29728, 28104.


 Based on the data from the years 2002 - 2018 the average number of fire incidents per year is 60. The highest number of reported fires - 101 took place in 2018, and the least - 20 in 2014. The data has a rising trend.
 When looking into fire subcategories, the most reports belonged to: Outside Fires (39.4%), and Structure Fires (36.8%).