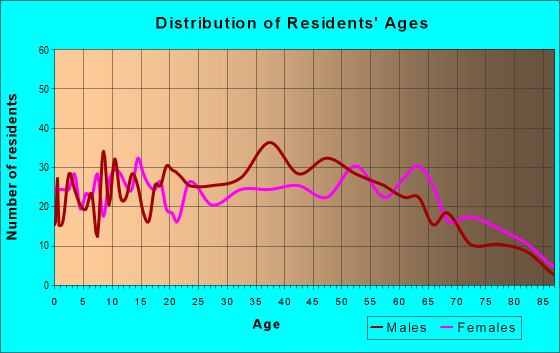
Estimated zip code population in 2022: 4,043 Zip code population in 2010: 3,929 Zip code population in 2000: 4,213
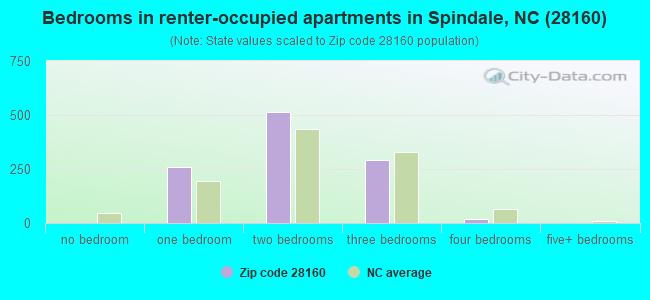
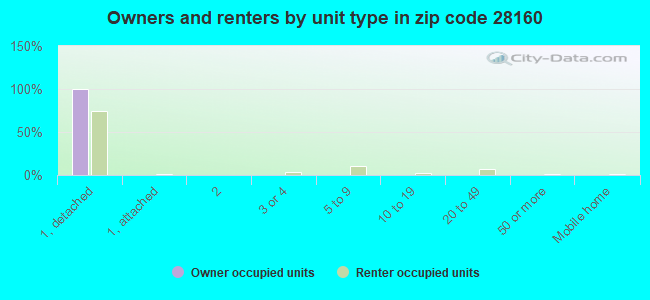
Houses and condos: 2,299 Renter-occupied apartments: 1,087
% of renters here:
54%
State:
33%
March 2022 cost of living index in zip code 28160: 79.1 (low, U.S. average is 100)
Land area: 5.6 sq. mi. Water area: 0.0 sq. mi.
Population density: 721 people per square mile
(low).
OSM Map
General Map
Google Map
MSN Map
OSM Map
General Map
Google Map
MSN Map
OSM Map
General Map
Google Map
MSN Map
OSM Map
General Map
Google Map
MSN Map
Please wait while loading the map...
Real estate property taxes paid for housing units in 2022:
This zip code:
0.9% ($1,199)
North Carolina:
0.6% ($1,769)
Median real estate property taxes paid for housing units with mortgages in 2022: $1,582 (0.9%) Median real estate property taxes paid for housing units with no mortgage in 2022: $994 (0.9%)
Averages for the 2020 tax year for zip code 28160, filed in 2021:
Average Adjusted Gross Income (AGI) in 2020: $36,359 (Individual Income Tax Returns)
Here:
$36,359
State:
$70,020
Salary/wage: $30,835 (reported on 84.4% of returns)
Here:
$30,835
State:
$58,387
(% of AGI for various income ranges: 1226.7% for AGIs below $25k, 3785.7% for AGIs $25k-50k, 6693.6% for AGIs $50k-75k, 10200.0% for AGIs $75k-100k, 17185.0% for AGIs $100k-200k)
Taxable interest for individuals: $427 (reported on 18.0% of returns)
This zip code:
$427
North Carolina:
$1,479
(% of AGI for various income ranges: 4.6% for AGIs below $25k, 10.5% for AGIs $25k-50k, 19.1% for AGIs $50k-75k, 34.0% for AGIs $75k-100k, 40.0% for AGIs $100k-200k)
Ordinary dividends: $4,283 (reported on 7.2% of returns)
Here:
$4,283
State:
$7,888
(% of AGI for various income ranges: 15.2% for AGIs below $25k, 16.6% for AGIs $25k-50k, 75.5% for AGIs $50k-75k, 662.5% for AGIs $100k-200k)
Net capital gain/loss in AGI: +$13,018 (reported on 6.6% of returns)
Here:
+$13,018
State:
+$23,652
(% of AGI for various income ranges: 21.8% for AGIs $25k-50k, 176.4% for AGIs $50k-75k, 2862.5% for AGIs $100k-200k)
Profit/loss from business: +$7,138 (reported on 12.6% of returns)
Here:
+$7,138
State:
+$11,710
(% of AGI for various income ranges: 86.7% for AGIs below $25k, 82.3% for AGIs $25k-50k, 105.5% for AGIs $50k-75k, 984.0% for AGIs $75k-100k)
Taxable individual retirement arrangement distribution: $12,064 (reported on 6.6% of returns)
28160:
$12,064
North Carolina:
$20,247
(% of AGI for various income ranges: 40.3% for AGIs below $25k, 87.3% for AGIs $25k-50k, 1394.0% for AGIs $75k-100k)
Total itemized deductions: $23,625 (reported on 2.4% of returns)
Here:
$23,625
State:
$34,549
(% of AGI for various income ranges: 859.1% for AGIs $50k-75k)
Charity contributions: $7,350 (reported on 1.2% of returns)
Here:
$7,350
State:
$13,360
(% of AGI for various income ranges: 33.4% for AGIs $25k-50k)
Taxes paid: $5,600 (reported on 1.8% of returns)
28160:
$5,600
State:
$7,586
(% of AGI for various income ranges: 38.2% for AGIs $25k-50k)
Earned income credit: $2,273 (reported on 31.1% of returns)
Here:
$2,273
State:
$2,337
(% of AGI for various income ranges: 118.0% for AGIs below $25k, 105.0% for AGIs $25k-50k)
Percentage of individuals using paid preparers for their 2020 taxes: 95.8%
Here:
96%
State:
93%
(% for various income ranges: 94.9% for AGIs below $25k, 96.4% for AGIs $25k-50k, 93.8% for AGIs $50k-75k, 100.0% for AGIs $75k-100k, 100.0% for AGIs $100k-200k)
Averages for the 2012 tax year for zip code 28160, filed in 2013:
Average Adjusted Gross Income (AGI) in 2012: $28,849 (Individual Income Tax Returns)
Here:
$28,849
State:
$54,937
Salary/wage: $25,174 (reported on 84.7% of returns)
Here:
$25,174
State:
$46,336
(% of AGI for various income ranges: 75.3% for AGIs below $25k, 80.6% for AGIs $25k-50k, 71.3% for AGIs $50k-75k, 72.8% for AGIs $75k-100k, 59.2% for AGIs $100k-200k)
Taxable interest for individuals: $958 (reported on 21.5% of returns)
This zip code:
$958
North Carolina:
$1,298
(% of AGI for various income ranges: 1.1% for AGIs below $25k, 0.5% for AGIs $25k-50k, 0.6% for AGIs $50k-75k, 1.5% for AGIs $75k-100k)
Ordinary dividends: $2,936 (reported on 9.7% of returns)
Here:
$2,936
State:
$6,213
(% of AGI for various income ranges: 1.1% for AGIs below $25k, 1.1% for AGIs $25k-50k, 3.2% for AGIs $75k-100k)
Net capital gain/loss in AGI: +$856 (reported on 6.2% of returns)
Here:
+$856
State:
+$12,740
(% of AGI for various income ranges: 0.3% for AGIs $25k-50k, 1.2% for AGIs $75k-100k)
Profit/loss from business: +$7,186 (reported on 15.3% of returns)
Here:
+$7,186
State:
+$10,311
(% of AGI for various income ranges: 6.7% for AGIs below $25k, 3.1% for AGIs $25k-50k, 5.7% for AGIs $50k-75k)
Taxable individual retirement arrangement distribution: $8,175 (reported on 8.3% of returns)
28160:
$8,175
North Carolina:
$15,575
(% of AGI for various income ranges: 2.9% for AGIs below $25k, 2.6% for AGIs $25k-50k, 4.1% for AGIs $50k-75k)
Total itemized deductions: $18,013 (29% of AGI, reported on 16.0% of returns)
Here:
$18,013
State:
$23,438
Here:
29.0% of AGI
State:
21.5% of AGI
(% of AGI for various income ranges: 5.9% for AGIs below $25k, 7.6% for AGIs $25k-50k, 11.2% for AGIs $50k-75k, 16.8% for AGIs $75k-100k, 16.5% for AGIs $100k-200k)
Charity contributions: $4,263 (reported on 13.2% of returns)
Here:
$4,263
State:
$4,687
(% of AGI for various income ranges: 0.8% for AGIs below $25k, 0.9% for AGIs $25k-50k, 2.7% for AGIs $50k-75k, 4.2% for AGIs $75k-100k, 3.8% for AGIs $100k-200k)
Taxes paid: $4,922 (reported on 16.0% of returns)
28160:
$4,922
State:
$8,823
(% of AGI for various income ranges: 0.9% for AGIs below $25k, 1.5% for AGIs $25k-50k, 3.0% for AGIs $50k-75k, 5.5% for AGIs $75k-100k, 7.0% for AGIs $100k-200k)
Earned income credit: $2,418 (reported on 38.9% of returns)
Here:
$2,418
State:
$2,376
(% of AGI for various income ranges: 10.4% for AGIs below $25k, 1.7% for AGIs $25k-50k)
Percentage of individuals using paid preparers for their 2012 taxes: 58.3%
Here:
58%
State:
53%
(% for various income ranges: 56.5% for AGIs below $25k, 59.5% for AGIs $25k-50k, 61.5% for AGIs $50k-75k, 80.0% for AGIs $75k-100k, 50.0% for AGIs $100k-200k)
Averages for the 2004 tax year for zip code 28160, filed in 2005:
Average Adjusted Gross Income (AGI) in 2004: $26,931 (Individual Income Tax Returns)
Here:
$26,931
State:
$45,376
Salary/wage: $23,333 (reported on 85.6% of returns)
Here:
$23,333
State:
$39,442
(% of AGI for various income ranges: 96.4% for AGIs below $10k, 79.5% for AGIs $10k-25k, 83.9% for AGIs $25k-50k, 73.3% for AGIs $50k-75k, 74.9% for AGIs $75k-100k, 35.2% for AGIs over 100k)
Taxable interest for individuals: $1,177 (reported on 25.7% of returns)
This zip code:
$1,177
North Carolina:
$1,515
(% of AGI for various income ranges: 2.2% for AGIs below $10k, 1.0% for AGIs $10k-25k, 1.2% for AGIs $25k-50k, 0.7% for AGIs $50k-75k, 0.3% for AGIs $75k-100k, 1.6% for AGIs over 100k)
Taxable dividends: $6,238 (reported on 11.7% of returns)
Here:
$6,238
State:
$4,016
(% of AGI for various income ranges: 0.6% for AGIs below $10k, 1.0% for AGIs $10k-25k, 0.9% for AGIs $25k-50k, 0.8% for AGIs $50k-75k, 0.5% for AGIs $75k-100k, 14.1% for AGIs over 100k)
Net capital gain/loss: +$5,181 (reported on 7.3% of returns)
Here:
+$5,181
State:
+$11,152
(% of AGI for various income ranges: -0.4% for AGIs below $10k, -0.1% for AGIs $10k-25k, 0.2% for AGIs $25k-50k, 1.1% for AGIs $50k-75k, 8.6% for AGIs over 100k)
Profit/loss from business: +$8,328 (reported on 12.3% of returns)
Here:
+$8,328
State:
+$9,490
(% of AGI for various income ranges: 6.6% for AGIs below $10k, 5.4% for AGIs $10k-25k, 2.3% for AGIs $25k-50k, 4.2% for AGIs $50k-75k, 10.8% for AGIs $75k-100k)
Total itemized deductions: $16,573 (28% of AGI, reported on 16.8% of returns)
Here:
$16,573
State:
$19,464
Here:
28.0% of AGI
State:
22.7% of AGI
(% of AGI for various income ranges: 6.4% for AGIs $10k-25k, 8.1% for AGIs $25k-50k, 11.9% for AGIs $50k-75k, 16.3% for AGIs $75k-100k, 21.0% for AGIs over 100k)
Charity contributions deductions: $4,424 (7% of AGI, reported on 14.4% of returns)
Here:
$4,424
State:
$4,035
Here:
7.1% of AGI
State:
4.5% of AGI
(% of AGI for various income ranges: 1.1% for AGIs $10k-25k, 1.7% for AGIs $25k-50k, 3.4% for AGIs $50k-75k, 4.6% for AGIs $75k-100k, 4.7% for AGIs over 100k)
Total tax: $3,146 (reported on 62.5% of returns)
28160:
$3,146
State:
$7,257
(% of AGI for various income ranges: 2.0% for AGIs below $10k, 3.3% for AGIs $10k-25k, 6.2% for AGIs $25k-50k, 8.7% for AGIs $50k-75k, 10.6% for AGIs $75k-100k, 15.2% for AGIs over 100k)
Earned income credit: $1,838 (reported on 32.3% of returns)
Here:
$1,838
State:
$1,851
Percentage of individuals using paid preparers for their 2004 taxes: 70.4%
Here:
70%
State:
62%
(% for various income ranges: 63.3% for AGIs below $10k, 73.2% for AGIs $10k-25k, 75.2% for AGIs $25k-50k, 65.9% for AGIs $50k-75k, 61.8% for AGIs $75k-100k, 64.5% for AGIs over 100k)
Household received Food Stamps/SNAP in the past 12 months: 398 Household did not receive Food Stamps/SNAP in the past 12 months: 1,654
Women who did not have a birth in the past 12 months: 908 (357 now married, 550 unmarried)
Housing units in zip code 28160 with a mortgage: 490 (17 second mortgage, 18 both second mortgage and home equity loan) Median monthly owner costs for units with a mortgage: $851 Median monthly owner costs for units without a mortgage: $409
Residents with income below the poverty level in 2022:
This zip code:
13.8%
Whole state:
12.8%
Residents with income below 50% of the poverty level in 2022:
This zip code:
9.7%
Whole state:
6.8%
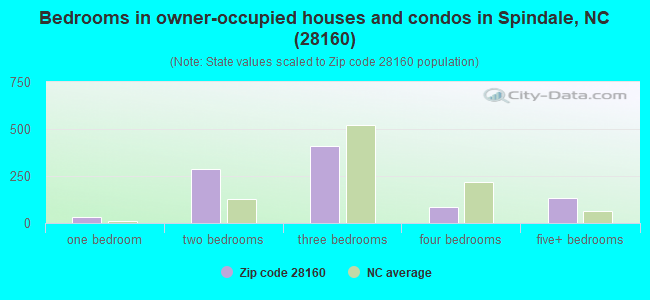
Median number of rooms in houses and condos:
Here:
6.2
State:
6.4
Median number of rooms in apartments:
Here:
4.3
State:
4.4
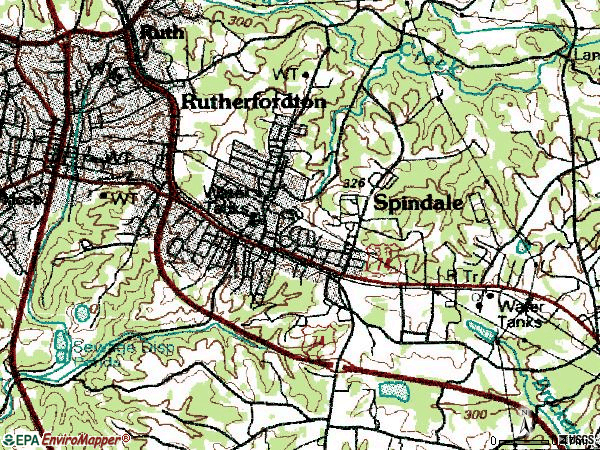
Notable locations in this zip code not listed on our city pages
In group quarters: 343 (-1 institutionalized population)
Size of family households: 516 2-persons, 160 3-persons, 219 4-persons, 15 5-persons, 1 7-or-more-persons
Size of nonfamily households: 1,011 1-person, 110 2-persons
213 married couples with children.
106 single-parent households (11 men, 95 women).
97.0% of residents of 28160 zip code speak English at home.
1.3% of residents speak Spanish at home (85% very well, 10% well, 6% not well).
0.2% of residents speak other Indo-European language at home (100% very well).
0.8% of residents speak Asian or Pacific Island language at home (100% very well).
0.3% of residents speak other language at home (100% very well).
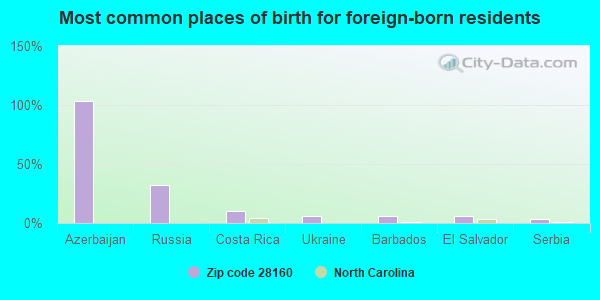
Foreign born population: 31 (0.8%) (55.2% of them are naturalized citizens)
This zip code:
0.8%
Whole state:
8.6%
103%Azerbaijan
32%Russia
10%Costa Rica
6%Ukraine
6%Barbados
6%El Salvador
3%Serbia
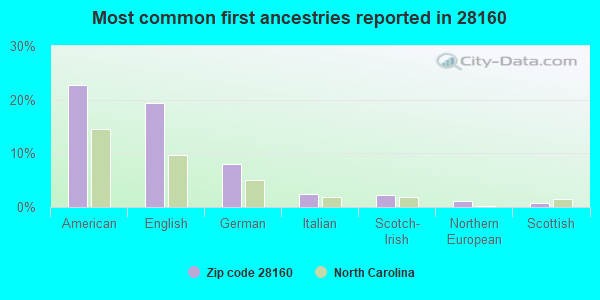
23%American
19%English
8%German
2%Italian
2%Scotch-Irish
1%Northern European
1%Scottish
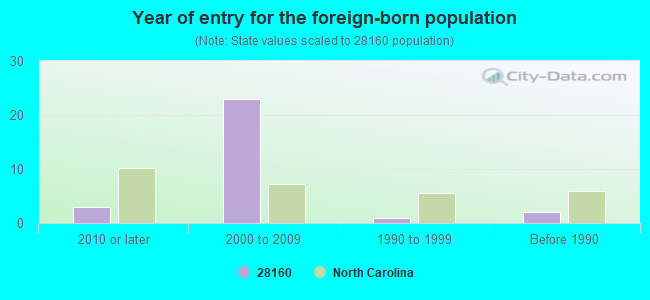
Year of entry for the foreign-born population
32010 or later
232000 to 2009
11990 to 1999
2Before 1990
Facilities with environmental interests located in this zip code:
DUKE POWER COMPANY SPINDALE WATER PLANT (308 OAKLAND ROAD in SPINDALE, NC)
AIR MINOR (AIRS/AFS) STATE MASTER (North Carolina facility info) - AIR PROGRAM Business SIC classification: WATER SUPPLY Business NAICS classification: ALL OTHER MISCELLANEOUS WASTE MANAGEMENT SERVICES. Alternative names: BROAD RIVER WATER AUTHORITY - BROAD RIV, BROAD RIVER WATER AUTHORITY - BROAD RIVER WATER PLANT
CARVER CENTER (900 CARVER ST in SPINDALE, NC)
(National Center for Education Statistics) - STATE ID-316 Organizations: RUTHERFORD COUNTY SCHOOLS (SCHOOL DISTRICT)
Housing units lacking complete plumbing facilities: 3.6% Housing units lacking complete kitchen facilities: 5.2%
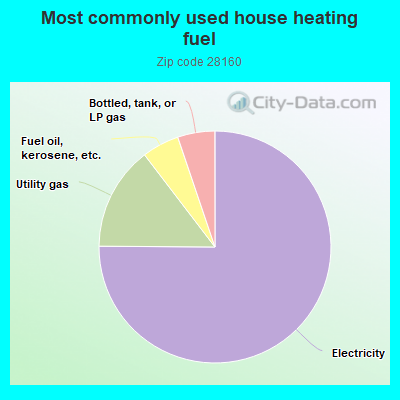
75.2%Electricity
14.5%Utility gas
5.2%Fuel oil, kerosene, etc.
5.2%Bottled, tank, or LP gas
Population in 1990: 4,017. Population change in the 1990s: +196 (+4.9%).
Place of birth for U.S.-born residents:
This state: 2,677
Northeast: 129
Midwest: 310
South: 800
West: 61
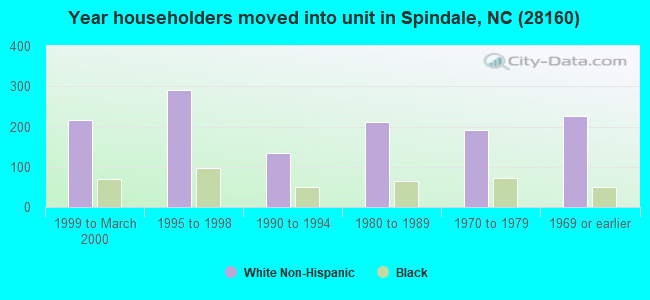
59% of the 28160 zip code residents lived in the same house 5 years ago. Out of people who lived in different houses, 71% lived in this county. Out of people who lived in different counties, 50% lived in North Carolina.
86% of the 28160 zip code residents lived in the same house 1 year ago. Out of people who lived in different houses, 44% moved from this county. Out of people who lived in different houses, 42% moved from different county within same state. Out of people who lived in different houses, 10% moved from different state.
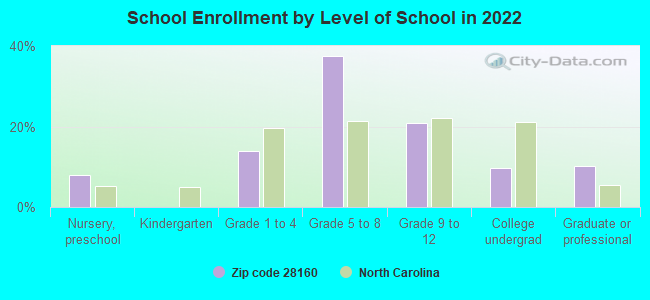
Private vs. public school enrollment:
Students in private schools in grades 1 to 8 (elementary and middle school): 49
Here:
23.8%
North Carolina:
13.8%
Students in private schools in grades 9 to 12 (high school): 1
Here:
1.4%
North Carolina:
11.9%
Students in private undergraduate colleges: 8
Here:
21.4%
North Carolina:
19.3%
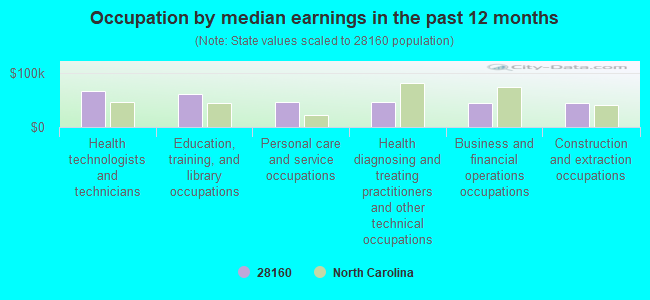
Occupation by median earnings in the past 12 months ($)
66,499Health technologists and technicians
60,466Education, training, and library occupations
46,939Personal care and service occupations
46,392Health diagnosing and treating practitioners and other technical occupations
45,212Business and financial operations occupations
44,089Construction and extraction occupations
Top industries in this zip code by the number of employees in 2005:
Construction: Highway, Street, and Bridge Construction (50-99: 1)
Health Care and Social Assistance: Home Health Care Services (50-99: 1)
Health Care and Social Assistance: Vocational Rehabilitation Services (50-99: 1)
Construction: Electrical Contractors (50-99: 1)
Other Services (except Public Administration): Religious Organizations (10-19: 2, 5-9: 3, 1-4: 5)
Health Care and Social Assistance: Child Day Care Services (10-19: 1, 5-9: 3, 1-4: 2)
People in group quarters in 2010:
237 people in state prisons
43 people in emergency and transitional shelters (with sleeping facilities) for people experiencing homelessness
People in group quarters in 2000:
207 people in state prisons
6 people in nursing homes
5 people in homes for abused, dependent, and neglected children
5 people in other noninstitutional group quarters
Fatal accident statistics in 2014:
Fatal accident count: 3
Vehicles involved in fatal accidents: 5
Fatal accidents caused by drunken drivers: 0
Fatalities: 3
Persons involved in fatal accidents: 12
Pedestrians involved in fatal accidents: 0
2004 - 2018 National Fire Incident Reporting System (NFIRS) incidents
According to the data from the years 2004 - 2018 the average number of fire incidents per year is 23. The highest number of fire incidents - 44 took place in 2014, and the least - 3 in 2004. The data has a growing trend.
When looking into fire subcategories, the most reports belonged to: Structure Fires (39.2%), and Outside Fires (38.6%).
Fire incident types reported to NFIRS in Zip Code 28160
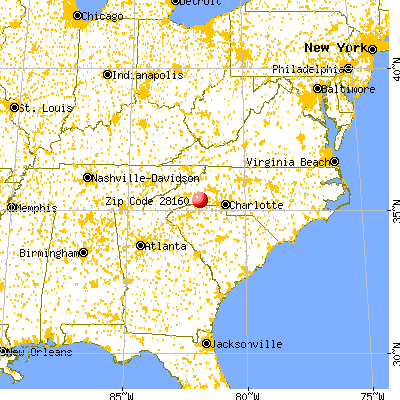


 Nearest zip codes: 28139, 28043, 28167, 28019, 28040, 28076.


 According to the data from the years 2004 - 2018 the average number of fire incidents per year is 23. The highest number of fire incidents - 44 took place in 2014, and the least - 3 in 2004. The data has a growing trend.
 When looking into fire subcategories, the most reports belonged to: Structure Fires (39.2%), and Outside Fires (38.6%).